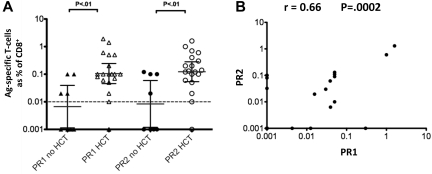
Figure 4.
PR1-specific and PR2-specific T cells are detectable in CML patients. (A) Side-by-side plots showing CD8+ T cells specific for the HLA-A2–restricted epitopes PR1 and PR2 as measured by ex vivo ICC on PBMCs from 27 CML patients using peptides as restimulation Ags (Table 1). For each of the 2 Ags, subjects were divided into 2 groups according to whether they had been treated by HSCT. Background responses to an irrelevant HIV-1 gag HLA-A2 epitope peptide were subtracted. The geometric mean percentage of CD8+ T cells recognizing each of the epitopes is indicated, and the error bars indicate the 95% confidence interval on the log scale. The dashed line at 0.01% indicates the detection limit of the assay. P values were calculated using the Mann-Whitney 2-tailed test. (B) Scatter plot of PR1 IFN-γ responses and PR2 IFN-γ responses. The Pearson correlation coefficient (r = 0.66, P < .0002) is calculated using the logarithmic scale. In both panels A and B, the zero values were set to 0.001 for graphical presentation.

