Abstract
PRIP (phospholipase C-related, but catalytically inactive protein) is a novel protein isolated in this laboratory. PRIP-deficient mice showed increased serum gonadotropins, but decreased gonadal steroid hormones. This imbalance was similar to that for the cause of bone disease, such as osteoporosis. In the present study, therefore, we analyzed mutant mice with special reference to the bone property. We first performed three-dimensional analysis of the femur of female mice. The bone mineral density and trabecular bone volume were higher in mutant mice. We further performed histomorphometrical assay of bone formation parameters: bone formation rate, mineral apposition rate, osteoid thickness, and osteoblast number were up-regulated in the mutant, indicating that increased bone mass is caused by the enhancement of bone formation ability. We then cultured primary cells isolated from calvaria prepared from both genotypes. In mutant mice, osteoblast differentiation, as assessed by alkaline phosphatase activity and the expression of osteoblast differentiation marker genes, was enhanced. Moreover, we analyzed the phosphorylation of Smad1/5/8 in response to bone morphogenetic protein, with longer phosphorylation in the mutant. These results indicate that PRIP is implicated in the negative regulation of bone formation.
Keywords: Bone, Bone Morphogenetic Protein (BMP), Phospholipase C, Phosphoprotein Phosphatase, Phosphorylation Enzymes, SMAD Transcription Factor, Osteoblast, Osteoclast, Ovariectomy
Introduction
Phospholipase C-related, but catalytically inactive protein (PRIP)4 was first identified as a novel d-myo-inositol-1,4,5-trisphosphate-binding protein and tentatively named p130 based on molecular size (1). Subsequent molecular cloning studies revealed that the molecule is similar to phospholipase C-δ1 but is catalytically inactive, which is the reason for its revised name, and is expressed predominantly in the brain (2–5). Later, an isoform with relatively broad tissue distribution, including the brain, was reported (6, 7), indicating that PRIP is composed of types 1 and 2. PRIP has a number of binding partners, including GABARAP (γ-aminobutyric acid type A (GABAA) receptor-associated protein) (8), protein phosphatase-1α (9–11) and -2A (12), and GABAA receptor β subunits (12–14), besides Ins(1,4,5)P3 (1–5). The finding of these binding partners led us to examine the possible involvement of PRIP in Ins(1,4,5)P3-mediated Ca2+ signaling (15, 16) and GABAA receptor signaling (17–20), using cloned culture cells reconstituted with the gene of interest or the gene-silencing technique, and PRIP-1 alone and/or PRIP-1 and -2 gene-deficient mice were also analyzed for GABAA receptor signaling from multiple aspects, including isolated neuron cultures, electrophysiological analysis of brain slices, and behavioral analysis. So far, it is known that there is no great difference between types 1 and 2 regarding the capability of binding to partners described above, therefore, we have mainly used PRIP-1 and -2 gene-deficient mice for further analysis, but not single gene-deficient mice.
During the course of mutant animal maintenance, we noticed that mutant couples exhibited decreased litter events and litter size, indicating dysfunction of the reproductive system. Cross-mating experiments clearly showed that the reproductive defect was in females (21). The hypothalamus-pituitary-gonadal (HPG) axis is central to the reproductive system (22). The release of gonadotropin-releasing hormone from hypothalamus neurons stimulates the secretion of luteinizing hormone (LH) and follicle-stimulating hormone (FSH) from gonadotrophs in the anterior pituitary glands. LH regulates gonadal steroid hormone synthesis and ovulation by mature follicle rupture, while FSH promotes follicle maturation to the preovulatory stage and estrogen release (23). The female reproductive system is more vulnerable to gonadotropin dysregulation than the male. We then measured serum levels of LH and FSH prepared from female PRIP-1 and -2 double knock-out (KO) mice for 5 to 6 continuous days, and found that mutant mice exhibited higher levels of both hormones in all the sera examined, thus showing a less sharp LH surge (21). Anterior lobes of the pituitary glands isolated from KO mice secreted more LH and FSH in response to a mimicking peptide of gonadotropin-releasing hormone (21). The results reminded us of our previous observation that PRIP-1 KO mice exhibited a higher level of serum insulin (24); therefore, PRIP is likely to be negatively involved in dense-core vesicle exocytosis, independent of the type of vesicular contents. The molecular mechanisms underlying the inhibition of exocytosis by PRIP are currently being studied in the laboratory; however, gonadal steroid hormones were not up-regulated in response to increased gonadotropins, but were rather lower in KO mice; the serum level of progesterone in KO mice was about half that in control mice, while estradiol appeared to be lower, albeit with no statistical significance (21). Estrogen deficiency in postmenopausal women frequently leads to osteoporosis, the most common skeletal disorder. Similarly, ovariectomy clearly produces an osteoporotic bone phenotype in mice. Osteoporotic bone loss is the result of high bone turnover in which bone resorption outpaces bone deposition.
In this study, we investigated the bone property influenced by PRIP deficiency, comparing with control mice. Three-dimensional analysis of the femurs of female mice was performed, as well as a histomorphometrical assay of bone formation parameters, including the bone formation rate, mineral apposition rate, osteoid thickness, and osteoblast number. All these results indicated that the increased bone mass seen in mutant mice is caused by enhanced bone formation. We then performed a primary culture of calvaria prepared from both genotypes, followed by analysis of osteoblast differentiation, assessed by alkaline phosphatase activity and osteoblast-related gene expression. Smad phosphorylation in response to bone morphogenetic protein (BMP) was also analyzed. These results indicated that PRIP is implicated in the regulation of bone formation in a negative manner, partly through the regulation of Smad phosphorylation.
MATERIALS AND METHODS
Animals
PRIP-1 and -2 double KO mouse strains and the corresponding wild type (WT) were generated as described previously (17). In brief, PRIP-1 KO mice and PRIP-2 KO mice back-crossed against the C57BL/6J (Charles River Laboratories Japan, Inc.) background were crossed to generate a KO mouse strain and the corresponding WT. Homozygous KO and WT mice were intercrossed to obtain the required number of mice, and only F1 and F2 generations of both genotypes were used for experiments. The handling of mice and all procedures were approved by the Animal Care Committee of Kyushu University, following the guidelines of the Japanese Council on Animal Care.
Dual X-ray Absorptiometry and Computed Tomography Analysis
Femurs were excised from each genotype of mice at the age indicated, followed by fixation with 70% ethanol for 7 days. Bone mineral density (BMD) of the femurs was measured by peripheral quantitative computed tomography (pQCT) with an XCT Research SA+ (Stratec Medizintechnik GMBH, Germany). For trabecular analysis, the femurs were analyzed by micro-computed tomography (μCT) and the three-dimensional images were constructed using 3D software, TRI/3D-BON (Ratoc System Engineering), followed by measurement of the bone volume, trabecular thickness, and number.
Histomorphometric Analysis
Femurs excised from each genotype of mice at the age indicated were fixed with 70% ethanol for 7 days, then embedded in glycolmethacrylate resin, and sectioned into 5-μm slices. For double labeling, mice were injected with calcein at a concentration of 10 mg/kg body weight twice with an interval of 72 h, and then sacrificed 40 h after the second injection (25). The sections stained by the Villanueva bone staining method were subjected to histomorphometric analyses under a light microscope with a micrometer. Parameters of the trabecular bone were measured in an area of 1.125 mm2 from 0.25 mm above the growth plate at the distal metaphysis. Five mice of each genotype were analyzed.
Measurement of Serum Markers of Bone Property
Blood was collected at 10 AM from retinal blood vessels of 2-month-old mice, and sera were prepared. Serum levels of tartrate-resistant acid phosphatase (form 5b, which is known to be bone-specific, TRAP-5b) and osteocalcin (both carboxylated and uncarboxylated) were determined as bone-resorbing and - forming markers, respectively, by respective ELISA (enzyme-linked immunosorbent assay) kits (Immunodiagnostic Systems Ltd., London UK and Biomedical Technologies Inc., Stoughton, MA), according to the manufacturer's protocol.
Ovariectomy
WT and KO mice at 2 months old were sham-operated or ovariectomized by routine surgery (26). Two months after surgery, the mice were sacrificed, and their femurs were subjected to analysis by pQCT and μCT as described above.
Cultures for Osteoblasts of Primary Cells Isolated from Calvaria and Alkaline Phosphatase Assay
Pre-osteoblasts from the calvaria of newborn mice were seeded at a density of 1.0 × 10⁴ cells/well in a 96-well plate, followed by culture in α-minimal essential medium (α-MEM) containing 10% fetal bovine serum. The cells were treated with medium containing 50 μg/ml l-ascorbic acid and 10 mm β-glycerophosphate for 7 days or left untreated but supplemented with bone morphogenetic protein 4 (BMP4) at 10 ng/ml for the final 72 h. After treatment, the cells were fixed with an acetone/ethanol mixture (50:50, v/v), followed by an alkaline phosphatase (ALP) assay by incubating with a substrate solution containing 0.1 m diethanolamine (pH 8.5), 1 mm MgCl2, and 10 mg/ml p-nitrophenyl phosphate. The reaction was terminated by adding 5 m NaOH to the final concentration of 1.67 m, and then absorbance was measured at 405 nm using a microplate reader. To determine ALP activity histochemically, cells were stained for enzyme activity as described previously (27). To examine mineralization, the cells were cultured in the presence of l-ascorbic acid and β-glycerophosphate for 21 days, followed by fixation with 4% paraformaldehyde and then staining for von Kossa (28).
Culture of Bone Marrow Cells for Tartrate-resistant Acid Phosphatase Staining and Pit Assay
Cells containing osteoclast precursors were obtained from the bone marrow of the femurs of female mice at 5–6 weeks old as described (29). In brief, bone marrow cells were cultured in α-MEM containing 10% fetal bovine serum supplemented with 10 ng/ml macrophage colony-stimulating factor (M-CSF) for 24 h. Nonadherent cells were harvested and cultured further for 3 days in the presence of 20 ng/ml M-CSF. Floating cells were removed and adherent cells were used as osteoclast precursors. To generate osteoclasts, precursors were cultured with 30 ng/ml M-CSF and 50 ng/ml receptor activator of nuclear factor kappa B ligand (RANKL) for 3 days, followed by fixation by 4% paraformaldehyde and staining for tartrate-resistant acid phosphatase (TRAP) as previously described (30). TRAP-positive multinuclear cells [TRAP(+)], containing more than three nuclei, were regarded as osteoclasts. Bone resorption assay using a dentine slice and F-actin ring staining were performed according to the method described (31).
Western Blotting
Cells, including osteoblasts and osteoclasts differentiated from each genotype, were extracted with lysis buffer (25 mm Tris-HCl at pH 7.5, 150 mm NaCl, 1% Triton X-100, and 5 mm EDTA). Cell lysates were separated by sodium dodecyl sulfate-polyacrylamide gel electrophoresis, followed by transfer to the polyvinyldifluoride membrane and immunoblotting with antibodies against PRIP-1 (1:1000) (8), PRIP-2 (1:1000) (17), β-tubulin (1:2000; Upstate). Blots were developed with horseradish peroxidase-coupled secondary antibodies and visualized using an ECL system (Amersham Biosciences). To investigate the phosphorylation of Smad by Western blotting, phosphatase inhibitors such as 10 mm NaF and 1 mm Na3VO4 were included in the lysis buffer. Anti-Smad1 and anti-phosphorylated Smad1/5/8 antibodies were obtained from Cell Signaling (Beverly, MA). Density was quantified by Image Gauge software (version 3.0; Fujifilm) and is shown as a relative value after normalizing with that of β-tubulin or β-actin in each experiment.
Quantitative Real-time PCR Analysis
For real-time PCR, total RNA was extracted by the RNeasy Mini kit (Qiagen) according to the manufacturer's instructions. After cDNA synthesis using total RNA (1 μg) with Rever Tra Ace (Toyobo), PCR amplifications were performed in 25 μl with 2 μl of obtained cDNA and 10 nm of each primer using the Platinum PCR Super Mix High Fidelity kit (TaKaRa) according to the manufacturer's protocols. Real-time PCR was performed using Brilliant II SYBR® Green QPCR Master Mix with the Mx3000 Multiplex Quantitative PCR System (Stratagene), according to the manufacturer's instructions. Samples were matched to a standard curve generated by amplifying serially diluted products under the same PCR conditions. GAPDH expression served as an internal control. Each primer was added to a final concentration of 10 μm. PCR was performed using 40 cycles of denaturing at 95 °C for 30 s, annealing at 60 °C for 60 s, and extension at 72 °C for 60 s. Primer sequences were as follows: Id1: 5′-TCCTGCAGCATGTAATCGAC-3′ (forward) and 5′-GAGAGGGTGAGGCTCTGTTG-3′ (reverse); Runt-related transcription factor 2 (Runx2): 5′-GCCGGGAATGATGATGGAGAAACTA-3′ (forward) and 5′-GGACCGTCCACTGTCACTTT-3′ (reverse); osteonectin: 5′-GCAGTGCGTGACTGGCTCAA-3′ (forward) and 5′-AAGTCTCGGGCCAACAGCTC-3′ (reverse); osteocalcin: 5′-AAGCAGGAGGGCAATAAGGT-3′ (forward) and 5′-TTTGTAGGCGGTCTTCAAGC-3′ (reverse); G3PDH: 5′-AACTTTGGCATTGTGGAAGG-3′ (forward) and 5′-ACACATTGGGGGTAGGAACA-3′ (reverse) (32). The arbitrary intensity threshold (Ct) of amplification was performed using MxPro QPCR software for Mx3000P. The fold change was calculated as 2(−ΔΔCt), where ΔCt = Cttarget gene − CtG3PDH and ΔΔCt = ΔCtsample − ΔCtcontrol. Three independent experiments were performed to estimate the values for each culture condition.
Statistical Analysis
Data are presented as the means ± S.E. (S.E.) of at least three independent experiments. Student's t-tests were used and significance is represented by * or ** for p < 0.05 or p < 0.01, respectively.
RESULTS
Bone Property in Femurs of WT and KO Mice
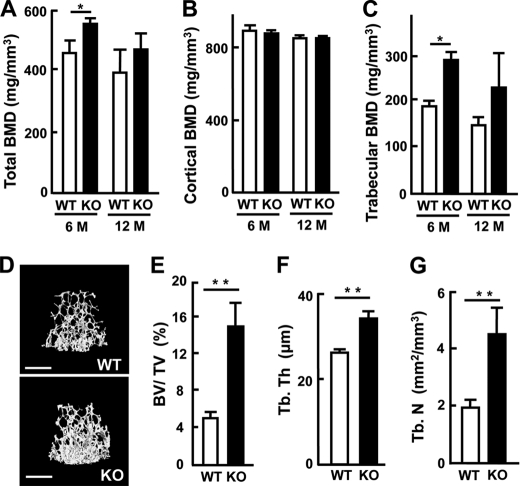
The hormonal imbalance (higher gonadotropins and lower gonadal steroids) observed with KO mice might influence the bone property. We therefore analyzed female femurs isolated from each genotype regarding bone mineral density or the trabecular bone property by pQCT or μCT. For comparison, male mice at the ages of 1 and 3 months were first analyzed; male mice of both ages exhibited little difference in bone mineral density and trabecular bones between the genotypes. We then analyzed younger male mice at 2-weeks old, which exhibited higher bone mineral density by about 30% of the control (results not shown). In contrast, females at the ages of 1, 2, 4, and 6 months clearly showed higher bone mineral density or more enriched trabecules in KO mice, but those at 12 months showed a slight increase with no statistical significance. As an example, bone mineral density at the metaphysis of femurs isolated from each genotype of females at the ages of 6 and 12 months is shown in Fig. 1, A–C; the parameters of total bone and trabecular bone were higher in KO mice at both ages, but statistical significance was only seen in mice at 6 months, while cortical bone was not different. To examine the trabecular bone of femurs in detail, μCT images of distal femurs were reconstructed, followed by quantitative analysis. As the images shown in Fig. 1D indicate, all the parameters examined, such as trabecular bone volume, trabecular thickness and the number of trabeculae, were more increased in KO mice at the age of 6 months (Fig. 1, E–G). These results clearly indicate that female KO mice exhibited higher bone mass, particularly in the trabeculae. Results obtained at other ages will be described later, except for those at 1 month old.
FIGURE 1.
Bone analysis of the femurs prepared from WT and KO mice. A–C, pQCT data of bone mineral density of the female femur at the age of 6 and 12 months. A, total bone mineral density (total BMD, mg/mm3). B, cortical bone mineral density (cortical BMD, mg/mm3). C, trabecular bone mineral density (trabecular BMD, mg/mm3). D–G, μCT data of trabeculae in the femur. D, three-dimensional image of the femur trabeculae at the age of 6 months. Bars, 0.9 mm. E, trabecular bone volume/total volume (BV/TV, %). F, trabecular thickness (Tb.Th, μm). G, trabecular number (Tb.N, mm2/mm3). Results are the means ± S.E. of three mice. * or ** for p < 0.05 or p < 0.01 compared with WT, respectively.
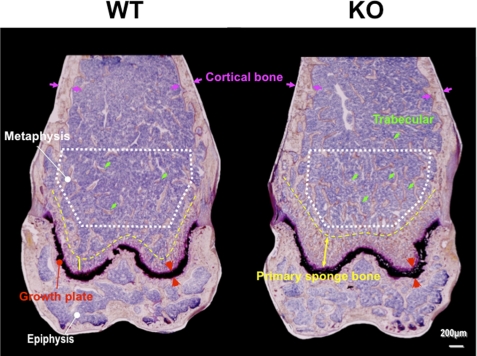
Histological analysis of the femurs at the age of 2 months after Villanueva bone staining is shown in Fig. 2. The wider primary sponge bone area was followed by a secondary sponge bone area where much more trabecular bone was seen in KO mice than in WT mice, and the growth plates were wider. The higher magnification clearly showed apparently more osteoblasts side-by-side on the bone surface than observed in WT bone (picture not shown).
FIGURE 2.
Villanueva bone staining of female femurs at the age of 2 months. Epiphysis, growth plate, metaphysis, cortical bone, trabecular bone, and primary sponge bone area are shown. Typical images are shown, and the two others obtained from different mice show similar images.
Histomorphometrical Analysis of Trabecular Bone of Femurs from WT and KO Mice
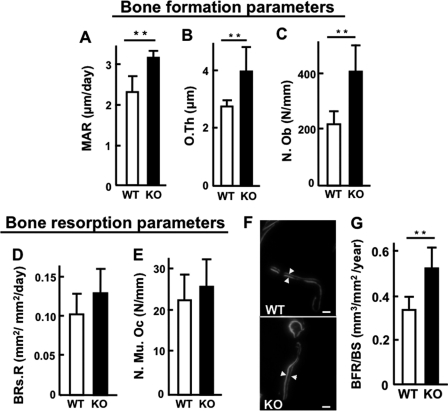
We next performed histomorphometric analysis of the femurs prepared from each genotype at the age of 2 months. Bone formation parameters, including the mineral apposition rate, osteoid thickness and osteoblast number were all up-regulated in KO mice (Fig. 3, A–C). On the other hand, bone resorption parameters, including the bone resorption rate and osteoclast number, showed no statistical significance between genotypes (Fig. 3, D and E), indicating that KO mice showed increased bone turnover, and that bone formation appeared to outpace resorption; therefore, we further performed calcein double-labeling experiments for bone formation rates. Mice of each genotype were injected with calcein twice at an interval of 72 h, and the results visually showed enhanced bone formation in KO mice (Fig. 3F). As such, the bone formation rate to bone surface (BFR/BS) was significantly higher in KO mice than in WT mice (Fig. 3G). These results clearly showed that the deficiency of PRIP in bone cells accelerates bone formation.
FIGURE 3.
Histomorphometrical analysis in trabecular bone of femurs from WT and KO mice. A–C, bone formation parameters. A: mineral apposition rate (MAR, μm/day). B, osteoid thickness (O.Th, μm). C, osteoblast number (N.Ob, N/mm). D and E, bone resorption parameters. D, bone resorption rate (BRs.R, mm2/mm2/day). E, multi-nuclear osteoclast number (N.Mu.OC, N/mm). F, calcein double-labeling image. Bars, 15 μm. G, bone formation rate/bone surface (BFR/BS, mm3/mm2/year). Results are the mean ± S.E. of 5 mice. ** for p < 0.01 compared with WT.
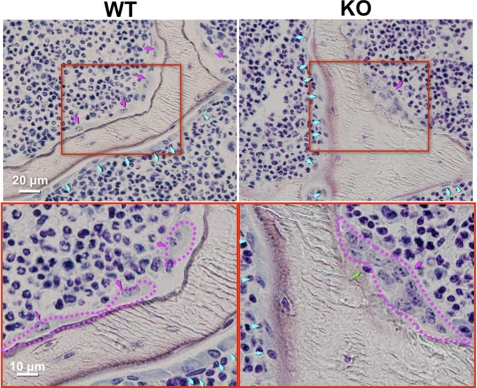
Villanueva bone staining of the trabecular bone surface absorbed by osteoclasts showed abnormal features of osteoclasts in KO mice at the age of 2 months. As shown in Fig. 4, larger osteoclasts containing more than 15 nuclei, which were not seen in the control, were seen, but the absorbing surfaces were less stained brown-black in KO mice, indicating that bone absorption was not so active that it was difficult for the staining solution to penetrate the bone for staining. Furthermore, the junction between the bone surface and osteoclasts appeared to be less tight, and a live single-nucleated small cell was seen between them. These results indicate that osteoclasts formed in KO mice appeared less active.
FIGURE 4.
Villanueva bone staining of trabeculae from mice at the age of 2 months. Osteoblasts and osteoclasts are indicated by blue and red arrows, respectively, in the upper images. Red rectangles were enlarged twice into the bottom images, where osteoclast edges are traced by red broken lines. A single-nucleated cell (indicated by a green arrow) is present between the osteoclast and the bone-absorbing surface. Two others from different mice show similar images.
Measurements of serum levels of TRAP-5b and osteocalcin, as markers for bone-resorping and -forming activity in the whole body, respectively, support these observations; values of TRAP-5b (units/liter) were 21.8 ± 1.8 and 11.5 ± 2.1 (mean ± S.E. of five mice, p < 0.006) and those of osteocalcin (ng/ml) were 14.0 ± 1.1 and 19.9 ± 1.5 (mean ± S.E. of five mice, p < 0.031) for WT and KO mice, respectively.
Involvement of PRIP Itself in the Regulation of Bone Property
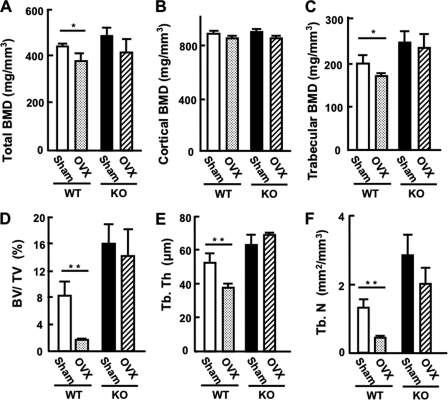
We first assumed that KO mice would exhibit bone loss because of lower gonadal steroids; however, as described above, the results were opposite, indicating that PRIP itself influences the bone property, independent of gonadal hormones. To examine further, ovariectomy (OVX) was performed in 2-month-old female mice, and 2 months later the bone property of the femurs was analyzed by pQCT (Fig. 5, A–C) and μCT (Fig. 5, D–F), as described for Fig. 1. KO mice at the age of 4 months showed higher bone mineral density and enriched trabecular bones than WT mice. As expected, OVX in WT mice resulted in decreased total and trabecular bone mineral density, but not cortical bone mineral density (Fig. 5, A–C). On the other hand, a statistically significant decrease was not observed in KO mice, as in three-dimensional analysis by μCT (Fig. 5, D–F). OVX in KO mice did not have a great impact on the bone property, probably because gonadal steroids secreted from ovaries of KO mice were lower at origin (21). The results indicate that the increased bone mass seen in KO mice was independent of hormonal imbalance in the HPG axis, suggesting that PRIP itself is implicated in the regulation of bone property.
FIGURE 5.
Bone analysis of the femurs after OVX. A-C, pQCT data of BMD of sham and ovariectomized mouse femurs. A, total BMD. B, cortical BMD. C, trabecular BMD. D–F, μCT measurement of the femur trabeculae. D, BV/TV. E, Tb.Th. F, Tb.N. Results are represented as the mean ± S.E. of 4 or 5 analysis for WT or KO mice, respectively. * or ** for p < 0.05 or p < 0.01 compared with the sham operation, respectively.
If this is confirmed, PRIP must be present in cells related to the regulation of bone property. We previously observed the presence of PRIP-1 in osteoclasts by in situ hybridization experiments (5). We here confirmed the presence of PRIP-1 and -2 in osteoclasts differentiated from WT bone marrow cells by cultivation in the presence of RANKL and M-CSF by immunoblotting (Fig. 6). Furthermore, cultures of primary cells isolated from calvaria prepared from new-born mice in the presence of l-ascorbic acid and β-glycerophosphate for 7 days, the condition for the induction of osteoblasts, were immunoblotted with antibodies for PRIP-1 and -2. The presence of both PRIP-1 and -2 in osteoblast-like cells of only WT mice was confirmed (Fig. 6), indicating the possible implication of PRIP in bone cell functions.
FIGURE 6.
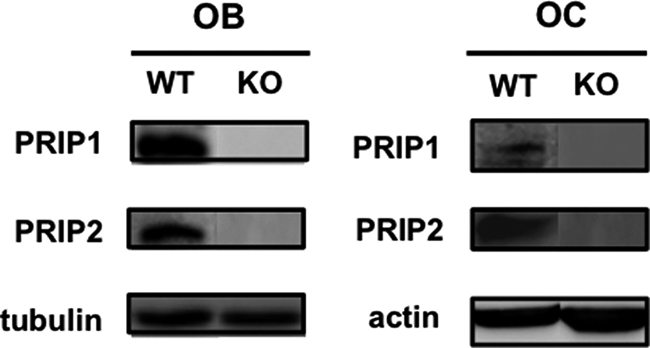
Presence of PRIP-1 and -2 in bone-related cells in WT mice. Cells prepared from calvaria of new-born mice were cultured for 7 days in the presence of 50 μg/ml l-ascorbic acid and 10 mm β-glycerophosphate for osteoblast-like cells (designated as OB). Cells prepared from bone marrow were cultured for 4 days in the presence of M-CSF (30 ng/ml) and RANKL (50 ng/ml) for osteoclast-like cells (designated as OS). Cell extracts (20 μg of protein) were applied to each lane, followed by separation by sodium dodecyl sulfate-polyacrylamide gel electrophoresis and immunoblotting with anti-PRIP-1 and -2 antibodies. Typical blots of four experiments using different mice were shown.
In Vitro Cell Differentiation
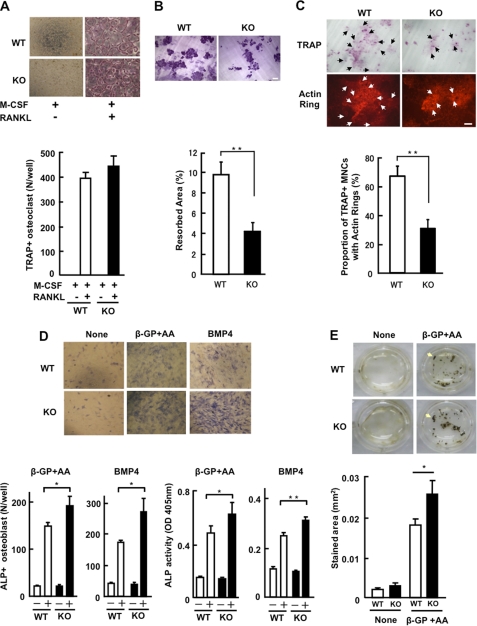
Bone marrow cells derived from the femurs were cultured to differentiate into osteoclast-like cells for 3 days in medium supplemented with 30 ng/ml M-CSF and 50 ng/ml RANKL, followed by TRAP staining for multi-nucleated osteoclast-like cells. As shown in Fig. 7A, cultures of bone-marrow cells yielded TRAP-positive multi-nucleated cells only in the presence of both ligands, and the number and appearance at low magnification of differentiated cells were not significantly different between the genotypes of mice. Experiments using different concentrations of RANKL (10, 30, and 100 ng/ml) were also performed with little change in the number of TRAP-positive multi-nucleated cells between the genotypes, in which a clear dose-dependent increase of the differentiated cells was observed (results not shown). However, bone resorption by differentiated cells from KO mice appeared less active, as assayed by pit formation using a dentine slice shown in Fig. 7B. The formation of ringed structures of F-actin dots (actin rings) in osteoclasts is closely related to bone-resorbing activity (33). Cells with either complete or well-defined, even partly, actin rings were observed in the cultures of bone marrow cells from control mice, whereas ring formation in the cultures of mutant mice was reduced compared with the control (Fig. 7C). These in vitro results were consistent with the in vivo observation of a lower serum level of TRAP-5b.
FIGURE 7.
In vitro cell differentiation. A, bone marrow cell culture in the presence of M-CSF (30 ng/ml) and RANKL (50 ng/ml). Upper panel: TARP staining for osteoclasts. Typical images of five experiments using different mice are shown. + indicates the addition of the ligand. Lower panel: number of TRAP-positive cells. Red-stained and >3 nucleated cells were counted as osteoclast-like cells. Results are the mean ± S.E. of five mice performed in triplicate. B, osteoclast preparations were seeded onto dentin slices (ϕ 4 mm) placed in 96-well plates. After incubation for 2 h, dentin slices were transferred to 48-well plates (one slice/well) for 48 h. Resorption pits formed on dentin slices were stained with Mayer's hematoxylin (upper panel). Bar, 100 μm. Lower panel shows the percentages of resorption areas. C, cultures on dentine slices were also stained for TRAP and F-actin (upper panel). Bar, 100 μm. Lower panel: the ratio of TRAP-positive cells with actin rings was scored (mean ± S.E.). Similar results were obtained in four mice performed in triplicate. D and E, cells isolated from calvarias of new-born mice were cultured in the presence of either l-ascorbic acid (50 μg/ml) and β-glycerophosphate (10 mm) or BMP4 (10 ng/ml). D, images of ALP staining (upper panel). Lower panels show number of ALP-positive cells (left) and activity of ALP using p-nitrophenol phosphate as a substrate (right). Results are the mean ± S.E. of 5 mice performed in triplicate. E, von Kossa staining of calvaria cultures in the presence of l-ascorbic acid and β-glycerophosphate for 21 days. Image of von Kossa staining (upper panel); stained areas were measured (lower panel). Results are the mean ± S.E. of three mice performed in triplicate. * or ** for p < 0.05 or p < 0.01 compared with WT, respectively.
Cultures of primary cells isolated from calvaria in the presence of either l-ascorbic acid plus β-glycerophosphate or BMP4 were performed for osteoblast differentiation. ALP activity, a typical marker of osteoblast differentiation, in primary cultures of calvaria prepared from WT and KO mice was first assayed. As shown in Fig. 7D, the number of ALP-positive cells was significantly increased in the culture of mutant cells under both conditions, and the activity of the enzyme was higher (Fig. 7D). In the mineralization assay of cultures with ascorbic acid and β-glycerophosphate, the cells underwent von Kossa staining, with results clearly showing enhanced mineralization in the culture of mutant cells (Fig. 7E). These results indicate that PRIP is implicated in osteoblastogenesis in a negative manner, and therefore PRIP deficiency generates more osteoblasts in response to stimulation to yield more bone formation.
Colony-forming unit fibroblast (CFU-F) assays using bone marrow mononuclear cells isolated from 1.5–2-month-old WT and KO mice were performed. Cultures stained for ALP to discriminate colonies originating from osteoblasts did not show a difference between genotypes (36.0 ± 7.6% and 36.9 ± 8.5% for WT and KO mice, respectively; mean ± S.E. of four independent experiments performed in triplicate). The values were much the same as described previously (34).
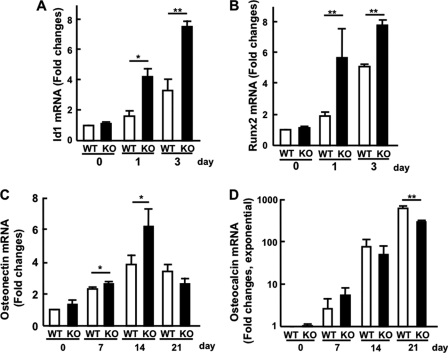
We next examined the expression, by real-time PCR, of the transcription factor induced by BMP4 and osteoblast differentiation marker genes induced by l-ascorbic acid and β-glycerophosphate using cultures of primary cells isolated calvaria from WT and KO mice. Id1 is known to be a BMP-responsive gene (35) and indeed Id1 mRNA was up-regulated in response to BMP4 stimulation, and the enhancement was more evident in cultures from mutant mice (Fig. 8A), indicating up-regulation of the BMP signaling pathway. Expression of Runx2 mRNA, known to be responsive to BMP signaling (36, 37), was then assayed; the increase by BMP4 was markedly observed at days 1 and 3 in cultures from mutant mice, while cultures from control mice exhibited smaller increases (Fig. 8B).
FIGURE 8.
Gene expression in cultures of primary cells isolated from calvaria as assessed by real-time RT-PCR. A (Id1) and B (Runx2): culture in the presence of BMP4 for 1 or 3 days. C (osteonectin) and D (osteocalcin): culture in the presence of l-ascorbic acid and β-glycerophosphate for 7, 14, and 21 days. Gene expression was normalized to that of GAPDH. Results are the mean ± S.E. of three mice performed in triplicate. * or ** for p < 0.05 or p < 0.01 compared with WT, respectively. Note that the ordinate in D is exponential.
Upon differentiation into osteoblasts, the cells expressed proteins related to their stage of differentiation, such as ALP, type I collagen, osteonectin, and osteocalcin (38). We here measured the mRNA levels of osteonectin and osteocalcin, both of which are known to be genes relating to the mature stage of osteoblasts, using calvaria in the presence of l-ascorbic acid and β-glycerophosphate. As shown in Fig. 8C, the cultures from mutant mice exhibited an increase of osteonectin mRNA more than the control at days 7 and 14, but both had decreased at day 21. Osteocalcin mRNA was expressed markedly depending on the culture days in both cultures, but the cultures from control mice were slightly more increased on day 21 (Fig. 8D). We currently have no reasonable explanation for this.
Phosphorylation of Smad1/5/8 in Response to BMP4
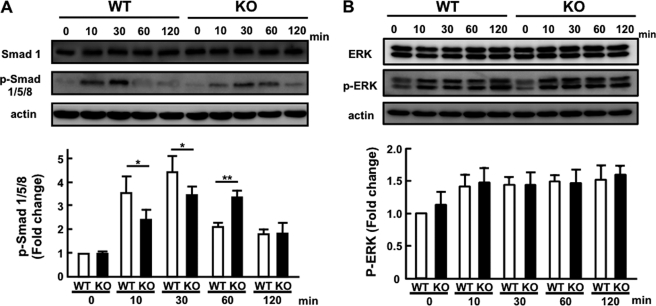
Phosphorylation of Smad1/5/8 is the first key step to initiate signaling cascades following the binding of BMP to receptors (39, 40). As shown in Fig. 9, phosphorylation of Smad1/5/8 was observed at 10 min, reaching the maximum within 30 min, and then declining toward the basal level at 120 min in response to stimulation with BMP4. On the other hand, cultures of calvaria cells isolated from KO mice exhibited persistent phosphorylation, albeit with a lower level of phosphorylation, but still higher than before stimulation. Quantitative RT-PCR assays for mRNA for co-Smad4 and inhibitory Smad6 and -7 were not different between genotypes (data not shown). Phosphorylation of ERK was also triggered by the activation of BMP receptors, but the phosphorylation was similarly observed with both genotypes (Fig. 9B), indicating that PRIP deficiency is implicated in the event specific to phosphorylation of Smad after BMP stimulation.
FIGURE 9.
Phosphorylation of Smad1/5/8 in response to BMP4 stimulation. Primary cells isolated from calvaria were cultured in the presence of BMP4 (10 ng/ml) for 10, 30, 60, and 120 min. Cell lysates were separated by sodium dodecyl sulfate-electrophoresis, followed by Western blotting for the expression of Smad1, phosphorylated Smad1/5/8 (p-Smad 1/5/8) for A, and ERK and phosphorylated ERK for B, and β-actin. A typical blot is shown at the top. Density of phosphorylated Smad1/5/8 or phosphorylated ERK (lower band) relative to that of Smad1 and ERK, respectively, is depicted in the lower graph. Data are the mean ± S.E. of four mice. * or ** for p < 0.05 or p < 0.01 compared with WT, respectively.
DISCUSSION
The current study was initiated by the observation of higher gonadotropins but lower gonadal steroid hormones in our female KO mice (21). On the basis of the consensus that gonadal steroid hormone deficiency causes bone loss due to the failure of osteoclast apoptosis (41), it was initially assumed that female KO mice would exhibit a similar phenotype regarding the bone property to those described. In contrast to this assumption, however, female KO mice at the ages of 1, 2, 4, and 6 months exhibited increased bone mass, while those at 12 months showed a slight increase, albeit with no statistical significance. Senescence leads to slower bone turnover, probably caused by systemic down-regulation, including the reduction of osteogenic potential in bone marrow and vitamin D metabolism (42), which would be a possible explanation for the no statistical difference observed in mice at 12 months old. On the other hand, male mice at the ages of 1 and 3 months, but not of 2 weeks, showed little difference in bone mineral density as assessed by pQCT or μCT; this observation could be explained by the notion that testosterone promotes bone formation, probably hiding the impact of PRIP deficiency.
The bone phenotype was similarly observed in KO mice after OVX treatment, indicating that this was caused by the direct effect of PRIP itself present in bone-relating cells, rather than the dependence on gonadal steroid hormones. OVX treatment caused trabecular bone loss in control mice as expected, while KO mice did not show a significant loss. This was attributed both to bone formation outpacing than resorption at origin in KO mice and lower gonadal steroid hormones at origin in KO mice, thus having a smaller impact. In addition, osteoclasts observed in mutant mice appeared to be less active when assessed by Villanueva bone staining. Furthermore, larger osteoclasts with many nuclei were seen, showing less activity because of a single nucleated small cell between the osteoclasts and the bone surface, which would be an unfavorable location for cells if osteoclasts were properly active. This is supported by the observation of lower serum levels of TRAP-5b as a marker of bone-resorbing activity in the whole body of KO mice, and of smaller pit formation on a dentine slice using in vitro differentiated osteoclasts from bone marrow cells of KO mice. Our KO mice exhibited up-regulation of secretory processes with multiple contents, including insulin (24), gonadotropins (21), and neurotransmitters,5 which led us to assume that PRIP plays a negative role in the membrane fusion process, probably by acting at SNARE complex formation, a common minimal mechanism for membrane fusion. Thus, PRIP deficiency might promote cell-cell fusion to yield larger, multi-nucleated osteoclasts during maturation, but this does not directly indicate lower activity for bone resorption. The attachment of the osteoclast membrane to the underlying bone surface (sealing zone) appears to be loose in KO mice, which would be a possible explanation for the lower activity of bone resorption. Thus, mutant mice showed lower serum TRAP-5b and the presence of live cells between the spaces in vivo, and smaller pit formation on a dentine slice by in vitro differentiated osteoclasts. Sealing zones are bounded by belts of podosomes, the highly dynamic actin-rich structures that mediate osteoclast attachment. It is now well accepted that αvβ3 integrin is a major adhesive protein responsible for attachment to the bone matrix; following the binding of αvβ3 integrin to bone matrix proteins, downstream molecules including c-Src, Pyk2 (protein tyrosine kinase 2) and others are auto-phosphorylated at tyrosine residues to regulate actin ring assembly and disassembly to form sealing zone (43). PLCγ2 are also recruited to yield inositol 1,4,5-trisphosphate, thus causing Ca2+ increase to trigger Pyk2 activation (44). We reported that PRIP deficiency caused the impairment of inositol 1,4,5-trisphosphate-mediated Ca2+ signaling (16), and the diminishment of tyrosine phosphorylation of the receptors in response to insulin or epidermal growth factor by PRIP deficiency was recently found6; therefore, PRIP deficiency might have caused the down-regulation of the molecule functioning downstream of αvβ3 integrin, resulting in a loose sealing zone.
Very recently, it was reported that insulin stimulates bone formation by enhancing the expression of Runx2 via twist2 (45). As reported previously (24), PRIP-KO mice exhibit hyperinsulinemia under both fed and fasting conditions, indicating that this is the primary cause of the enhanced bone formation observed in KO mice. However, in vitro osteoblastogenesis experiments clearly showed enhancement in cultures derived from KO mice, suggesting that PRIP, itself present in precursor cells, causes a difference, although not excluding the possible involvement of insulin in the up-regulation of bone formation in the whole body of KO mice.
Little difference between genotypes in the CFU-F assay probably indicates that the competence of differentiation into osteoblasts is almost identical, but osteoblastogenesis in response to stimulation (ascorbic acid plus β-glycerophosphate and BMP4) causes a difference, indicating that the enhancement of signaling events participated in osteoblastogenesis.
BMP signaling first triggers the phosphorylation of Smads to proceed further for bone formation (39, 40). Because there was no quantitative difference between genotypes in Smad1 assessed by Western blotting, co-Smad4 and inhibitory Smads assessed by RT-PCR, the level of phosphorylation might vary. In fact, the phosphorylation of Smad1/5/8 was different; that in cultures of primary cells of isolated calvaria from the mutant mice increased slower, but lasted longer, indicating that activities of kinase or phosphatase are modified by PRIP deficiency. The phosphorylation of ERK, also triggered by BMP stimulation, was similarly observed between cultures from each genotype during the period examined, indicating that the impact of PRIP deficiency is at the site specific to the phosphorylation of Smad after stimulation with BMP receptors. The signal transduction cascade initiated by BMP ligand starts with activation of a heteromeric receptor complex consisting of two transmembrane serine/threonine kinases: the type I and type II receptors. Type II receptor recruits type I receptor to activate by phosphorylation in response to BMP binding. Activated type I receptor then phosphorylates the signal transducers Smad1/5/8. Phosphorylated Smad1/5/8 form heteromeric complexes with co-Smad4 and translocate into the nucleus, where they are involved in transcriptional regulation of target genes (46). It has recently been reported that PP1 and/or PP2A regulate BMP signaling by interacting with BMP receptors, thus resulting in the dephosphorylation of Smad1 (47, 48). We previously reported that PRIP directly binds PP1 to inactivate, and the phosphorylation of PRIP itself causes dissociation of PP1 for activation (9). Our studies further revealed that PRIP also binds PP2A as well as the β subunit of GABAA receptor and thus is actively involved in the phospho-modulation of GABAA receptor trafficking and function (10–12). Therefore, it is possible that PRIP is involved in the phospho-regulation of BMP signaling pathways, including that of stimulatory Smad1/5/8; however, to do so, PRIP must come closer to molecules implicated in BMP signaling by interacting either directly or indirectly. Further studies are apparently required to clarify the involvement of PRIP in the phospho-regulation of molecules, including Smad, implicated in BMP signaling.
In conclusion, this study introduced PRIP as a novel molecule in bone biology research. Because mutant mice have a similar body length to WT, PRIP might be involved in bone homeostasis, but not in bone development. PRIP appears to be implicated in bone formation in a negative manner, probably through pathways independent of hormone levels. Further studies on how PRIP plays a role in the regulation of bone formation could elucidate an unknown area of the bone formation mechanism.
This work was supported by a grant-in-aid for scientific research from the Ministry of Education, Culture, Science, Sports, and Technology of Japan (to K. T., M. M., A. M., and M. H.), and by Kyushu University P&P program (to M. M.).
M. Hirata, unpublished observation.
A. Mizokami, H. Takeuchi, J. Gao, and M. Hirata, unpublished observation.
- PRIP
- phospholipase C-related but catalytically inactive protein
- ALP
- alkaline phosphatase
- α-MEM
- α minimal essential medium
- BMP
- bone morphogenetic protein
- FSH
- follicle-stimulating hormone
- HPG axis
- hypothalamus-pituitary-gonadal axis
- KO
- PRIP1 and 2 double knockout
- LH
- luteinizing hormone
- M-CSF
- macrophage colony-stimulating factor
- μCT
- micro-computed tomography
- OVX
- overiectomy
- pQCT
- quantitative computed tomography
- RANKL
- receptor activator of nuclear factor κB ligand
- TRAP
- tartrate-resistant acid phosphatase.
REFERENCES
- 1. Kanematsu T., Takeya H., Watanabe Y., Ozaki S., Yoshida M., Koga T., Iwanaga S., Hirata M. (1992) J. Biol. Chem. 267, 6518–6525 [PubMed] [Google Scholar]
- 2. Kanematsu T., Misumi Y., Watanabe Y., Ozaki S., Koga T., Iwanaga S., Ikehara Y., Hirata M. (1996) Biochem. J. 313, 319–325 [DOI] [PMC free article] [PubMed] [Google Scholar]
- 3. Kanematsu T., Yoshimura K., Hidaka K., Takeuchi H., Katan M., Hirata M. (2000) Eur J Biochem. 267, 2731–2737 [DOI] [PubMed] [Google Scholar]
- 4. Yoshida M., Kanematsu T., Watanabe Y., Koga T., Ozaki S., Iwanaga S., Hirata M. (1994) J Biochem. 115, 973–980 [DOI] [PubMed] [Google Scholar]
- 5. Matsuda M., Kanematsu T., Takeuchi H., Kukita T., Hirata M. (1998) Neurosci Lett 257, 97–100 [DOI] [PubMed] [Google Scholar]
- 6. Kikuno R., Nagase T., Ishikawa K., Hirosawa M., Miyajima N., Tanaka A., Kotani H., Nomura N., Ohara O. (1999) DNA Res 6, 197–205 [DOI] [PubMed] [Google Scholar]
- 7. Otsuki M., Fukami K., Kohno T., Yokota J., Takenawa T. (1999) Biochem. Biophys. Res. Commun. 266, 97–103 [DOI] [PubMed] [Google Scholar]
- 8. Kanematsu T., Jang I. S., Yamaguchi T., Nagahama H., Yoshimura K., Hidaka K., Matsuda M., Takeuchi H., Misumi Y., Nakayama K., Yamamoto T., Akaike N., Hirata M., Nakayama K. (2002) EMBO J. 21, 1004–1011 [DOI] [PMC free article] [PubMed] [Google Scholar]
- 9. Yoshimura K., Takeuchi H., Sato O., Hidaka K., Doira N., Terunuma M., Harada K., Ogawa Y., Ito Y., Kanematsu T., Hirata M. (2001) J. Biol. Chem. 276, 17908–17913 [DOI] [PubMed] [Google Scholar]
- 10. Terunuma M., Jang I. S., Ha S. H., Kittler J. T., Kanematsu T., Jovanovic J. N., Nakayama K. I., Akaike N., Ryu S. H., Moss S. J., Hirata M. (2004) J. Neurosci. 24, 7074–7084 [DOI] [PMC free article] [PubMed] [Google Scholar]
- 11. Yanagihori S., Terunuma M., Koyano K., Kanematsu T., Ho, Ryu S., Hirata M. (2006) Adv. Enzyme Regul. 46, 203–222 [DOI] [PubMed] [Google Scholar]
- 12. Kanematsu T., Yasunaga A., Mizoguchi Y., Kuratani A., Kittler J. T., Jovanovic J. N., Takenaka K., Nakayama K. I., Fukami K., Takenawa T., Moss S. J., Nebekura J., Hirata M. (2006) J. Biol. Chem. 281, 22180–22189 [DOI] [PubMed] [Google Scholar]
- 13. Kanematsu T., Fujii M., Mizokami A., Kittler J. T., Nabekura J., Moss J. S., Hirata M. (2007) J Neurochem 101, 898–905 [DOI] [PubMed] [Google Scholar]
- 14. Uji A., Matsuda M., Kukita T., Maeda K., Kanematsu T., Hirata M. (2002) Life Sci 72, 443–453 [DOI] [PubMed] [Google Scholar]
- 15. Takeuchi H., Oike M., Paterson H. F., Allen V., Kanematsu T., Ito Y., Erneux C., Katan M., Hirata M. (2000) Biochem. J. 349, 357–368 [DOI] [PMC free article] [PubMed] [Google Scholar]
- 16. Harada K., Takeuchi H., Oike M., Matsuda M., Kanematsu T., Yagisawa H., Nakayama K. I., Maeda K., Erneux C., Hirata M. (2005) J. Cell. Physiol. 202, 422–433 [DOI] [PubMed] [Google Scholar]
- 17. Mizokami A., Kanematsu T., Ishibashi H., Yamaguchi T., Tanida I., Takenaka K., Nakayama K. I., Fukami K., Takenawa T., Kominami E., Moss S. J., Yamamoto T., Nabekura J., Hirata M. (2007) J Neurosci 27, 1692–1701 [DOI] [PMC free article] [PubMed] [Google Scholar]
- 18. Fujii M., Kanematsu T., Ishibashi H., Fukami K., Takenawa T., Nakayama K. I., Moss S. J., Nabekura J., Hirata M. (2010) J. Biol. Chem. 285, 4837–4846 [DOI] [PMC free article] [PubMed] [Google Scholar]
- 19. Mizokami A., Tanaka H., Ishibashi H., Umebayashi H., Fukami K., Takenawa T., Nakayama K. I., Yokoyama T., Nabekura J., Kanematsu T., Hirata M. (2010) J Neurochem 114, 302–310 [DOI] [PubMed] [Google Scholar]
- 20. Kanematsu T., Takeuchi H., Terunuma M., Hirata M. (2005) Mol. Cells 20, 305–314 [PubMed] [Google Scholar]
- 21. Matsuda M., Tsutsumi K., Kanematsu T., Fukami K., Terada Y., Takenawa T., Nakayama K. I., Hirata M. (2009) Biol. Reprod. 81, 681–689 [DOI] [PubMed] [Google Scholar]
- 22. Schneider J. E. (2004) Physiol. Behav. 81, 289–317 [DOI] [PubMed] [Google Scholar]
- 23. Richards J. S. (2001) Endocrinology 142, 2184–2193 [DOI] [PubMed] [Google Scholar]
- 24. Doira N., Kanematsu T., Matsuda M., Takeuchi H., Nakano H., Ito Y., Nakayama K., Nakayama K. I., Hirata M. (2001) Biomed Res. 22, 157–165 [Google Scholar]
- 25. Monfoulet. L., Rabier B., Chassande O., Fricain J. C. (2010) Calcif. Tissue Int. 86, 72–81 [DOI] [PubMed] [Google Scholar]
- 26. Yamane H., Sakai A., Mori T., Tanaka S., Moridera K., Nakamura T. (2009) Bone 44, 1055–1062 [DOI] [PubMed] [Google Scholar]
- 27. Yamazaki M., Fukushima H., Shin M., Katagiri T., Doi T., Takahashi T., Jimi E. (2009) J. Biol. Chem. 284, 35987–35995 [DOI] [PMC free article] [PubMed] [Google Scholar]
- 28. Lutter A. H., Hempel U., Wolf-Brandstetter C., Garbe A. I., Goettsch C., Hofbauer L. C, Jessberger R., Dieter P. (2010) J. Cell. Biochem. 109, 1025–1032 [DOI] [PubMed] [Google Scholar]
- 29. Lee J., Kim K., Kim J. H., Jin H. M., Choi H. K., Lee S. H., Kook H., Kim K. K., Yokota Y., Lee S. Y., Choi Y., Kim N. (2006) Blood 107, 2686–2693 [DOI] [PMC free article] [PubMed] [Google Scholar]
- 30. So H., Rho J., Jeong D., Park R., Fisher D. E., Ostrowski M. C., Choi Y., Kim N. (2003) J. Biol. Chem. 278, 24209–24216 [DOI] [PubMed] [Google Scholar]
- 31. Hashiguchi D., Fukushima H., Yasuda H., Masuda W., Tomikawa M., Morikawa K., Maki K., Jimi E. (2011) J. Dent. Res. 90, 912–917 [DOI] [PubMed] [Google Scholar]
- 32. Hirata S., Kitamura C., Fukushima H., Nakamichi I., Abiko Y., Terashita M., Jimi E. (2010) J. Cell. Biochem. 111, 1445–1452 [DOI] [PubMed] [Google Scholar]
- 33. Suda T., Takahashi N., Udagawa N., Jimi E., Gillespie M. T., Martin T. J. (1999) Endocr. Rev. 20, 345–357 [DOI] [PubMed] [Google Scholar]
- 34. Isogai Y., Akatsu T., Ishizuya T., Yamaguchi A., Hori M., Takahashi N., Suda T. (1996) J. Bone Miner. Res. 11, 1384–1393 [DOI] [PubMed] [Google Scholar]
- 35. Katagiri T., Yamaguchi A., Komaki M., Abe E., Takahashi N., Ikeda T., Rosen V., Wozney J. M., Fujisawa-Sehara A., Suda T. (1994) J. Cell Biol. 127, 1755–1766 [DOI] [PMC free article] [PubMed] [Google Scholar]
- 36. Lee K. S., Kim H. J., Li Q. L., Chi X. Z., Ueta C., Komori T., Wozney J. M., Kim E. G., Choi J. Y., Ryoo H. M., Bae S. C. (2000) Mol. Cell. Biol. 20, 8783–8792 [DOI] [PMC free article] [PubMed] [Google Scholar]
- 37. Nakashima K., Zhou X., Kunkel G., Zhang Z., Deng J. M., Behringer R. R., de Crombrugghe B. (2002) Cell 108, 17–29 [DOI] [PubMed] [Google Scholar]
- 38. Aubin J. E. (2001) Rev. Endocr. Metab. Disord. 2, 81–94 [DOI] [PubMed] [Google Scholar]
- 39. Massagué J., Seoane J., Wotton D. (2005) Genes Dev. 19, 2783–2810 [DOI] [PubMed] [Google Scholar]
- 40. Katagiri T., Fukuda T., Nojima J., Kanomata K., Nakamura A. (2008) Clin Calcium 18, 194–201 [PubMed] [Google Scholar]
- 41. Nakamura T., Imai Y., Matsumoto T., Sato S., Takeuchi K., Igarashi K., Harada Y., Azuma Y., Krust A., Yamamoto Y., Nishina H., Takeda S., Takayanagi H., Metzger D., Kanno J., Takaoka K., Martin T. J., Chambon P., Kato S. (2007) Cell 130, 811–823 [DOI] [PubMed] [Google Scholar]
- 42. Passeri G., Vescovini R., Sansoni P., Galli C., Franceschi C., Passeri M. (2008) Exp. Gerontol. 43, 79–87 [DOI] [PubMed] [Google Scholar]
- 43. Novack D. V., Faccio R. (2011) Ageing Res. Rev. 10, 54–61 [DOI] [PMC free article] [PubMed] [Google Scholar]
- 44. Sanjay A., Houghton A., Neff L., DiDomenico E., Bardelay C., Antonie E., Levy J., Gailit J., Bowtell D., Horne W. C., Baron R. (2001) J. Cell Biol. 152, 181–195 [DOI] [PMC free article] [PubMed] [Google Scholar]
- 45. Fulzele K., Riddle R. C., DiGirolamo D. J., Cao X., Wan C., Chen D., Faugere M. C., Aja S., Hussain M. A., Brüning J. C., Clemens T. L. (2010) Cell 142, 309–319 [DOI] [PMC free article] [PubMed] [Google Scholar]
- 46. Derynck R., Zang Y., Feng X. H. (1998) Cell 95, 737–740 [DOI] [PubMed] [Google Scholar]
- 47. Zhang F., Qiu T., Wu X., Wan C., Shi W., Wang Y., Chen J. G., Wan M., Clemens T. L., Cao X. (2009) J. Bone Miner. Res. 24, 1224–1233 [DOI] [PMC free article] [PubMed] [Google Scholar]
- 48. Bengtsson L., Schwappacher R., Roth M., Boergermann J. H., Hassel S., Knaus P. (2009) J. Cell Sci. 122, 1248–1257 [DOI] [PubMed] [Google Scholar]


