Abstract
In turbid media such as biological tissue, multiple scattering hinders direct light focusing at depths beyond one transport mean free path. As a solution to this problem, time-reversed ultrasonically encoded (TRUE) optical focusing is proposed based on ultrasonic encoding of diffused laser light and optical time reversal. In TRUE focusing, a laser beam of long coherence length illuminates a turbid medium, where the incident light undergoes multiple scattering and part of it gets ultrasonically encoded within the ultrasonic focal zone. A conjugated wavefront of the ultrasonically encoded light is then generated by a phase conjugate mirror outside the medium, which traces back the trajectories of the ultrasonically encoded diffused light and converges light to the ultrasonic focal zone. Here, we report the latest experimental improvement in TRUE optical focusing that increases its penetration in tissue-mimicking media from a thickness of 3.75 to 7.00 mm. We also demonstrate that the TRUE focus depends on the focal diameter of the ultrasonic transducer.
Keywords: ultrasonic modulation; optical phase conjugation; time reversal; multiple scattering; light manipulation, holographic recording.
Introduction
In biomedical optical imaging, a variety of technologies, such as confocal microscopy, multiphoton microscopy, and optical coherence tomography, are being pushed to improve the imaging resolution and penetration depth in tissue. However, multiple scattering is an insurmountable barrier for direct focusing into biological tissue at depths beyond one transport mean free path, which limits the penetration depth of these technologies to ∼1 mm in the skin. To overcome this optical diffusion limit, the incident wavefront can be shaped to maximize the possibility of delivering light to a desired region. One such approach that focuses light inside,1 or through,2 a turbid medium is to adaptively shape the wavefront of the incident light through a feedback loop. The feedback mechanism, however, requires the presence of a guide star—a luminous point. In addition, the iterative feedback algorithm is computationally intensive and takes several minutes to complete the wavefront optimization, which is much longer than the millisecond time scale required for biological tissues. These limitations prevent the technology from being practical for biomedical imaging. Nevertheless, iterative shaping with a feedback loop is not the only way to shape the incident wavefront. By generating a phase conjugated copy, i.e., a wavefront whose shape is identical down to the wavelength scale, optical phase conjugation (OPC) can suppress the turbidity effects of scattering media and can focus through biological tissues.3
Recently, time-reversed ultrasonically encoded (TRUE) optical focusing4 has been proposed. By phase conjugating a wavefront that emanates from a virtual source (i.e., a guide star) inside a turbid medium, light is focused back to the spot coinciding with the virtual source. In this technique, a focused ultrasound wave noninvasively modulates diffused coherent light, providing a virtual source in the turbid medium. Outside of the medium, a phase conjugate copy of the modulated diffused light wavefront is generated through a holographic method, and is focused back to the virtual source location inside the scattering medium. Here, the TRUE focal region is determined by the focused ultrasonic wave, whose scattering is negligible compared to light in tissue. Therefore, TRUE optical focusing can noninvasively and dynamically focus light to an arbitrary location within a turbid medium.
In this article, we report the latest experimental improvement in TRUE optical focusing that increases its penetration from a thickness of 3.75 to 7.00 mm in tissue-mimicking media. We also demonstrate that the TRUE focus depends on the focal diameter of the ultrasonic transducer.
Methods
Experimental Setup
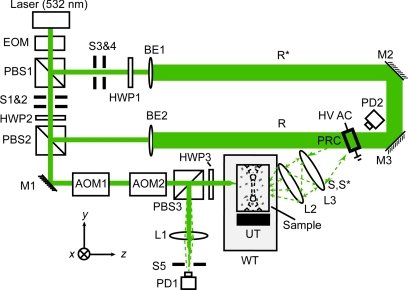
TRUE focusing consists of two consecutive procedures, i.e., holographic recording and reading. In the recording procedure, light diffuses inside a scattering medium, where part of the light is encoded by a focused ultrasonic wave. The encoded light from this virtual source, noted as S, interferes with a reference beam to form a stable hologram, which is recorded in a photorefractive crystal (PRC). In the reading procedure, both S and R are blocked, and a conjugate reference beam R*, propagating opposite to R, illuminates the PRC to generate a wavefront S*, which is the phase conjugate ofS. S* traces back the trajectories of S to the focused ultrasonic region.
Figure 1 is a diagram of the experimental setup of the TRUE focusing system. A cw diode-pumped solid state laser (Coherent Verdi V-5, λ = 532 nm) is used as the light source. The 45° linearly polarized output from an optical isolator is transmitted through an electro-optic modulator (EOM, Conoptics M350-50) to switch the polarization between the horizontal and vertical states by varying the driving voltage of the EOM. In the recording stage, light is vertically polarized by the EOM, so that almost all of the light is transmitted through PBS1. Then, the light is split into a signal beam S (with vertical polarization) and a reference beam R (with horizontal polarization) by a variable beam splitter composed of a half-wave plate (HWP2) and a polarizing beam splitter (PBS2). The signal beam is sent through two acousto-optic modulators (AOM1 and AOM2, IntraAction AOM-802AF1) in series to tune its optical frequency to fS = f0 − fa, where f0 is the laser frequency and fa is the net frequency shift due to the two AOMs. The signal beam, after transmitting through PBS3, is incident on the front surface of a tissue-mimicking phantom.
Figure 1.
Schematic of the experimental setup for TRUE optical focusing. EOM, electro-optic modulator; PBS1-3, polarizing beam splitter; S1-3, shutter; HWP1-3, half-wave plate; M1-3, mirror; AOM1-2, acousto-optic modulator; L1-3, lens; PD1,2, photodiode; BE1,2, beam expander; R, reference beam; R*, conjugate reference beam; WT, water tank filled with deionized water; UT, ultrasonic transducer; S, collected diffused signal light through the sample; S*, time-reversed signal light; PRC, photorefractive crystal [a 10 × 10 × 5 mm3 Bi12SiO20 (BSO) crystal was used in the study]; HV ac, high voltage ac electrical field; xyz, system coordinates (x = sample scanning axis, y = acoustic axis, and z = axis of incident signal beam propagation).
The incident light is multiply scattered in the phantom, and within the focused ultrasonic beam it is encoded by an ultrasonic wave with frequency fa. Three different ultrasonic transducers are used in the experiment: Panametrics A381S for fa = 3.5 MHz, Panametrics A302S for fa = 1.0 MHz, and Sonic Concepts H-148 for fa = 2.0 MHz. A function generator (Agilent 33250A) generates a sinusoidal wave with a specific frequency, amplitude, and burst duration (200 ms), which is synchronized for the whole period of recording and reading. The synchronized wave is sent to a power amplifier (50 dB, ENI, 240L), resulting in pressures of 0.70 MPa at the 3.5 MHz ultrasonic focus, 0.33 MPa at the 1.0 MHz focus, and 1.44 MPa at the 2.0 MHz focus. The corresponding mechanical indexes are 0.37, 0.33, and 1.02, respectively. To maximize the ultrasonic encoding efficiency, the ultrasonic focus is aligned to overlap the center of the diffused light profile within the medium. The light encoded by the ultrasonic wave has a frequency shift of fa.
The transmitted light exiting the back side of the sample consists of three spectral components: the “unencoded” photons at fS = f0 − fa, and the “encoded” photons S(f+) and S(f−) at f+ = f0 and f− = f0 − 2fa, respectively. All three light components are collected and mixed with R within a 10 × 10 × 5 mm3 Bi12SiO20 (BSO) crystal, but only S(f+) can form a stable interference fringe with R, which is recorded in the crystal; the other frequency components form traveling interference fringes that are averaged out within the 190 ms recording time. To enhance the recording efficiency, a 2.1 kHz, 8 kV (peak-to-peak) high voltage square wave electrical field is applied across the crystal. The response time of the crystal is approximately inversely proportional to the illuminating light intensity.
In the subsequent reading stage, the EOM changes the laser beam to horizontal polarization. As a result, both the signal and reference beams are now turned off, and the beam reflected by PBS1 forms R*, which is incident on the crystal in the direction opposite that of R. The polarization of R* is tuned by HWP1 to accommodate the optical activity of the BSO crystal. The hologram recorded by S and R in the crystal thus can be read by R* to generate a time-reversed copy of S(f+), denoted as S*(f+). Due to its reversibility, S*(f+) accurately traces back the trajectories of S(f+) to the focused ultrasonic region, hence achieving optical focusing inside the scattering medium.
In the ultrasonic focal zone, S*(f+) is again ultrasonically modulated, resulting in three components: S*(f+), S*(f+ + fa), and S*(f+ − fa) (with frequencies at f0, f0 + fa, and f0 − fa, respectively). All three components were transmitted through the rest of the sample, with polarization tuned by HWP3 for maximum reflection at PBS3. The time-reversed light is finally focused by lens L1 onto a photodiode PD1 with 13 mm2 of active aperture (Thorlabs PDA36A). The collected TRUE signal is digitized by an oscilloscope (Tektronix TDS5034) and downloaded to a computer for further processing.
In our previous work,4 we demonstrated the focusing of light into the middle of a tissue-mimicking phantom sample with an optical thickness of 25 (i.e., thickness of 25 mean free paths), equivalent to a depth of 1.25 mm in soft tissue. In this paper, the system was updated by employing an EOM to switch light between writing and reading, in order to focus light deeper into the turbid media. Three tissue-mimicking phantoms, made from porcine gelatin, water, and intralipid, with different thicknesses but the same anisotropic factor, were used in the study.
Results
Time-Reversed Ultrasonically Encoded Signal and a Comparison To Ballistic Light
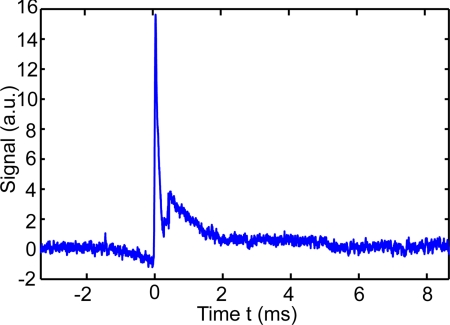
Compared with wavefront correction techniques that require seconds or even minutes, a PRC has a much faster response, which monotonically decreases as a function of optical illumination intensity5 for the formation of a stable hologram. The response time was on the order of 100 ms in our experiment, limited by the weak intensity of the modulated light. During the measurements, the recording time was set to 190 ms, which effectively averaged out influences from ambient sources, e.g., air disturbance. In the reading procedure, the hologram written on the BSO crystal was almost instantly erased by intense illumination, and simultaneously a phase conjugate copy was generated from the diffraction on the crystal. An example of the obtained TRUE signal waveform is shown in Fig. 2, and the amplitude of the peak immediately after both shutters S1 and S2 are turned on at time 0 is recorded as a TRUE signal. The noise mainly came from shot noise and the spatial noise of randomly distributed charge carriers, both of which can be reduced by coherent averaging.
Figure 2.
An example waveform of the detected TRUE signal from a 5-mm thick scattering sample with scattering coefficient μs = 10 mm−1 and scattering anisotropy g = 0.9. The peak from 0 to 0.2 ms is the TRUE signal, and the subsequent fluctuation comes from electronic coupling noise.
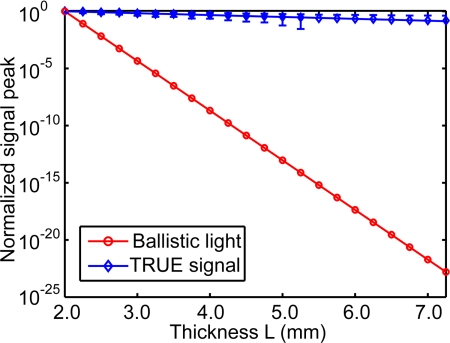
Compared with the negative exponential decaying of ballistic light, the TRUE signal originating from modulated diffused light had a much slower decay rate, as shown in Fig. 3. Hence, the TRUE signal was more resistant to multiple scattering, and more efficient in delivering energy to a target in biological tissue. After transmitting through a turbid layer with an optical thickness of μtL, the output ballistic light intensity I1 equals I0exp ( − μtL), where I0 is the input laser intensity, the extinction coefficient μt = μs + μa = 10 + 0.01 ≈ 10 mm−1 is a sum of the scattering and absorption coefficients μs and μa, and L is the thickness of the turbid layer. In contrast, the fluence rate of diffused light is characterized by exp ( − μeffρ), where the effective attenuation coefficient , the reduced scattering coefficient , g is the scattering anisotropic factor of a scattering medium, and ρ is the distance between the observation point and the source point.6 The fluence rate at the middle plane of a diffuse layer, in which the ultrasonic focus modulates the diffused light, is proportional to exp ( − μeffL/2). The modulated light is multiply scattered, and the diffusion of modulated light can again be described by the diffusion theory, which leads to another decay factor exp ( − μeffL/2). Finally, the fluence rate of the transmitted modulated light is proportional to exp ( − μeffL). In the time-reversal phase of TRUE optical focusing, the optical absorption from the medium surface to the virtual source and the following random scattering from the virtual source to the opposite surface further attenuate the TRUE signal. The experimentally measured TRUE signal has a decay rate of 0.32 mm−1, which is greater than μeff = 0.20 mm−1.
Figure 3.
Comparison of the experimental TRUE optical signal (with error bar) and the computed ballistic light signal at varied thickness L. The TRUE signal had a much smaller decay rate, while ballistic light decays as a negative exponential function of thickness.
Focusing Into an Optical Thickness of 37.5
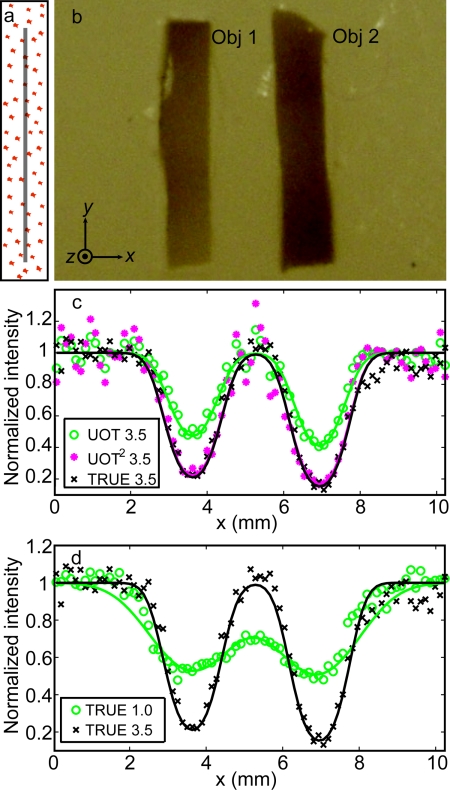
The first phantom [Fig. 4a, 4b] was 7.5-mm thick, with a scattering coefficient μs = 5 mm−1 at 532 nm, giving an optical thickness of 37.5. Again, the scattering anisotropy is g = 0.9. Two absorption inclusions (Obj 1 and 2) measuring 1.5 × 6.0 × 0.8 mm along their XYZ-axes, were embedded in the middle. These inclusions were made of the same material as the background, except that they were dyed with India ink to provide an optical absorption contrast (μa = 1.17 mm−1). Two ultrasound transducers were used: one with a 3.5 MHz central frequency (Panametrics A381S, focal length F = 38 mm, aperture size D = 19 mm, and focal width w = 0.87 mm), and the other one with a 1.0 MHz (Panametrics A302S, focal length F = 41 mm, aperture size D = 25 mm, and focal width w = 2.49 mm). There exists a relation, w = cF/faD, where c is the speed of sound in soft tissue. During the experiment, the phantom was scanned along the x axis with respect to stationary light and ultrasound beams. At each position, both the TRUE signal (collected by PD1) and the traditional ultrasound-modulated optical tomography (UOT) signal (collected by PD2) were recorded, from which one-dimensional (1D) TRUE and UOT images were shown as a function of the phantom position [Figs. 4c, 4d]. In this study, the laser output was 1.20 W, and the ultrasonic pressures were 0.70 MPa at the 3.5 MHz ultrasonic focus, and 0.33 MPa at the 1.0 MHz ultrasonic focus.
Figure 4.
Imaging results of the phantom with an optical thickness of 37.5. (a) Illustration of the phantom on a YZ plane showing the plane of the absorbing objects, indicated by the gray line, buried in the middle of the phantom. (b) Cross-section of the phantom on the central XY plane. The two absorbing inclusions (Obj 1 and Obj 2) had similar dimensions: x = 1.5 mm, y = 6.0 mm, and z = 0.8 mm, while the whole sample's dimensions were x = y = 60.0 mm and z = 7.5 mm. (c) Comparison of normalized UOT and TRUE images of the sample with the 3.5 MHz transducer. The fitted TRUE image coincides with the fitted UOT2 image, which is computed by the mathematic square of the UOT image signal strength. The coefficients of determination R2 of the TRUE 3.5, UOT 3.5, and UOT2 3.5 fits are 0.95, 0.93, and 0.90, respectively. Again, the results verify that the TRUE signal is proportional to the square of the UOT signal (UOT2), consistent with the square law4. (d) Normalized TRUE images with the 3.5 (black cross) and 1.0 (green circles) MHz transducers. The R2 value of the 1.0 MHz fit is 0.90. In (c) and (d), the symbols represent experimental data, while the solid curves represent Gaussian fits.
As shown in Fig. 4c, both the TRUE and UOT images can distinguish the two objects from the background, and the TRUE image concords with the UOT2 image. The resolutions of the TRUE and UOT images—defined as the full widths at half maximum (FWHMs) of the approximated Gaussian profiles of the 3.5 MHz transducer—were 0.63 and 0.88 mm, respectively. Because of the square law,4 the ratio between the resolutions of the UOT and TRUE images with the same transducer is . The square relation shows that light can be focused back into a scattering medium with an optical thickness of 37.5, i.e., an equivalent thickness of 3.75 mm in tissue. Figure 4d shows the comparison of the normalized TRUE images obtained with a 3.5 MHz transducer (represented by black crosses and solid line) and with a 1.0 MHz transducer (represented by green circles and line). The spatial (FWHM) resolution of the 1.0 MHz TRUE image was 1.60 mm. The ratio 2.49 mm/1.60 mm equals 1.5, which agrees with . The poor resolution in the 1.0 MHz image is also accompanied by a low imaging contrast at 16%, defined by (Imax−Imin)∕(Imax+Imin), where I is the relative signal amplitude. In comparison, the 3.5 MHz TRUE measurement achieves an imaging contrast of 73%. Obviously, tighter focusing can be achieved with higher frequency ultrasound. Nevertheless, encoding efficiency is inversely proportional to the square of the ultrasonic frequency.7 We found that using the 3.5 MHz transducer working at optimal output, light could not be focused into a 5-mm thick tissue-mimicking sample with μs = 10 mm−1, even when the laser output was raised to 1.80 W.
Focusing Into an Optical Thickness of 50
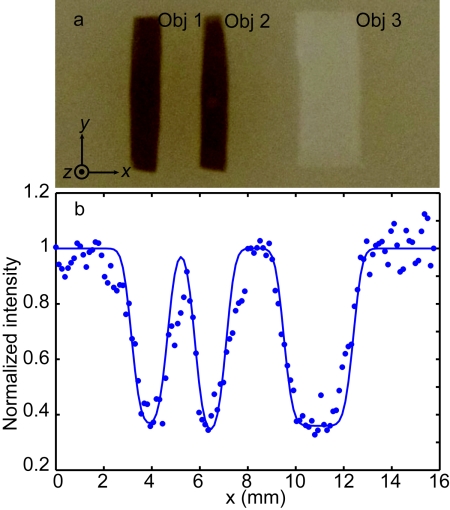
To focus into a thicker scattering sample, in addition to increasing the laser output to 1.80 W, a more efficient ultrasonic encoding was applied by using a 2.0 MHz HIFU transducer (Sonic H-148, focal length F = 63 mm, aperture size D = 64 mm, and focal width w = 0.70 mm). Optimized pressure at the ultrasonic focus was 1.44 MPa. Figure 5 shows the results acquired from a 5-mm thick phantom, whose scattering coefficient μs = 10 mm−1 and optical thickness was 50, equivalent to a 5 mm thick tissue. Three inclusions—Obj 1 and 2 (absorbing), and Obj 3 (scattering)—were embedded in the middle plane of the phantom as shown in Fig. 5a.
Figure 5.
Focusing results in the phantom with an optical thickness of 50 with the 2.0 MHz HIFU transducer. (a) Photograph of the sample dissected at the middle plane, which contains two absorbing objects (Obj 1 and Obj 2, absorption coefficient μa = 0.80 mm−1, scattering coefficient μs = 10 mm−1, and scattering anisotropy g = XX) and one scattering object (Obj. 3, scattering coefficient μs = 50 mm−1 and scattering anisotropy g = XX). The widths of the three objects were 1.4, 1.2, and 3.3 mm, respectively, and their lengths and thicknesses were all 6.1 and 0.7 mm, respectively. (b) Normalized TRUE images as a function of phantom position along the x direction.
In Fig. 5b, the blue dots (experimental data) and solid line (Gaussian fit) represent the TRUE image with the 2.0 MHz transducer. As we can see, the experimental data and the Gaussian fit agree quite well (R2 = 0.90), giving an imaging spatial resolution (FWHM) of 0.50 mm, which equals the value of the 2.0 MHz transducer focal width (0.70 mm) over . The imaging results verified that light was focused into the tissue-mimicking phantom at a depth of 2.5 mm, and the focus was determined by the focal region of the 2.0 MHz transducer.
Focusing Into a Phantom With an Optical Thickness of 70
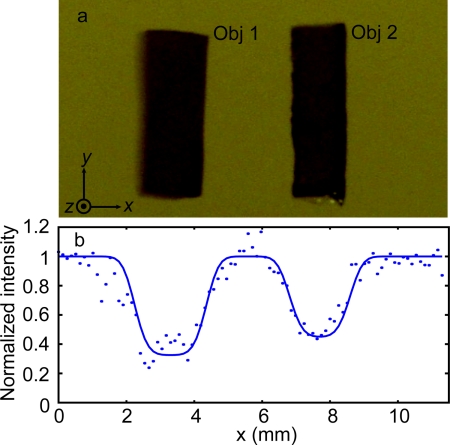
Based on the current setup, the maximum obtained TRUE focusing optical thickness was 70, i.e., an equivalent 7 mm tissue thickness, and the results are shown in Fig. 6. The agreement between experimental data and the fitted curve, despite the relatively low signal-to-noise ratio (SNR) as indicated by an R2 of 0.86, demonstrated that light was indeed focused to the ultrasonic focus within the 7-mm thick tissue-mimicking sample.
Figure 6.
TRUE image of a sample with an optical thickness of 70 with the 2.0 MHz HIFU transducer. (a) Photograph of the sample embedded with two absorption objects (Objs 1 and 2) in the middle plane after dissection. The widths of the two objects were 2.0 and 1.7 mm, respectively, and their lengths and thicknesses were all 6.0 mm and z = 0.7 mm. The full dimensions of the sample were 60×60×7 mm3. (b) A TRUE image of the sample.
Discussion
Wavefront shaping, mentioned in Sec. 1, is an intensively studied technique for enhancing light flux within a defined region. In this technique, light is modified to propagate along optical trajectories that cross the predefined zone. However, limited by spatial resolution, i.e., the smallest element size of a spatial light modulator, light power within the focal zone decays as a function of optical thickness, and around the focus is the diffused background. Once the optical thickness exceeds a certain point, the focal intensity cannot surpass the background level, even after optimization. In contrast, in the TRUE focusing presented in this study, phase conjugate light in play back converges back to the focus labeled by ultrasound modulation. In addition, the background diffraction caused by crystal defects and holographic noise is orders of magnitude smaller, and can be even damped with high quality crystals. Therefore, the focal spot in TRUE is easier to distinguish from the background. Another significance of TRUE focusing, compared to wave shaping, is the millisecond response, which can be accelerated by using faster response photorefractive materials.
Theoretically, a 4π solid angle phase-reversed replica is required for accurate OPC. In practice, however, considering the effective response area and angle of a phase conjugate mirror (PCM), a phase-reversed copy can be achieved only within a paraxial regime.8 Therefore, the fidelity of OPC is restricted by the finite aperture of the PCM, which is characterized by the smallest transverse scale of aberration that can be compensated for. It is of the order l/a, where l is the distance of the PCM away from the observing plane for the diffused light, and a is the aperture size of the PCM.9 Nevertheless, this limitation on the correctable transverse scale imposes little constraints on the TRUE optical focus in turbid media, due to the fact that multiple scattering broadens the light angular distribution10, 11 and breaks the diffraction limit. Consequently, the tightness of TRUE focusing is determined only by the ultrasonic focal zone rather than the finite aperture of the PCM.
In this paper, scattering-dominant tissue-mimicking samples are currently used for proof-of-feasibility demonstration. To extend TRUE focusing to biomedical applications, such as tissue imaging, tumor diagnosis, and photodynamic therapy, focusing into soft biological tissue is the next goal. Besides optical absorption and scattering properties, other factors should be considered. First is inhomogeneity, such as direction-oriented muscle fibers, cartilages, and blood vessels, which may reduce the ultrasonic tagging efficiency and dampen TRUE focusing. Second is the stability of tissue microstructure, which is essential for time reversal. However, the physiological motion and thermal vibration of scatterers, which can be reinforced by acoustic and optical energy deposition, gradually distorts the optical train and finally breaks the reversibility for time reversal. In experiments, we found that TRUE signals actually decreased beyond certain values of ultrasonic pressure and laser output. Hence, an efficient way to focus into thick biological tissue is using a large area of photorefractive material with fast response, to accomplish writing and reading within tissue speckle de-correlation time, which is on a millisecond scale because of the inherent thermal vibration and physiological motions.12
For therapeutic purposes and high SNR probes, an intense fluence rate within the ultrasonic focus is demanded. But, for the dynamic holographic material we used, the energy gain of time reversed focal light was smaller than unity, since the hologram was erased in the reading procedure. However, its intensity gain was enhanced with an intense reading beam at the expense of a shortened time in reading. In some materials, holograms can be fixed by heating or an external electric field, and there is no restriction on intensity gain and energy gain in playing back fixed holograms. Numerous photons can be focused into the turbid media to interact with and even burn particles, cells, and clusters within the focus. Besides hologram fixing, nondestructive read-out of holograms can also be realized by the two-photon storage technique5 for fast response.
Conclusions
In this study, by using an EOM to switch light between recording and reading, as well as using lower frequency ultrasound waves, we increased the TRUE focusing thickness stepwise from 2.5 to 3.75 and 7.0 transport mean free paths, which are equal to the mean free path divided by (1 – g). We also demonstrated that the focal region, determined by focused ultrasonic wave, was scalable with the focused ultrasonic region. In summary, the utilization of TRUE focusing allows us to dynamically deliver diffused light to an arbitrary spot inside a turbid medium to manipulate light-matter interaction and see into the turbid medium.
Acknowledgments
The authors appreciate Professor James Ballard's editing of the manuscript. This research is funded in part by the National Institutes of Health Grant Nos. R01 EB000712 and U54 CA136398.
References
- Vellekoop I. M. and Mosk A. P., “Focusing coherent light through opaque strongly scattering media,” Opt. Lett. 32, 2309–2311 (2007). 10.1364/OL.32.002309 [DOI] [PubMed] [Google Scholar]
- Vellekoop I. M., van Putten E. G., Lagendijk A., and Mosk A. P., “Demixing light paths inside disordered metamaterials,” Opt. Exp. 16, 67–80 (2008). 10.1364/OE.16.000067 [DOI] [PubMed] [Google Scholar]
- Yaqoob Z., Psaltis D., Feld M. S., and Yang C., “Optical phase conjugation for turbidity suppression in biological samples,” Nature Photon. 2, 110–115 (2008). 10.1038/nphoton.2007.297 [DOI] [PMC free article] [PubMed] [Google Scholar]
- Xu X., Liu H., and Wang L. V., “Time-reversed ultrasonically encoded optical focusing,” Nature Photon. 5, 154–157 (2011). 10.1038/nphoton.2010.306 [DOI] [PMC free article] [PubMed] [Google Scholar]
- Solymar L., Webb D. J., and Grunnet-Jepsen A., The Physics and Applications of Photorefractive Material, Clarendon Press, Oxford: (1996). [Google Scholar]
- Wang L. V. and Wu H.-I, Biomedical Optics: Principles and Imaging, Wiley-Interscience, Hoboken, NJ: (2007). [Google Scholar]
- Sakadžić S. and Wang L. V., “Modulation of multiply scattered coherent light by ultrasound pulses- an analytical model,” Phys. Rev. E 72, 036620 (2005). 10.1103/PhysRevE.72.036620 [DOI] [PubMed] [Google Scholar]
- Holmes R. B., “A perturbation analysis of polarization-decoupled Brillouin- enhanced four-wave mixing,” IEEE J. Quantum Electron. 26, 1980–1989 (1990). 10.1109/3.62117 [DOI] [Google Scholar]
- Concetto R. G., “Applications of optical phase conjugation,” Phys. Today 34, 27–35 (1981). [Google Scholar]
- Vellekoop I. M., Lagendijk A., and Mosk A. P., “Exploiting disorder for perfect focusing,” Nature Photon. 4, 320–322 (2010). 10.1038/nphoton.2010.3 [DOI] [Google Scholar]
- Cui M., McDowell E. J., and Yang C., “Observation of polarization-gate based reconstruction quality improvement during the process of turbidity suppression by optical phase conjugation,” App. Phys. Lett. 95, 123702 (2009). 10.1063/1.3236836 [DOI] [PMC free article] [PubMed] [Google Scholar]
- Gross M., Goy P., Forget B. C., Atlan M., Ramaz F., Boccara A. C., and Dunn A. K., “Heterodyne detection of multiply scattered monochromatic light with a multipixel detector,” Opt. Lett. 30, 1357–1359 (2005). 10.1364/OL.30.001357 [DOI] [PubMed] [Google Scholar]


