Abstract
Epithelial barrier function is contingent on appropriate polarization of key protein components. Work in intestinal epithelial cell cultures and animal models of bowel inflammation suggested that atypical PKC (aPKC), the kinase component of the Par3–Par6 polarity complex, is downregulated by pro-inflammatory signaling. Data from other laboratories showed the participation of myosin light chain kinase in intestinal inflammation, but there is paucity of evidence for assembly of its major target, non-muscle myosin II, in inflammatory bowel disease (IBD). In addition, we showed before that non-muscle myosin IIA (nmMyoIIA) is upregulated in intestinal inflammation in mice and TNFα-treated Caco-2 cells. Thus far, it is unknown if a similar phenomena occur in patients with IBD. Moreover, it is unclear whether aPKC downregulation is directly correlated with local mucosal inflammation or occurs in uninvolved areas. Frozen sections from colonoscopy material were stained for immunofluorescence with extensively validated specific antibodies against phosphorylated aPKC turn motif (active form) and nmMyoIIA. Inflammation was scored for the local area from where the material was obtained. We found a significant negative correlation between the expression of active aPKC and local inflammation, and a significant increase in the apical expression of nmMyoIIA in surface colon epithelia in inflamed areas, but not in non-inflamed mucosa even in the same patients. Changes in aPKC and nmMyoIIA expression are likely to participate in the pathogenesis of epithelial barrier function in response to local pro-inflammatory signals. These results provide a rationale for pursuing mechanistic studies on the regulation of these proteins.
Keywords: PKCι, PKCζ, Epithelial polarity, Crohn's disease, Ulcerative colitis, Non-muscle myosin IIA
Introduction
The polarity complex is an evolutionarily conserved set of proteins involved in the development of cell polarity and the establishment of tight junctions in epithelia [1]. It comprises atypical protein kinase C (aPKC, PKCζ and PKCι/λ isoforms), as well as the orthologs of Caenorhabditis elegans PARtition-defective mutant proteins [2] Par3 and Par6 [3]. The polarity complex regulates the formation and positioning of tight junctions in Drosophila [4] and vertebrate epithelia [5–7]. Like other PKC isoforms, aPKC is activated by PDK1-dependent phosphorylation in the activation loop (T403 in PKCι, T410 in PKCζ) followed by autophosphorylation of the turn motif (T555 PKCι, T563 PKCζ). A phosphorylated turn motif is, therefore, a bona fide reporter of aPKC active conformation [8].
Mutations in the polarity complex-associated protein Crumbs are responsible for human retinal dystrophy (OMIM 600105) [9], and components of the polarity complex seem to participate in cancer [10], but other involvement of the polarity complex in human disease has not been reported so far. Because inflammatory bowel disease (IBD) pathogenesis includes opening of tight junctions with increased paracellular permeability in intestinal epithelia [11], we sought to identify changes in the aPKC–Par complex during inflammation. We found that aPKC and Par3 are downregulated in human intestinal cells in tissue culture in response to TNF-α stimulation under conditions that do not induce apoptosis. Likewise, aPKC was sharply downregulated in mouse intestinal epithelia in DSS-induced colitis [12]. The molecular mechanism underlying the aPKC downregulation was found to be entirely posttranslational and mediated by inhibition and downregulation of Hsp/Hsc70 chaperones. These are known to maintain steady-state aPKC levels by rescue from proteasomal degradation [13]. Other groups have reported downregulation of Hsp70 chaperones in intestinal inflammation as well [14]. Altogether, these data lead us to hypothesize that aPKC may be also downregulated in IBD patients.
It is broadly accepted that pro-inflammatory signaling results in activation of the long (225 kDa) isoform of myosin light chain kinase (MLCK) in the intestinal epithelium [15]. In fact, overexpression of MLCK was observed in IBD patients [16]. MLCK activity is known to induce non-muscle myosin II assembly in non-muscle cells, enhancing the assembly of stress fibers and other cortical acto-myosin structures [17, 18]. Accordingly, the implication for MLCK activation is that non-muscle myosin II assembly is a final effector of pro-inflammatory signaling on the epithelium resulting in either contractile mechanical tension applied on the tight junctions or endocytic removal of tight junction components [19]. From the three non-muscle myosin II isoforms (nmMyoIIA, nmMyoIIB, and nmMyoIIC heavy chains products of MYH9, MYH10, and MYH14, respectively), only nmMyoIIA is associated to tight junction function [20]. Coincidentally, we found that shRNA-mediated aPKC knockdown in intestinal cells results in apical upregulation of nmMyoIIA, but not IIB or IIC that mimics TNFα stimulation. Likewise, inflammation in a mouse model also resulted in specific upregulation of nmMyoIIA in the apical region of colonocytes [12]. In summary, our current hypothesis is that, in addition to MLCK activation, inflammatory cytokines induce posttranslational downregulation of aPKC, which can also result in upregulation of nmMyoIIA. This work was undertaken to test if these predictions are true in patients with IBD.
Materials and methods
Bioethical considerations
Biopsies were obtained from patients with IBD, who provided consent under a University of Miami IBD-approved protocol for research. Patient identity was known only to the physician practicing the intervention and not revealed to the research team that handled codified specimens. Whenever possible, biopsies were taken from inflamed and uninflamed areas of the colon and terminal ileum in Crohn's disease (CD) and ulcerative colitis (UC) patients. Data on colonoscopic severity of inflammation were recorded at the time of endoscopy.
Tissue processing
The composition of the patient cohort is shown in Table 1. Biopsies were obtained by colonoscopy and immediately processed for standard pathology procedures. A small fraction of the tissues obtained in the colonoscopy was fixed in 10% trichloroacetic acid for 10 min, a procedure known to specifically preserve phospho-epitopes [21]. We have demonstrated that this fixation is appropriate for the preservation of the phosphorylated turn motif of aPKC (pT555 PKCι and pT563 PKCζ) [13]. It also preserves the antigenicity of human nmMyoIIA for the antibodies utilized in this study [12]. The tissues were then transferred to phosphate-buffered saline and frozen in OCT in isopentane at melting temperature. Frozen blocks were sectioned and processed within 3 months. Frozen sections were processed for immunofluorescence with any of the following antibodies: polyclonal anti-pT555/pT563 aPKC (Abcam, hereafter referred to as pT555) and polyclonal anti-nmMyosin IIA (isoform specific, Covance), both raised in rabbit, and the appropriate CY3-coupled affinity-purified secondary antibody raised in donkey (Jackson Laboratories). For colocalization, the same antibodies were used following a published protocol for differential identification of two primary antibodies raised in the same species [22]. Briefly, one of the primary antibodies (anti-nmMyoIIa) was mixed with an approximately equimolecular concentration of Dylight 488-conjugated affinity-purified Fab fragments of anti-rabbit IgG raised in goat (Jackson Laboratories). Then the excess of fluorescent antibody was removed on rabbit IgG covalently bound to Sepharose 4B. The samples were first incubated with the other primary antibody (anti-pT555 aPKC), then with a CY3-labeled anti-rabbit antibody, then with non-immune rabbit IgG, and, finally, with the mixture described above. All sections were counterstained with DAPI. The sections were mounted in buffered 10% polyvinyl alcohol supplemented with 1% propyl gallate (anti-fading agent), and imaged within 48 h. The antibodies used in the study were all from the same batch, aliquoted at the beginning of the procedures. Independent aliquots were kept frozen and used for each group of tissues (normally two to four) processed at the same time.
Table 1.
Patient sample composition and scoring
| Ulcerative colitis | Crohn's disease | |||
|---|---|---|---|---|
| Scores 1–3 | Score 0 | Scores 1–3 | Score 0 | |
| Total number of patients | 10 | 5 | 13 | 3 |
| Male | 2 | 3 | 5 | 2 |
| Female | 8 | 2 | 8 | 1 |
| Percent of patients | Expected random proportion (%) | |||
| Fully consistent scores (0 or 3) | 54.8 | 25 | ||
| Mismatching score component for 1 or 2 score values: | ||||
| Macroscopic | 19.3 | 25 | ||
| Pathology report | 6.4 | 25 | ||
| Infiltration in the same sample | 19.3 | 25 | ||
Image acquisition and processing
Image acquisition was performed blindly in a Leica SP5 confocal microscope using a ×63 oil-immersion 1.3 numerical aperture objective. Confocal acquisition parameters were determined at the beginning of the study and the same parameters (e.g., gains, slit aperture, laser intensity) used for all the images. Confocal optical sections were 0.6 μm thick. Importantly, image acquisition was performed blindly by block number without information of the inflammation score. Field selection was performed using the DAPI channel to identify epithelial structures, without checking the red channel (for pT555 or nmMyoIIA signal). All the cells showing apical and basal domains in every image were used for quantification (i.e., oblique sections were excluded). The cells per sample ranged 6–42.
Measurement of specific signals was performed also blindly from inflammation status by another individual. In all cases regions of interest (ROI) were selected following preestablished rules as follows. For pT555-aPKC signal, small ROIs at the apical edge of the cells (determined by the end of slim background signal) were compared with ROIs randomly localized in the subapical cytoplasm of the same cell. For each cell the average pixel intensity (red channel) was determined in a pair of ROIs and the cytoplasmic signal (“background”) was subtracted from the apical signal. For nmMyoIIA signals, the procedure was similar but one of the ROIs was located at the always positive basal side of the epithelial cells, so that the average basal signal was subtracted from the average apical signal. For each image, ROI pairs were measured in all visible epithelial cells with identifiable apical/cytoplasmic or apical/basal regions. Only a few patients were excluded from the study. Exclusion criteria were as follows: (1) lack of antibody reactivity in a certain aliquot, with the impossibility of re-sectioning the same block due to block aging or lack of additional tissue, or (2) missing histopathological or endoscopy report data to calculate a score.
Inflammation scores
Scores were calculated assigning each block a 0 or 1 value for each one of the following criteria: (1) physician colonoscopy image evaluation of the area, tissue presenting any sign of macroscopic active inflammation was assigned a 1; (2) histopathological report of the biopsied tissue: any microscopic sign of active inflammation was assigned a 1; and (3) infiltration of the section analyzed, as judged by separation between crypts and density of lymphocytes. Only the latter was known to the individuals analyzing the images. The full score was assembled in separate spreadsheets after the immunofluorescence pixel values in the images were measured.
Statistical procedures
The SAS statistical software was used for all statistical computations and analyses. The data were first assessed for normality using SAS PROC UNIVARIATE. There was no evidence for non-normality of the data so standard normal theory statistical procedures were followed. Means and standard errors were calculated using PROC MEANS. Difference between clinical score groups was compared in a one-way analysis of variance using PROC GLM followed by comparisons to the group with clinical score equal to zero as the control using Dunnett's test. The same procedure was used for comparing aPKC expression among different intestine sites with the exception that pairwise Student t tests were used following the ANOVA. Correlations were analyzed using PROC CORR. Significant differences were tested at alpha = 0.05.
Results
Patient population and scoring
Patients were consented among adult individuals diagnosed with either CD or UC, many of them currently under standard specific treatment of IBD, and undergoing colonoscopy as part of their diagnosis and follow-up (Table 1). Only 8.3% of the patients were smokers. Samples were taken in parallel and processed for hematoxylin and eosin stain for standard pathology report, and for the procedures reported here. To evaluate local inflammation in the mucosa at the point where the sample was taken, we used three independent observations: a macroscopic assessment by the endoscopist, the pathology report of a parallel sample, and the degree of lamina propria infiltration within the sample used for immunofluorescence. Importantly, all three parameters were fully consistent (scores 0 or 3) in 55% of the samples (Table 1), well above of the proportion expected by random coincidence. Furthermore, in cases where one of the parameters was different from the other two (scores 1 and 2), the histopathology was the mismatching component of the score only in 6% of the the cases, indicating strong agreement of this component of the score with at least one of the other components (Table 1). In 12 patients of the cohort, we had samples obtained from different regions, normally inflamed and uninflamed. Accordingly, the scores matched only in two of these patients, and were different by two or three in seven of the patients. These differences in the scores in samples taken from the same patient at the same time indicate that the inflammation score is representative of the local status of the mucosa and not an overall indicator of disease. This was further highlighted by the fact that the scores were independent of the treatment (Table 2). For this reason, although some patients were enrolled in the study with quiescent disease (“controls”), we preferred to compare samples according to their score, with score 0 being considered hereafter as controls.
Table 2.
Patient treatment and scoring
| Scores 1–3 | Score 0 | |
|---|---|---|
| Immune modifiers | 4 | 1 |
| TNF-α inhibitors | 3 | 1 |
| Immune modifiers and TNF-α inhibitors | 2 | 0 |
| Other treatment | 9 | 3 |
| Patients under treatment/total patients with the same score (%) | 78 | 63 |
Validation of the antibodies
The antibodies used in this study were validated by immunoblot using SDS extracts of Caco-2 human intestinal epithelial cells. The anti-pT555 PKCι was validated as a phospho-epitope antibody by treatment of the blots with either calf intestinal alkaline phosphatase or lambda protein phosphatase, both of which abrogated antibody recognition of the specific band. Likewise, the anti-nmMyoIIA was validated by immunoblot using Caco-2 cell SDS extracts. The 220-kDa band recognized by the antibody was strongly downregulated by specific anti-nmMyoIIA shRNA (not shown). The same batch of antibody, appropriately aliquoted, was used throughout the study.
aPKC pT555 signal decreases with inflammation
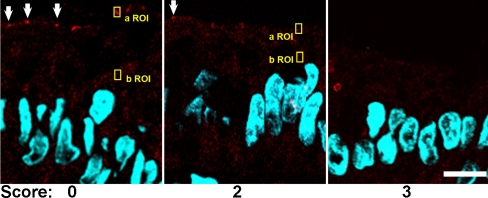
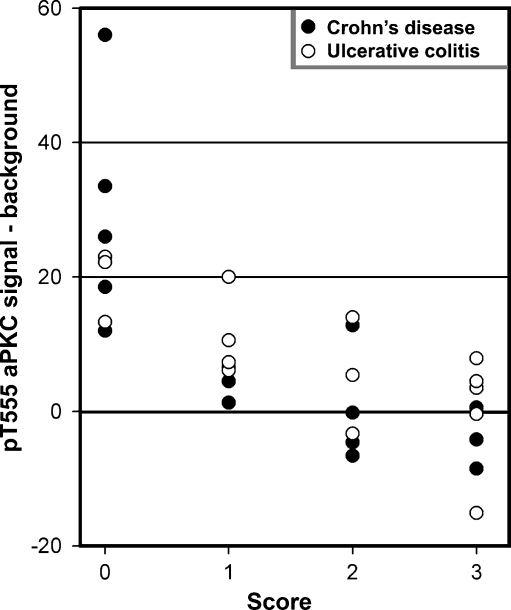
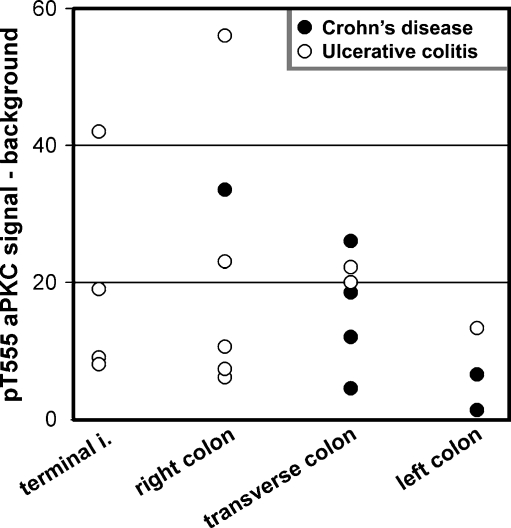
We first sought to assess the expression of aPKC in its active conformation in IBD patients. In samples from patients with score 0, pT555 aPKC signal appeared like apical “puncta” in most confocal images (Fig. 1, arrows). It also showed belt-like images around the apical region in tangential sections (not shown). Finally, it was indistinguishable from published images in mouse colon using the same antibody and fixation [12]. The apical aPKC belts have been shown to colocalize with tight junction markers [23]. In patients with scores 1–2, increasing proportions of epithelial cells either showed faint aPKC pT555 signal or no signal at all. In samples graded 3, there was no signal in most of the cells (Fig. 1). To quantify these changes, small ROI were sampled around the apical puncta when observable, or randomly on the apical border of the cytoplasm when the puncta could not be distinguished. Similar ROI were sampled on the supranuclear cytoplasm to quantify non-tight junctional signal. Because this signal is identical to background, these cytoplasmic samples were termed background signal (b ROI, typical examples in Fig. 1). The difference of the average pixel values from several randomly selected cells was averaged per patient and is shown in Fig. 2. Samples with score 0 showed all positive values, while the differences in samples with score 3 distributed around a null or slightly negative value, indicating lack of apical aPKC pT555 signal in the presence of inflammation. When the pT555 values were compared, there was a statistically significant difference among the four inflammation score groups (F 3, 28 = 12.81, p < 0.0001). Each of the higher inflammation score groups (1–3) had significantly lower pT555 change values than did the group with inflammation score of zero (t = 2.49, p < 0.05). We could not detect any difference between CD or UC patients. To determine if there is a natural difference in the distribution of aPKC signal, we plotted the values from score 0 samples obtained from the terminal ileum (not used in the rest of the study), right, transverse, and left colon. No significant differences were found among the different regions reached by endoscopy (Fig. 3).
Fig. 1.
Representative confocal immunofluorescence images of pT555 aPKC signal (red channel). The arrows point at positive pT555 aPKC signal in the apical domain. Yellow boxes are examples of typical apical (a ROI) and background (b ROI) regions of interest used for quantification of the signal (Figs. 2 and 3). DAPI (blue channel) was used to counterstain DNA. Bar, 10 μm
Fig. 2.
pT555 aPKC signal quantified in IBD patients. Average pixel intensities in one a ROI and one b ROI per cell were measured in several (6–42) randomly selected cells per sample. The average of the differences a ROI–b ROI for each sample was plotted against the inflammation score. Differences among all score groups were statistically significant (p < 0.0001)
Fig. 3.
Distribution of values of pT555 aPKC signal in terminal ileum (terminal i.), right colon, transverse colon, and left colon. Data are shown as in Fig. 2, but only from samples with score 0. In this case, samples obtained from the same patient (in 12 cases) were included. There were no statistically significant differences among the values for the different sites
Apical localization of nmMyoIIA increases with inflammation
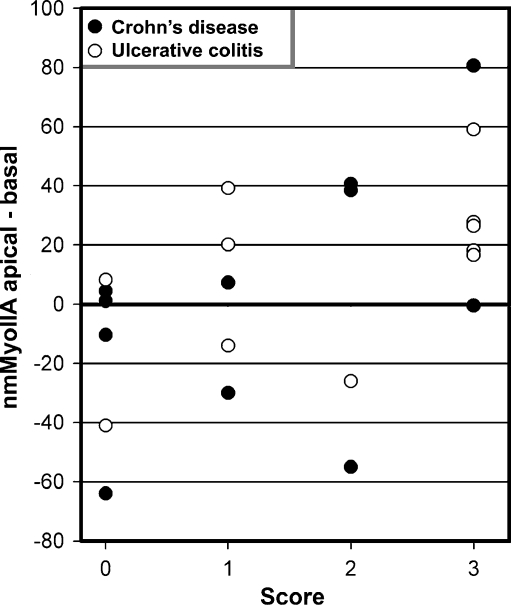
In parallel sections from the same samples, we studied the distribution of nmMyoIIA. In score 0 samples, this protein distributed to the basolateral domain with faint or no apical signal. In these samples, only sporadically, some cells showed apical signal. The proportion of cells with apical signal increased with the score, and most of the cells showed a robust apical nmMyoIIA signal in score 3 samples (Fig. 4, arrows). Like in the case of aPKC, we quantified pixel values in ROI on the apical domain (a ROI) or on the basal domain (b ROI). Unlike for aPKC, the latter do not represent background, but rather a positive signal relatively constant in all cases (typical examples shown in Fig. 4). The pixel values were quantified like in Fig. 3 and the differences are shown in Fig. 5. The group with an inflammation score of 3 had significantly higher nmMyoIIA values than did the group with a 0 inflammation score (t = 2.57, p < 0.05).
Fig. 4.
Representative confocal immunofluorescence images of nmMyoIIA signal (red channel). The arrows point at typical nmMyoIIA signal in the apical domain. Yellow boxes are examples of typical apical (a ROI) and basal (b ROI) regions of interest used for quantification of the signal (Fig. 5). DAPI (blue channel) was used to counterstain DNA. Bar, 20 μm
Fig. 5.
nmMyoIIA signal quantified in IBD patients. Average pixel intensities in one a ROI and one b ROI per cell were measured in several randomly selected cells per patient. The average of the differences for each patient was plotted against the inflammation score. There was a statistically significant difference (p < 0.05) between the score 0 and 3 groups
Correlation between apical expression of nmMyoIIA and pT555 aPKC signal
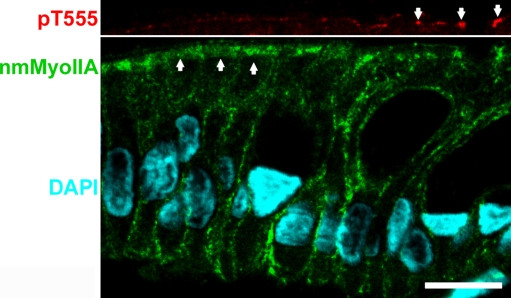
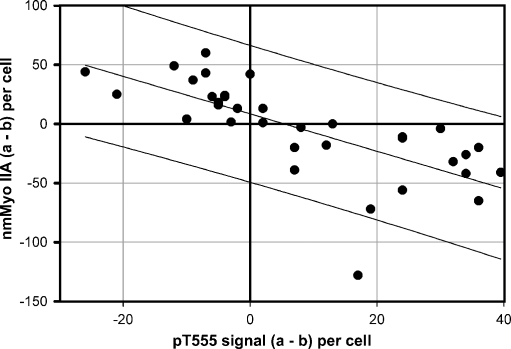
The correlation between both variables was studied on a cell-by-cell basis. We took advantage of the fact that samples with scores 1–2 often showed mixed populations of cells with and without pT555 expression (e.g., Fig. 1, score 2) and also variable levels of apical nmMyoIIA expression. Additional sections from samples scored 1–2 were double stained for both signals. In Fig. 6, the full image of the epithelium showing the nmMyoIIA signal (green) and DAPI is shown in the bottom panel. The top panel shows only the apical border of the same cells in the red channel (pT555 signal). Some cells were positive for pT555 (arrows). The apical layer of nmMyoII was missing or discontinuous in those cells. Conversely, cells with a robust apical layer of nmMyoIIA (arrows in the green image) displayed little or no pT555 signal. Images from 8 different patients were quantified for both signals as described for Figs. 2 and 5. The values for individual cells were plotted and showed a strong negative correlation (F = 34.6130, p < 0.0001; Fig. 7).
Fig. 6.
Immunofluorescence colocalization of pT555 aPKC and nmMyoIIA in samples with intermediate inflammation scores. Section of colon surface epithelium of a sample with score 2. Top panel represents the apical border of the same field as the bottom panel and is aligned. Bar, 10 μm
Fig. 7.
Cell-by-cell correlation between nmMyoIIA and pT555 aPKC signals in samples with intermediate (1–2) inflammation scores. The signals were measured as described in Figs. 2 and 5 for each individual cell (represented by one dot in the plot). Cells from eight different images from different samples were measured. Lines represent the best linear regression (central) and the 95% prediction band
Discussion
We conclude that in IBD patients, steady-state levels of aPKC in the active conformation decrease with inflammation while apical expression of nmMyoIIA increases with inflammation, and that there is a negative correlation between both signals. While these observations cannot be used to draw cause–effect conclusions, they are very consistent with published mechanistic observations in human intestinal epithelial cells in culture, showing similar variations in both proteins in response to non-apoptotic TNF-α stimulation. More importantly, shRNA-mediated knockdown of aPKC alone was shown to induce accumulation of apical nmMyoIIA [12], raising the possibility that the observations in the human biopsies reported here may be representative of a causal relationship. It is of note that the basolateral distribution of nmMyoIIA observed here is consistent with localization of nmMyoIIA to stress fibers [24], to the basal domain of MDCK cells [25], and to human colon epithelium [26]. It is also consistent with our previous observation of a constant basal nmMyoIIA signal with variable apical localization depending on inflammatory status in tissue culture intestinal cells and murine colon [12]. We conclude that the inflammatory stimulation modulates mostly the apical expression of nmMyoIIA, with little or no detectable changes in the basal domain distribution of this protein.
In regards to nmMyoIIa regulation, inflammation has been shown to result in upregulation of MLCK, specifically in the apical domain, in human IBD samples [16], which, predictably, would result in increased apical non-muscle myosin II polymerization. The aPKC and MLCK pathways are, thus, potentially complementary and synergistic. Because MLCK upregulation occurs at earlier times than aPKC downregulation in tissue culture cells subjected to pro-inflammatory signaling [27], it is also possible that MLCK upregulation may represent an acute response that is later enhanced by aPKC downregulation. The relationship between these two pathways, though, remains unknown. At this time we cannot rule out the possibility that aPKC downregulation may be a downstream consequence of MLCK upregulation.
Both aPKC and nmMyoIIA are involved in epithelial barrier permeability, an important pathophysiologic factor of IBD: (1) aPKC participates in the organization of tight junctions [23, 28]; (2) downregulation of aPKC results in a substantial decrease in transepithelial electrical resistance and an increase in nonionic fluorescent marker permeability [12]; and (3) nmMyosin II is necessary for tight junction disassembly [19]. Therefore, the changes reported here are likely to participate in the barrier function failure associated with IBD. Further mechanistic studies of the aPKC pathway in epithelial inflammatory response are necessary, as it may present novel therapeutic options. For example, a rescue of Hsp70 chaperoning activity, inhibited during inflammation [12], may prevent or ameliorate aPKC downregulation. Therefore, assessing the relative importance of this pathway as compared to other known pathways, such as MLCK, seems to be a reasonable future direction.
Acknowledgments
The authors are grateful to Mrs. Yolanda Figueroa-Menendez for the excellent technical assistance. This study is funded by grant NIDDK R01-DK076652 to PJS. Flavia A. Wald was a recipient of a Career Development Award from the Crohn's and Colitis Foundation of America.
Conflict of interest statement
We declare that we have no conflict of interest.
Open Access
This article is distributed under the terms of the Creative Commons Attribution Noncommercial License which permits any noncommercial use, distribution, and reproduction in any medium, provided the original author(s) and source are credited.
Abbreviations
- aPKC
Atypical PKC, comprises PKCι and PKCζ isoforms
- MLCK
Myosin light chain kinase—phosphorylates the regulatory light chain of myosin II and promotes myosin II assembly and function
- nmMyoIIA
Non-muscle myosin IIA—the heavy chains of this isoform are the products of the MYH9 gene
- Par
Partition-defective mutants
- ROI
Region of interest
- TNF-α
Tumor necrosis factor alpha
Footnotes
Maria T. Abreu and Pedro J. Salas contributed equally.
Funding sources
Funding source is from NIDDK, R01-087359.
References
- 1.Suzuki A, Ohno S. The PAR–aPKC system: lessons in polarity. J Cell Sci. 2006;119:979–987. doi: 10.1242/jcs.02898. [DOI] [PubMed] [Google Scholar]
- 2.Guo S, Kemphues KJ. Molecular genetics of asymmetric cleavage in the early Caenorhabditis elegans embryo. Curr Opin Genet Dev. 1996;6:408–415. doi: 10.1016/S0959-437X(96)80061-X. [DOI] [PubMed] [Google Scholar]
- 3.Macara IG. Parsing the polarity code. Nat Rev Mol Cell Biol. 2004;5:220–231. doi: 10.1038/nrm1332. [DOI] [PubMed] [Google Scholar]
- 4.Tanentzapf G, Tepass U. Interactions between the crumbs, lethal giant larvae and bazooka pathways in epithelial polarization. Nat Cell Biol. 2003;5:46–52. doi: 10.1038/ncb896. [DOI] [PubMed] [Google Scholar]
- 5.Hurd TW, Gao L, Roh MH, et al. Direct interaction of two polarity complexes implicated in epithelial tight junction assembly. Nat Cell Biol. 2003;5:137–142. doi: 10.1038/ncb923. [DOI] [PubMed] [Google Scholar]
- 6.Anderson JM, Van Itallie CM, Fanning AS. Setting up a selective barrier at the apical junction complex. Curr Opin Cell Biol. 2004;16:140–145. doi: 10.1016/j.ceb.2004.01.005. [DOI] [PubMed] [Google Scholar]
- 7.Mertens AE, Rygiel TP, Olivo C, et al. The Rac activator Tiam1 controls tight junction biogenesis in keratinocytes through binding to and activation of the Par polarity complex. J Cell Biol. 2005;170:1029–1037. doi: 10.1083/jcb.200502129. [DOI] [PMC free article] [PubMed] [Google Scholar]
- 8.Gould CM, Newton AC. The life and death of protein kinase C. Curr Drug Targets. 2008;9:614–625. doi: 10.2174/138945008785132411. [DOI] [PMC free article] [PubMed] [Google Scholar]
- 9.Bulgakova NA, Knust E. The Crumbs complex: from epithelial-cell polarity to retinal degeneration. J Cell Sci. 2009;122:2587–2596. doi: 10.1242/jcs.023648. [DOI] [PubMed] [Google Scholar]
- 10.Rothenberg SM, Mohapatra G, Rivera MN, et al. A genome-wide screen for microdeletions reveals disruption of polarity complex genes in diverse human cancers. Cancer Res. 2010;70:2158–2164. doi: 10.1158/0008-5472.CAN-09-3458. [DOI] [PMC free article] [PubMed] [Google Scholar]
- 11.Laukoetter MG, Nava P, Nusrat A. Role of the intestinal barrier in inflammatory bowel disease. World J Gastroenterol. 2008;14:401–407. doi: 10.3748/wjg.14.401. [DOI] [PMC free article] [PubMed] [Google Scholar]
- 12.Mashukova A, Wald FA, Salas PJ. Tumor necrosis factor alpha and inflammation disrupt the polarity complex in intestinal epithelial cells by a posttranslational mechanism. Mol Cell Biol. 2011;31:756–765. doi: 10.1128/MCB.00811-10. [DOI] [PMC free article] [PubMed] [Google Scholar]
- 13.Mashukova A, Oriolo AS, Wald FA, et al. Rescue of atypical protein kinase C in epithelia by the cytoskeleton and Hsp70 family chaperones. J Cell Sci. 2009;122:2491–2503. doi: 10.1242/jcs.046979. [DOI] [PMC free article] [PubMed] [Google Scholar]
- 14.Ciancio MJ, Chang EB. Do heat shock proteins play any role in gut inflammation? Inflamm Bowel Dis. 2008;14(Suppl 2):S102–S103. doi: 10.1002/ibd.20697. [DOI] [PubMed] [Google Scholar]
- 15.Marchiando AM, Graham WV, Turner JR. Epithelial barriers in homeostasis and disease. Annu Rev Pathol. 2010;5:119–144. doi: 10.1146/annurev.pathol.4.110807.092135. [DOI] [PubMed] [Google Scholar]
- 16.Blair SA, Kane SV, Clayburgh DR, et al. Epithelial myosin light chain kinase expression and activity are upregulated in inflammatory bowel disease. Lab Invest. 2006;86:191–201. doi: 10.1038/labinvest.3700373. [DOI] [PubMed] [Google Scholar]
- 17.Totsukawa G, Yamakita Y, Yamashiro S, et al. Distinct roles of ROCK (Rho-kinase) and MLCK in spatial regulation of MLC phosphorylation for assembly of stress fibers and focal adhesions in 3T3 fibroblasts. J Cell Biol. 2000;150:797–806. doi: 10.1083/jcb.150.4.797. [DOI] [PMC free article] [PubMed] [Google Scholar]
- 18.Matsumura F, Totsukawa G, Yamakita Y, et al. Role of myosin light chain phosphorylation in the regulation of cytokinesis. Cell Struct Funct. 2001;26(6):639–644. doi: 10.1247/csf.26.639. [DOI] [PubMed] [Google Scholar]
- 19.Ivanov AI, Parkos CA, Nusrat A. Cytoskeletal regulation of epithelial barrier function during inflammation. Am J Pathol. 2010;177:512–524. doi: 10.2353/ajpath.2010.100168. [DOI] [PMC free article] [PubMed] [Google Scholar]
- 20.Ivanov AI, Bachar M, Babbin BA, et al. A unique role for nonmuscle myosin heavy chain IIA in regulation of epithelial apical junctions. PLoS One. 2007;2:e658. doi: 10.1371/journal.pone.0000658. [DOI] [PMC free article] [PubMed] [Google Scholar]
- 21.Hayashi K, Yonemura S, Matsui T, et al. Immunofluorescence detection of ezrin/radixin/moesin (ERM) proteins with their carboxyl-terminal threonine phosphorylated in cultured cells and tissues. J Cell Sci. 1999;112:1149–1158. doi: 10.1242/jcs.112.8.1149. [DOI] [PubMed] [Google Scholar]
- 22.Wald FA, Oriolo AS, Mashukova A, et al. Atypical protein kinase C (iota) activates ezrin in the apical domain of intestinal epithelial cells. J Cell Sci. 2008;121:644–654. doi: 10.1242/jcs.016246. [DOI] [PMC free article] [PubMed] [Google Scholar]
- 23.Suzuki A, Yamanaka T, Hirose T, et al. Atypical protein kinase C is involved in the evolutionarily conserved par protein complex and plays a critical role in establishing epithelia-specific junctional structures. J Cell Biol. 2001;152:1183–1196. doi: 10.1083/jcb.152.6.1183. [DOI] [PMC free article] [PubMed] [Google Scholar]
- 24.Even-Ram S, Doyle AD, Conti MA, et al. Myosin IIA regulates cell motility and actomyosin–microtubule crosstalk. Nature Cell Biol. 2007;9:299–309. doi: 10.1038/ncb1540. [DOI] [PubMed] [Google Scholar]
- 25.Watanabe T, Hosoya H, Yonemura S. Regulation of myosin II dynamics by phosphorylation and dephosphorylation of its light chain in epithelial cells. Mol Biol Cell. 2007;18:605–616. doi: 10.1091/mbc.E06-07-0590. [DOI] [PMC free article] [PubMed] [Google Scholar]
- 26.Babbin BA, Koch S, Bachar M, et al. Non-muscle myosin IIA differentially regulates intestinal epithelial cell restitution and matrix invasion. Am J Pathol. 2009;174:436–448. doi: 10.2353/ajpath.2009.080171. [DOI] [PMC free article] [PubMed] [Google Scholar]
- 27.Wang F, Graham WV, Wang Y, et al. Interferon-gamma and tumor necrosis factor-alpha synergize to induce intestinal epithelial barrier dysfunction by up-regulating myosin light chain kinase expression. Am J Pathol. 2005;166:409–419. doi: 10.1016/S0002-9440(10)62264-X. [DOI] [PMC free article] [PubMed] [Google Scholar]
- 28.Suzuki A, Ishiyama C, Hashiba K, et al. aPKC kinase activity is required for the asymmetric differentiation of the premature junctional complex during epithelial cell polarization. J Cell Sci. 2002;115:3565–3573. doi: 10.1242/jcs.00032. [DOI] [PubMed] [Google Scholar]


