Abstract
To monitor the expression of T-DNA-tagged plant genes in vivo, a collection of 20,261 transgenic lines of Arabidopsis (Columbia-0) were generated with the promoter trap vector pTluc, which carries a promoterless firefly luc (luciferase) reporter gene linked to the right T-DNA border. By detection of bioluminescence in 3-week-old seedlings, 753 lines were identified showing constitutive, organ-specific, and stress-responsive luciferase expression patterns. To facilitate the identification of well-defined luciferase expression patterns, a pooled seed stock was established. Several lines showed sugar, salt, and abscisic acid (ABA)-inducible luciferase activity. Segregation analysis of 215 promoter trap lines indicated that about 50% of plants contained single insertions, whereas 40% carried two and 10% carried three or more T-DNA tags. Sequencing the T-DNA insert junctions isolated from 17 luciferase-expressing lines identified T-DNA tags in 5′- and 3′-transcribed domains and translational gene fusions generated by T-DNA insertions in exons and introns of Arabidopsis genes. Tissue specific expression of eight wild-type Arabidopsis genes was confirmed to be similar to the luminescence patterns observed in the corresponding luciferase-tagged lines. Here, we describe the characterization of a transcriptional luc reporter gene fusion with the WBC-type ABC transporter gene At1g17840. Expression of wild-type and luciferase-tagged At1g17840 alleles revealed similar induction by salt, glucose, and ABA treatments and gibberellin-mediated down-regulation of ABA-induced expression. These results illustrate that luciferase gene traps are well suited for monitoring the expression of stress-responsive Arabidopsis genes in vivo.
Based on the availability of complete genome sequence (Arabidopsis Genome Initiative, 2000), T-DNA- and transposon-induced insertion mutations can now be identified in any Arabidopsis gene using PCR-aided mutant screening approaches and large-scale sequencing of amplified insert junctions (Bouché and Bouchez, 2001; Szabados et al., 2002). To screen for insertions in genes, several promoter and enhancer trap technologies are available that use promoterless reporter genes facing the boundaries of T-DNA or transposon insertions. Promoter trap insertions in transcribed chromosomal loci may generate in situ fusions between plant genes and reporter genes that can be easily identified by monitoring the spatial and temporal activity of reporter proteins in diverse plant organs. Transcription enhancers located in the vicinity of insert boundaries can be identified similarly by enhancer trap vectors, in which the reporter genes are linked to low-activity minimal promoters (Klimyuk et al., 1995; Campisi et al., 1999). Although enhancer trapping yields a higher frequency of in situ reporter gene activation, promoter trapping is more effective in yielding loss of function gene mutations. This is illustrated by numerous applications in fruitfly (Drosophila melanogaster) and mice (Mus musculus; O'Kane and Gehring, 1987; Allen et al., 1988; Bellen et al., 1989) and in Arabidopsis (Kertbundit et al., 1991), tobacco (Nicotiana tabacum; Teeri et al., 1986; Lindsey et al., 1993; Fobert et al., 1994), and potato (Solanum tuberosum; Lindsey et al., 1993; Springer, 2000). Because the expression of reporter genes usually faithfully reflects the expression patterns of tagged genes, the promoter and enhancer trap approaches are widely used to generate specific genetic markers for studying cell differentiation and organ development (Topping et al., 1994; Campisi et al., 1999).
The applicability of plant gene fusion technologies was first demonstrated in tobacco and Arabidopsis using a promoterless kanamycin phosphotransferase gene [aph(3′) II; Teeri et al., 1986; Koncz et al., 1989]. The use of β-glucuronidase (GUS; uidA; Jefferson et al., 1987) reporter gene provided later a sensitive means for histochemical detection of tissue and cell-type-specific expression of gene fusions (Kertbundit et al., 1991). However, the GUS reporter system is not suitable for nondestructive screening purposes. Therefore, further developments capitalized on the application of light-emitting bacterial (lux) and firefly (luc) luciferase reporter enzymes, the synthesis of which can be detected in vivo by bioluminescence imaging with sensitive CCD cameras (Riggs and Chrispeels, 1987; Riggs et al., 1989; Jiang et al., 1992). Firefly luciferase has a rapid turnover with a half-life time of 3 h; thus, it is well suited as a real-time reporter for in planta gene expression studies (Thompson et al., 1991; Millar et al., 1992). Recent identification of Ds-transposon enhancer traps in 108 tomato (Lycopersicon esculentum) lines illustrates the usefulness of luc reporter system in random gene tagging experiments (Meissner et al., 2000).
Here, we describe a T-DNA-based luc promoter trapping approach, which was used to generate a collection of 20,261 Arabidopsis insertion mutant lines. This collection was characterized by screening for luc gene fusions that show distinct expression patterns in living plants. A representative sample of active luc gene fusions was characterized by recovering the boundaries of pTluc T-DNA and identification of tagged genes driving the expression of the luc reporter gene. To illustrate the use of luc gene fusion system in the identification of specific stress-regulated genes, we have isolated several luc gene fusions that show specific induction by stress stimuli. A luc reporter-tagged stress-responsive ABC transporter gene, At1g17840, is described as a case study. ABC transporters, carrying conserved ATP-binding and trans-membrane domains, transfer molecules across the membrane against a concentration gradient, gaining energy through ATP hydrolysis (Higgins, 1992). ABC transporters play an important role in detoxification and excretion of potentially harmful compounds in eukaryotes (Henikoff et al., 1997; Higgins, 2001). Plant ABC transporters are implicated in ion channel activity, detoxification, chlorophyll biosynthesis, stomatal movement, and various aspects of plant development (Sidler et al., 1998; Gaedeke et al., 2001; Kushnir et al., 2001; see: Martinoia et al., 2002; van den Brule et al., 2002). Transcript levels of ABC transporter genes are often enhanced by chemicals that are substrates for the transporters themselves; therefore, data on expression regulation can indicate their biochemical function (del Sorbo et al., 1997; Higgins, 2001). In Arabidopsis, 129 potential ABC transporters were identified, most of them with unknown function (Sanchez-Fernandez et al., 2001; Kolukisaoglu et al., 2002). Our data show that the tagged At1g17840 gene encodes a novel stress-regulated ABC transporter of the WBC subfamily, the expression of which is regulated by sugar, salt, abscisic acid (ABA), and GA.
RESULTS
Screening for in Situ Luciferase Gene Fusions and Characterization of pTluc-Tagged Arabidopsis Collection
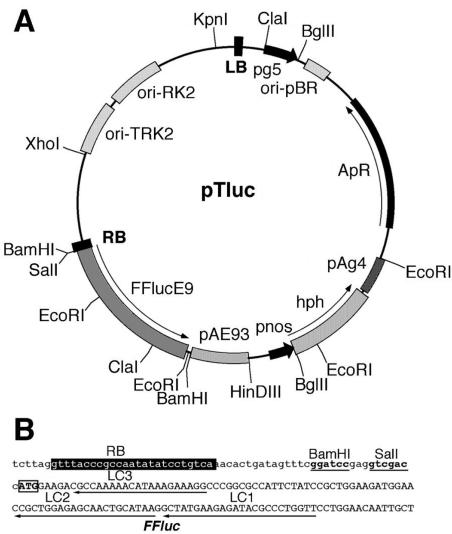
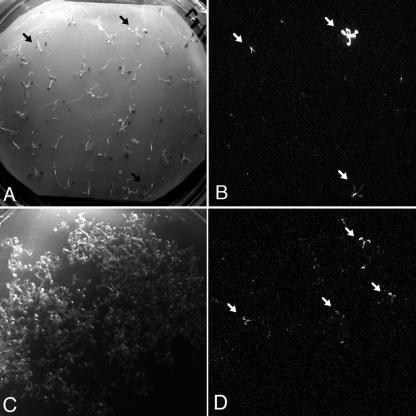
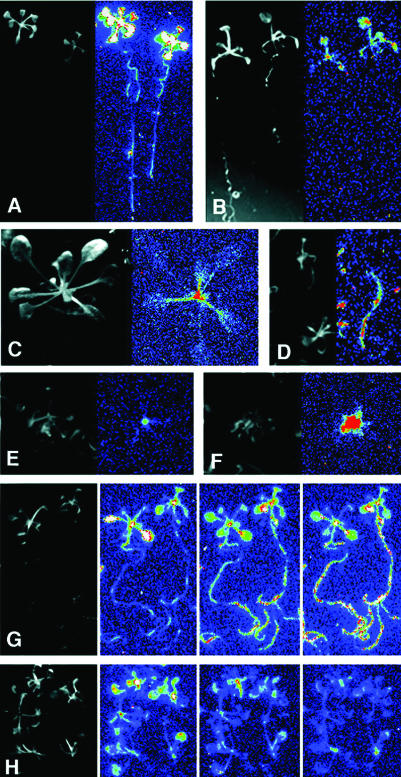
Using Agrobacterium tumefaciens-mediated transformation, 20,261 promoter trap Arabidopsis lines were generated, carrying the T-DNA of the pTLuc gene fusion vector (Fig. 1). All hygromycin-resistant T1 seedlings were screened for luciferase expression using bioluminescence imaging (Fig. 2). After recording and analysis of organ-specific luciferase expression patterns (Fig. 3), 17,000 seedlings were transferred to Murashige and Skoog Arabidopsis medium containing either 400 mm Glc or 250 mm NaCl and tested again for luciferase activity. This screen identified 38 plants displaying Glc or salt induced and 32 plants showing decreased luciferase expression. Altogether, luciferase expression was detected in 753 seedlings representing 3.7% of the whole collection.
Figure 1.
The pTluc promoter trap vector. A, Restriction map of the pTLuc vector. pg5, promoter of T-DNA gene 5; ori/pBR, replication origin from plasmid pBR322; ApR/CbR, bacterial ampicillin/carbenicillin resistance marker; pAg4, 3′ poly(A+) signal sequence of T-DNA gene4; hph, hygromycin phosphotransferase gene; pnos, nopaline synthase promoter; FFluc, firefly luciferase gene; pAE93, 3′ polyA region of gene E93. B, Sequence of the right border (RB) region. Position of the T-DNA RB is shown by white letters on black background. Sequences of BamHI and SalI restriction sites are underlined. ATG of the FFLuc reporter gene is boxed. The position of oligonucleotides LC1, LC2, and LC3 is indicated by arrows.
Figure 2.
Identification of luciferase gene fusions in the pTluc-transformed Arabidopsis population. A, Light image of 45 screened T1 seedlings. B, Luminescence image of the screened plants. Different patterns of luciferase activity are detectable in three plants. C, Identification of a luciferase gene fusion in pooled seed stocks. Image of 500 screened seedlings. D, Detection of luminescence in the pooled seedlings.
Figure 3.
Examples for characteristic luciferase expression patterns in tagged Arabidopsis plants. Images show 3- to 4-week-old plants in light (left) and the corresponding luminescence pattern (right). Colors correspond to increasing luminescence intensity in the following order: blue < green < yellow < red < white. Luminescence patterns: A, constitutive (L3033); B, all green organs (L0213); C, petioles and shoot tip (L6180); D, root (L6318); E, shoot apex (L6331); and F, young leaves (L6365). G and H, Salt-responsive luciferase activity in T2 plants, which were challenged by high-salt medium. Luminescence was recorded at 0, 2, and 6 h after transfer. G, Salt-induced luminescence in roots (L1518). H, Salt-repressed luminescence (L6177).
After harvesting T2 progeny from all individual plants, seed stocks were prepared by pooling equal amount of seed from 100 individual T2 families. The screening conditions were optimized by germinating 10-mg aliquots of seed stocks at a density of about 500 seedlings per Petri dish and monitoring the frequency of seedlings displaying similar luminescence patterns in each pool (Fig. 2).
To characterize the collection, the segregation of hygromycin resistance marker and luciferase expression pattern was determined in 215 promoter trap lines (see supplemental data, available in the online version of this article at http://www.plantphysiol.org). The hygromycin resistance marker showed 3:1 segregation ratio in 108 lines, whereas 15:1 segregation in 85 lines suggested the presence of two independent T-DNA inserts. The remaining 22 lines displayed a segregation of three or more independent inserts. In lines that carried single inserts, the luciferase expression always cosegregated with the hygromycin resistance marker (data not shown). Hygromycin-resistant T2 progeny of the selected 215 lines was recurrently subjected to image analysis. Luciferase expression patters detected in the original T1 lines were reproducibly observed in the hygromycin-resistant progeny (Table I; for details, see supplemental data). In 22 lines, luminescence was observed in all organs, whereas in 64 lines, a similar pattern was found without detectable expression in the roots. Luciferase activity was predominant in shoot apical region of 73 lines, sometimes accompanied by faint luminescence in hypocotyls or petioles. Luminescence was strongest in stem tissues of 21 lines, in leaves of 32 lines, and in hypocotyls of three lines. Responses to high sugar (400 mm Glc), salt (250 mm NaCl), or cold (4°C) were tested by transferring plants to germination media supplemented with Glc or salt or by incubating plants at 4°C for 6 to 8 h. Stress-responsive luciferase activity could be confirmed in 24 lines, showing enhanced (15 lines) or reduced (nine lines) luminescence in response to one or several treatments. Examples for such analysis are shown in Figure 3, and features of analyzed lines are depicted in the supplemental data.
Table I.
Luciferase expression patterns in tagged Arabidopsis lines
Luciferase activity of in vitro germinated 3-week-old T2 plants was analyzed in 215 selected lines by low-light imaging.
| Luminescence Pattern | Lines | % |
|---|---|---|
| All organs | 22 | 9.8 |
| Green organs | 64 | 30.2 |
| Leaf | 32 | 14.9 |
| Shoot tip | 73 | 34.0 |
| Stem | 21 | 9.8 |
| Hypocotyl | 3 | 1.4 |
| Total | 215 | 100 |
| Stress induced | 15 | — |
| Stress suppressed | 9 | — |
Isolation and Characterization of Luciferase Gene Fusions
To analyze the molecular structure of luc gene fusions, we have isolated the right T-DNA insert boundaries from 17 T2 families, which displayed diverse organ-specific luciferase expression patterns, using inverse PCR and Thermally Interlaced (TAIL)PCR. Sequencing the T-DNA insert junctions localized 5′ upstream of the luc reporter gene allowed a precise localization of all insertions in the Arabidopsis genome by performing Blast homology searches using The Arabidopsis Information Resource (TAIR) database. T-DNA inserts were identified in exons and introns of eight Arabidopsis genes, providing examples for both translational and transcriptional gene fusions (Koncz et al., 1989, 1994). In five lines, the T-DNA insertions landed in predicted promoter and 5′-UTRs of genes illustrating promoter trap events and formation of transcriptional gene fusions. In three lines, the luc reporter gene was localized in 3′ transcribed but UTRs of genes. Only in one case was the luc gene tag localized in a distance larger than 500 bp upstream of a predicted gene, suggesting that the annotation of corresponding genomic sequence was either incorrect, or an unknown cryptic promoter led to luc gene activation (Table II).
Table II.
Sequenced Iuciferase gene fusions in 17 Arabidopsis lines
Positions of T-DNA insertions are shown in relation to the predicted ATG or STOP codons.
| Code | Luminescence | Insertion | Gene | Predicted function |
|---|---|---|---|---|
| L0202 | Green organs | Promoter, —183 bp | At1g01400 | Putative UTP-Glc glucosyltransferase |
| L0211 | Green organs | 3′-Untranslated region (UTR), +54 bp | At5g20380 | Putative inorganic phosphate cotransporter |
| L0213 | Green organs | 5′-Untranslated region (UTR), —190 bp | At1g17840 | Putative ABC transporter |
| L0264a | Green organs | 3′-Untranslated region (UTR), +157 bp | AT4g25200 | Mitochondrion-localized small heat shock protein |
| L0264b | Green organs | Intron 1, 649 bp | At2g39190 | Putative ABC transporter |
| L0266 | Shoot tip | Intron 1,783 bp | At1g08390 | YABBY2 protein (2 × transmembrane segment) |
| L0267 | All organs | Intron 3, 995 bp | At3g20000 | Putative membrane import protein, TOM40 homolog |
| L0268 | Shoot tip, stem | Promoter, —490 bp | F5E6.8 | Hypothetical protein |
| L0610 | Green organs | Intron, 142 bp | At1g56045 | 60s Ribosomal protein L41 |
| L1518 | All organs | Intron, 905 bp | At1g36035 | Putative gag-protease polyprotein |
| L1529 | Shoot tip | 3′ Region, +274 bp | At2g44270 | Hypothetical protein |
| L1538 | All organs | Exon, 1,481 bp | T21E2.5 | Putative dTDP-D-Glc 4,6-dehydratase |
| L1551R | Leaf | Exon, 1,713 bp | At4g35260 | NAD+-dependent isocitrate dehydrogenase subunit 1 |
| L1571L | Shoot tip | Promoter, —128 bp | At1g12830 | Peroxisomal targeting signal type 2 receptor |
| L3033 | All organs | 5′ Region, —971 bp | At2g01010 | 1 8S ribosomal RNA |
| L3051 | Constitutive | Intron 20, 4,944 bp | At1g17690 | Hypothetical protein |
| L3067 | Leaf | Promoter, —219 bp | At3g05760 | Hypothetical protein |
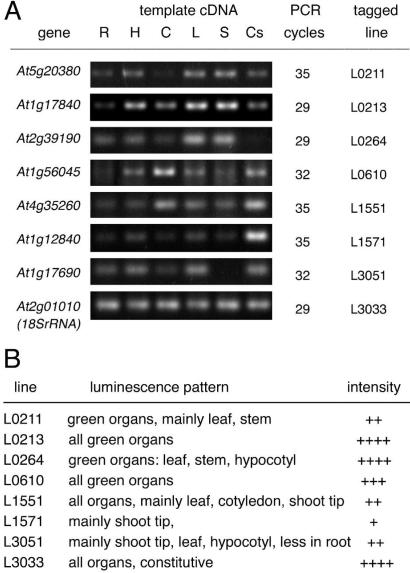
To test whether the expression of luciferase gene fusion precisely reflects the regulation of wild-type alleles of tagged genes, reverse transcription (RT)PCR analysis of eight such genes was performed (Fig. 4). RNA was prepared from leaf, cotyledon, hypocotyl, root, and stem of in vitro-germinated plants and from cell suspension cultures. Cell cultures are composed of dividing cells and, therefore, are similar to meristematic regions. cDNA templates obtained by RT were used as templates in RT-PCR reactions. RT-PCR analysis of the 18SrRNA gene At2g01010 showed constitutive expression and served as a loading marker. T-DNA insertion was localized in the 5′ region of the At2g01010 gene in line L3033, which showed luciferase expression in all tested organs (Fig. 3A). RT-PCR analysis of the other genes revealed tissue-specific alterations in the transcript levels, which were similar to differences observed in luminescence activities of corresponding tagged lines (Fig. 4).
Figure 4.
Expression analysis of eight Arabidopsis genes. A, Total RNA was isolated from root (R), hypocotyl (H), cotyledon (C), leaf (L), and stem (S) tissues of 3-week-old in vitro-germinated plants and cell suspension cultures (Cs). RT-PCR was performed on equal amount of cDNA templates, using gene-specific primer pairs. PCR fragments are shown after 29 to 35 cycles of amplification. Strong expression levels required lower amplification cycles, whereas more cycles are needed to amplify fragments from low-abundance transcripts. 18SrRNA gene (At2g01010) was used as constitutive control. B, Luminescence pattern and intensity in the tested Arabidopsis lines. Approximate light intensities are shown in arbitrary scale from low (+) to high (++++).
Identification of a Novel Stress-Responsive ABC Transporter
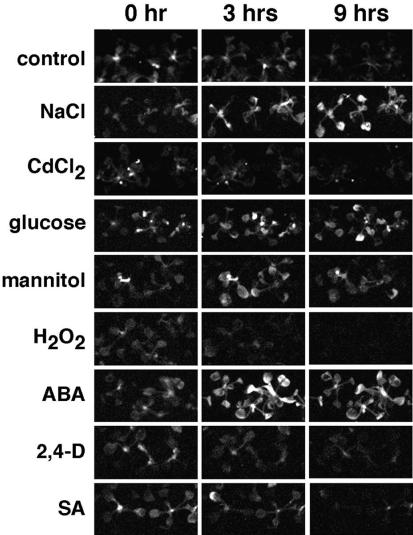
To study a stress-responsive luciferase gene fusion, we performed a detailed analysis of line L0213, which showed salt-inducible luciferase expression in our initial screen. In L0213 plants, luminescence was detected in all tissues except for roots (Fig. 3B). Cosegregation of luciferase activity and hygromycin resistance was tested in 112 T2 plants. Eighty-five plants displayed luminescence and proved to be hygromycin resistant, whereas 27 plants showing no detectable luminescence were hygromycin sensitive. In addition to salt, the expression of single-copy luc gene fusion in line L0213 was also inducible by Glc, mannitol, and ABA treatments (Fig. 5). The tagged gene thus appeared to be controlled by an ABA-dependent regulatory pathway in response to osmotic stress. H2O2 repressed luciferase activity, whereas heavy metals, such as CdCl2, and other hormones, including 2,4-D and salicylate, had no apparent effect on the expression of the luc reporter gene (Fig. 5).
Figure 5.
Stress- and hormone-responsive luciferase activity in line L0213. Three-week-old plants were transferred to media supplemented by following additives: 250 mm NaCl, 1 mm CdCl2, 400 mm Glc, 400 mm mannitol, 8 mm hydrogen peroxide (H2O2), 50 μm ABA, 1 μm 2,4-dichlorophenoxyacetic acid (2,4-D), and 1 μm salicylic acid. Luminescence was recorded in multiple time points and is shown here after 0, 3, and 9 h of treatments.
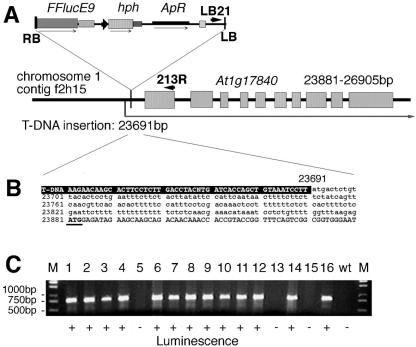
PCR amplification and sequencing of the right T-DNA insert boundary indicated that the insertion in line L0213 occurred 190 bp upstream of the ATG codon in the 5′-transcribed leader region of a putative gene, At1g17840, located in the F2H15 contig of chromosome 1 (Fig. 6). Thus, the sequence analysis indicated that the insertion event resulted in the formation of a transcription gene fusion between the promoterless luc gene and the 5′-UTR of gene At1g17840. According to gene prediction of TAIR, the At1g17840 gene encodes a putative ABC transporter protein of 703 amino acids. The predicted ABC transporter carries a conserved nucleotide-binding domain at position 59 to 259 and six trans-membrane domains between amino acid residues 401 and 648. RT-PCR analysis showed that the luciferase activity of line L0213 faithfully reflects the expression of At1g17840 gene because it is high in most tested organs except in roots, where transcript level proved to be very low (Fig. 4).
Figure 6.
Mapping and segregation of T-DNA insertion in line L0213. A, T-DNA insertion is located in chromosome 1, at 23,691 bp of contig f2H15, in the 5′-UTR of gene At1g17840. Exon-intron structure of the At1g17840 gene, position, and structural elements of the pTluc insert are indicated. Position of LB and gene-specific PCR primers (LB21 and 213R, respectively) are shown by arrowheads. B, Sequence of the T-DNA and plant DNA junction. Left border (LB) sequence of the T-DNA is shown by white letters on black background. Sequence of 5′-UTR is indicated by lowercase, and the first exon is shown by capital letters. The predicted ATG codon is underlined. C, Segregation of the T-DNA insert and luminescence in 16 independent T2 plants. Test PCR was performed using genomic DNA isolated from individual plants and combination of gene-specific (213R) and T-DNA-specific (LB21) primers. M, DNA size marker; 1 to 16, amplification of 760-bp PCR fragment in independent T2 plants; wt, wild type Columbia-0 plant. Plants 5, 13, and 15 had no luciferase activity and produced only hygromycin-sensitive progeny. All the other plants showed luminescence.
To identify homozygous knockout lines, 16 T2 families were analyzed by PCR amplification using gene- and T-DNA-specific primers (Fig. 6). PCR fragment could not be amplified with the combination of gene-(213R) and T-DNA-(LB21) specific primers in three plants, which showed no luciferase activity. All 13 plants, which carried the amplified T-DNA insert junction of 750 bp, also showed luminescence. From these, four lines proved to be homozygous and nine hemizygous in germination assays on hygromycin-containing medium. The homozygous plants showed no morphological and developmental alterations in comparison with hemizygous and wild-type control lines. In germination assays, differences were not observed in hormone sensitivity (2,4-D, kinetin, ABA, GA3, and salicylic acid) nor in stress responses (NaCl, mannitol, Glc, H2O2, CdCl2, and paraquat; data not shown).
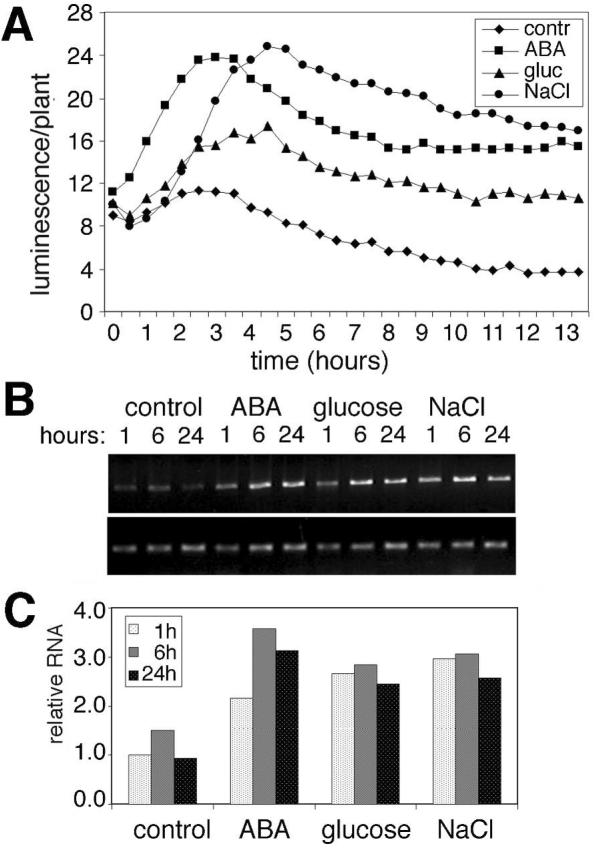
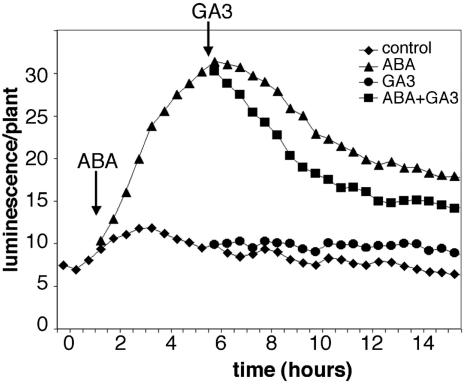
To compare the regulation of luc-tagged and wild-type At1g17840 alleles, the temporal expression of luciferase reporter and steady-state levels of wild-type At1g17840 mRNA were tested in 3-week-old heterozygous T2 plants. Plants grown on MSAR medium were transferred to fresh medium containing 250 mm NaCl, 400 mm Glc, or 50 μm ABA (Fig. 7). Transferring the plants into new medium resulted in a slight transient increase in luciferase activity within 2 to 3 h, followed by a gradual, steady decline. In response to Glc and salt treatment, luciferase activity was induced three to four times and reached a peak 4 to 5 h after transfer. In ABA-treated plants, maximum luminescence was detected in 2 to 3 h. To compare the luciferase activity with transcriptional regulation of the endogenous At1g17840 gene, RTPCR analysis was performed with ubiquitin as internal control. Two to 4 times increase of At1g17840 transcription was detected upon Glc, salt, or ABA treatments (Fig. 7). Although some differences were observed between the kinetics of stress induction of luciferase-tagged and wild-type At1g17840 alleles, nonetheless, the RT-PCR assays confirmed that the At1g17840 gene is activated by the same stimuli, as was indicated by the nondestructive luciferase assays. Therefore, analysis of expression of luciferase gene fusions can provide useful information for further studies. This is illustrated by an additional assay performed with the luc-tagged At1g17840 gene, where sequential treatments were employed to monitor hormonal responses of this gene. T2 plants were sprayed by 100 μm ABA and subsequently by 100 μm GA3. Luciferase activity increased 4-fold after ABA treatment, which could be down-regulated by subsequent GA treatment (Fig. 8). Because GA3 treatment alone had no significant effect on luciferase activity, these results suggested that GA is a negative regulator of ABA-induced At1g17840 gene expression.
Figure 7.
Analysis of At1g17840 expression. A, Kinetics of salt, sugar, and ABA-responsive luciferase expression in line L0213. Three-week-old plants were transferred to MSAR media containing 250 mm NaCl, 400 mm Glc, or 50 μm ABA, and luminescence was recorded in 30-min intervals. B, RT-PCR analysis of At1g17840 expression. Total RNA was isolated from 3-week-old plants treated with 250 mm NaCl, 400 mm Glc, or 50 μm ABA for 1, 6, or 24 h. Equal amounts of cDNA templates were used for PCR amplification of gene-specific fragments using primers L213A and L213B. Upper row, At1g17840-specific PCR fragments are shown after 29 cycles of amplification (ABC). Lower row, PCR fragments corresponding to the ubiquitin 10 gene are shown after 23 cycles (UBI). C, Quantification of the PCR analysis. Average values of three measurements were normalized to control RNA.
Figure 8.
Effect of sequential ABA and GA treatments on luciferase activity of line L0213. Two-week-old plants were sprayed by 100 μm ABA and 5 h later by 100 μm GA3 (see arrows). ABA-responsive activation of At1g17840::luc gene fusion could be repressed by GA3.
DISCUSSION
The Luciferase Gene Fusion System
Using a T-DNA-based luc gene fusion vector, we have generated an Arabidopsis insertion mutant collection, which consists of 20,261 transgenic lines. Segregation analysis indicates that about one-half of these lines carry single T-DNA insertions and that the average copy number of T-DNA tags is 1.6 in the collection. These data predict that the collection carries altogether about 32,000 T-DNA inserts. Random sequencing of T-DNA insert junctions in other collections indicates that about 35% of all inserts are located in exons and introns, whereas about 20% of T-DNA tags are found in 5′- and 3′-regulatory regions of genes within 300 bp from the predicted ATG or STOP codons, respectively (Szabados et al., 2002). Gene fusions are only generated when the polarity of promoterless reporter gene within the T-DNA and the tagged plant genes is identical, whereas for formation of translation gene fusions, the reporter gene should be fused to plant genes in frame. Therefore, the calculated maximum frequency of translation gene fusions in coding regions is: 0.5 × 0.33 × 0.35 = 0.058 (i.e. 5.8% of all inserts), whereas the predicted maximal frequency of inserts in 5′- and 3′-regulatory regions of genes is 0.5 × 0.2 = 0.1 (i.e. 10% of all inserts). In our experiments, active luc gene fusion was detected in 753 T1 plants, which represent 3.7% of the population and 15% of the calculated frequency of gene fusions. The frequency of luc-expressing lines is lower than the previously reported GUS-expressing enhancer and promoter trap lines (Kertbundit et al., 1991; Campisi et al., 1999; He et al., 2001). Because we screened only in vitro-germinated seedlings, it is likely that our collection contains additional lines that exhibit luminescence in other developmental stages or in different environmental conditions. Furthermore, we used only macroscopic detection, which measures low light intensities in living tissues. Gene fusions that are expressed at very low level or are active only in a few cells could have escaped detection due to limitations in sensitivity and resolution of our luciferase assay system. In comparison, microscopic observation of GUS-based histochemical staining is more sensitive, if the screening aims the detection of gene fusions that are active in few cells (Topping et al., 1994; Sundaresan et al., 1995; Campisi et al., 1999; He et al., 2001). The identification of genes responding to nematode infection using a GUS promoter trap illustrates that this system is suited for identification of conditionally expressed cell-type-specific genes as well (Barthels et al., 1997). Because the end product of the β-glucuronidase histochemical reaction is toxic for plant cells, the GUS reporter gene is not, however, optimal for studying regulated gene expression in living organisms. In contrast, the main advantage of the firefly luciferase reporter gene system is that the activity of gene fusions can be detected by bioluminescence imaging in living tissues (Riggs and Chrispeels, 1987; Millar et al., 1992). An important application of luciferase gene trapping is the identification of conditionally regulated plant promoters and creation of molecular markers for the analysis of specific environmental and hormonal responses. Our results demonstrate that the luciferase reporter system can be exploited for identification and tagging of genes, the expression of which is positively or negatively regulated by sugar, salt, ABA, and osmotic stress signaling. To facilitate public screening of pTluc-tagged Arabidopsis collection, we have created seed stocks from each of 100 lines and performed a proof of concept study to screen for luc-gene fusions that are regulated by external stimuli.
It is widely accepted that the activity of gene traps faithfully reflects transcriptional regulation of tagged genes (Smith and Fedoroff, 1995; Vielle-Calzada et al., 2000). However, several examples show that cryptic promoters located in intergenic regions could also activate gene traps (Fobert et al., 1994; Ökrész et al., 1998). In our experiments, sequencing of T-DNA insert junctions indicated that in 16 of 17 cases. the T-DNA integration events resulted in the formation of genuine transcription or translation fusions with the luciferase reporter gene. Only one pTluc T-DNA insertion was localized far from a predicted gene, suggesting that the analysis of gene fusions may identify unknown regulatory sequences in the Arabidopsis genome or point to problems resulting from incomplete annotation of Arabidopsis genes. Comparison of the luciferase expression patterns and transcriptional activity of the corresponding wild-type endogenous genes showed that luminescence could be detected only in those organs where the endogenous gene has abundant transcript levels. Differences in luciferase activity in general corresponded to alterations in tissue-specific expression. Therefore, the firefly luciferase can be considered a suitable reporter gene for gene trapping and in vivo expression studies.
Tagging of Stress-Regulated Genes. A Case Study
Our data indicate that the luciferase reporter gene is well suited to identify in situ gene fusions that are regulated by external stimuli. In our experiments, about 8% of active luc gene fusions respond positively or negatively to Glc and salt stress. Thus, further analysis of these luc-gene fusions will provide useful tools to gain more insight into interactions between sugar, ABA, and osmotic stress signaling pathways (Gazzarini and McCourt, 2001; Xiong and Zhu, 2001).
To compare the regulation of luc-tagged mutant and wild-type alleles of a stress-regulated gene, we have characterized in detail a mutant line, L0213, that carries a luc-tag in a stress-responsive ABC transporter gene. The tagged At1g17840 gene encodes a WBC-type transporter with one ABC domain and six trans-membrane domains. Thus, according to the classification of Higgins (1992), the protein encoded by At1g17840 belongs to the “half size” transporter group. After confirmation of cosegregation of luminescence and T-DNA-encoded hygromycin resistance marker, we have examined the regulation of the luc-tagged At1g17840 allele. Analysis of temporal regulation of luciferase expression indicated that the tagged gene is inducible by Glc, salt, and ABA. These properties of the At1g17840 gene are similar to those of the SpTUR2 gene, which encodes a PDR-type ABC transporter in the water plant Spiradella polyrrhiza (Smart and Fleming, 1996). Remarkably, ABA induction of the At1g17840 gene was found to be down-regulated by GA, suggesting that stress-regulated expression of At1g17840 in shoots is also controlled by GA signaling. Comparative analysis of steady-state At1g17840 mRNA accumulation qualitatively confirmed the observations made by the analysis of expression of the luc-tagged allele. These results indicate that the analysis of luc gene fusion patterns can be supported by confirmatory studies using the corresponding wild-type alleles. Therefore, the use of luc gene fusions can provide a facile means for identification of specifically regulated genes in conjunction with identification of corresponding insertion mutations.
MATERIALS AND METHODS
Vector Construction
To construct the pTluc promoter-trapping vector, an XhoI-HindIII fragment from the pSKFFlucE9 plasmid (kind gift of Ferenc Nagy, BRC, Szeged, Hungary) was inserted into the BamHI-HindIII sites of the pTgus vector (Koncz et al., 1994). pTluc carries a promoterless firefly luciferase gene, FFlucE9, in the vicinity of the right T-DNA border sequence to facilitate nondestructive screening for in planta luc gene fusions (Fig. 1). The T-DNA of pTluc carries a hygromycin resistance gene (pnos:hph:pAg4) for selection of transgenic plants, an ampicillin/carbenicillin (Ap/Cb) resistance gene as bacterial selectable marker, and a pBR322 replication origin to enhance the recovery of insertions by plasmid rescue. The pTluc vector was introduced into Agrobacterium tumefaciens GV3101 carrying the pMP90RK helper plasmid and used for Arabidopsis transformation as described (Koncz and Schell, 1986).
Plant Transformation and Screening for Activation of Luciferase Reporter
Arabidopsis (Columbia-0) was used for all experiments. A. tumefaciens-transformed Arabidopsis lines were generated by in planta transformation using vacuum infiltration (Bechtold and Pelletier, 1998). Seeds from infiltrated plants were germinated on selective MSAR seed medium containing 15 mg L-1 hygromycin (Koncz et al., 1994). Three-week-old hygromycin-resistant seedlings were transferred into petri dishes (13-cm diameter, 80-100 seedlings/plate), sprayed with 2 mm d-luciferin solution (Biosynth AG, Staad, Switzerland), and assayed for luciferase activity using low light imaging with a CCD camera system (Visilux Imager, Visitron Systems GmbH, Puchheim, Germany). Bioluminescence images were processed using the Metaview 4.5r6 software (Universal Imaging Corporation, Downingtown, PA). To screen for stress-induced luc gene fusions, seedlings were transferred to MSAR medium supplemented with either 400 mm Glc or 250 mm NaCl, and the increase in luminescence was monitored 6 to 8 h later. Plantlets showing light emission were individually registered. After bioluminescence imaging, all seedlings were planted in soil and brought to maturity to obtain T2 seeds. Pooled seed stocks were prepared by mixing 200 mg of T2 seeds from 100 transgenic lines. To screen for luciferase-expressing plants, 10 mg of pooled seeds was surface sterilized, germinated, grown for 2 weeks in petri dishes on MSAR medium, and subjected to luminescence imaging as described above.
Measurement and Analysis of Kinetics of Luciferase Activation
Temporal activation of the luc reporter was characterized by sequential recording of bioluminescence images. Three-week-old seedlings were sprayed with 2 mm d-luciferin solution and transferred to germination medium supplemented by 50 μm ABA, 400 mm Glc, or 250 mm NaCl. Luminescence of 20 seedlings from each T2 family was recorded in each experiment every 30 min for at least 12 h. Images were analyzed using the Metaview 4.5r6 software and processed in Microsoft Excel worksheets (Microsoft, Redmond, WA). Each experiment was repeated three times.
Sequencing of T-DNA Insert Junctions
DNA fragments flanking the T-DNA insertions were amplified from purified plant DNA samples using either long-range inverse PCR or TAIL-PCR as described (Mathur et al., 1998; Szabados et al., 2002). Long-range inverse PCR was performed with DNA templates that were previously digested by EcoRI and self-ligated. Nucleotide sequence of the gel-purified PCR fragments was determined using nested sequencing primers (Table I). The positions of T-DNA insertions in the Arabidopsis genome were determined by BLAST homology searches using TAIR's database (http://www.arabidopsis.org).
RT-PCR Analysis of Steady-State mRNA Levels
RNA samples were isolated from 3-week-old seedlings as described (Pawlowski et al., 1994). cDNA templates were prepared using 1 μg of RNA and an RT-PCR kit (CLONTECH Laboratories, Palo Alto, CA) according to the supplier's instructions. RT-PCR reactions were performed in 50-μL volume using 2 μL of cDNA template and 0.2 μm each of forward and reverse primers (Table III). The PCR conditions were 94°C for 2 min, 35 cycles of 94°C for 30 s, 60°C for 30 s, and 72°C for 30 s. Five-microliter aliquots of PCR products were withdrawn after 23, 26, 29, 32, and 35 cycles and separated on 1.2% (w/v) agarose gels. The intensities of ethidium bromide-stained bands were determined using the NIH Image 1.63 software (National Institutes of Health, Bethesda, MD).
Table III.
Oligonucleotides used for PCR amplification and sequencing
| Name | Sequence | Purpose |
|---|---|---|
| LC1 | 5′-AACCAGGGCGTATCTCTTCATAGC-3′ | TAIL-PCR or iPCR at RB |
| LC2 | 5′-TTATGCAGTTGCTCTCCAGCGG-3′ | TAIL-PCR or iPCR at RB |
| LC3 | 5′-CCTTTCTTTATGTTTTTGGCG-3′ | Sequencing at RB |
| LCE | 5′-TTTGTACCAGAGTCCTTTGATCGTG-3′ | iPCR at RB, used with LC1 |
| LB11 | 5′-CAGACCAATCTGAAGATGAAATGGGTATCTGGG-3′ | TAIL-PCR or iPCR at LB |
| LB21 | 5′-GTGAAGTTTCTCATCTAAGCCCCCATTTGG-3′ | TAIL-PCR or iPCR at LB |
| LB41 | 5′-TTCTCCATATTGACCATCATACTCATTGC-3′ | Squencing at LB |
| PB | 5′-CACATTTCCCCGAAAAGTGCCACCTGACG-3′ | iPCR at LB, used with LB21 |
| 213R | 5′-CAGCGAGGCGGCTAGCTA-3′ | L213 line segregation test |
| L0211A | 5′-AAGGGTTAAGTGCTCCGCCA-3′ | RT-PCR, At5g20380 forward |
| L0211B | 5′-ACCAACCCAGCCACAGATGA-3′ | RT-PCR, At5g20380 reverse |
| L0213A | 5′-GAGATGGAGATAGAAGCAAGCAG-3′ | RT-PCR At1g17840 forward |
| L0213B | 5′-TTGCGGCCGTTAAGAAGAA-3′ | RT-PCR At1g17840 reverse |
| L0264A | 5′-TCGCCGTTGCTGAGTTGAGA-3′ | RT-PCR At2g39190 forward |
| L0264B | 5′-AGGAAGGCTGAGGCCAAGAT-3′ | RT-PCR At2g39190 reverse |
| L0610A | 5′-CAACAACAAGAACAATGAGAGC-3′ | RT-PCR At1g56045 forward |
| L0610B | 5′-AGATAAGAGCACAAGAGCAAGT-3′ | RT-PCR At1g56045 reverse |
| L1551A | 5′-AACGCCGTGGAACAGGTGAT-3′ | RT-PCR At4g35260 forward |
| L1551B | 5′-ACCAGGAACAACCTCGTGCT-3′ | RT-PCR At4g35260 reverse |
| L1571A | 5′-TAATCGGCGATGTTGGAGCTGA-3′ | RT-PCR AT1G12830 forward |
| L1571B | 5′-TCGTTGACATGGCGGTTACTGA-3′ | RT-PCR AT1G12830 reverse |
| L3033A | 5′-AGGCGCGCAAATTACCCAAT-3′ | RT-PCR At2g01010 forward |
| L3033B | 5′-TCTTCAAAGTAACAGCGCCGGA-3′ | RT-PCR At2g01010 reverse |
| L3051A | 5′-ACCATTGTGGCTCTGACGAAGA-3′ | RT-PCR At1g17690 forward |
| L3051B | 5′-ACAACGCGAAAGGCAATGCT-3′ | RT-PCR At1g17690 reverse |
Distribution of Materials
All novel materials described in this publication are available for noncommercial research purposes. Obtaining any permissions will be the responsibility of the requestor.
Supplementary Material
Acknowledgments
The authors are grateful for the excellent technical assistance of Mónika Gál and Anikó Bíró and thank Drs. László Márton and László Bakó for valuable discussions and critical reading of the manuscript.
This research was supported by the European Union Fifth Framework Program (Growth Vigour and Development, no. QLK5-CT-2001-01871), by Országos Tudományos Kutatási Alap (grant no. T038375), by Oktatási Miniszténum Biotechnologia2001 (grant no. BIO-00118/2001), and by the Hungarian-German Cooperation program Tudományos és Technológiai Alapítvány (grant no. D-2/01).
The online version of this article contains Web-only data.
References
- Allen ND, Cran DG, Barton SC, Hettle S, Reik W, Surani MA (1988) Transgenes as probes for active chromosomal domains in mouse development. Nature 333: 852-855 [DOI] [PubMed] [Google Scholar]
- Arabidopsis Genome Initiative (2000) Analysis of the genome sequence of the flowering plant Arabidopsis thaliana. Nature 408: 796-815 [DOI] [PubMed] [Google Scholar]
- Barthels N, Van der Lee FM, Klap J, Goddijn OJ, Karimi M, Puzio P, Grundler FM, Ohl SA, Lindsey K, Robertson L et al. (1997) Regulatory sequences of Arabidopsis drive reporter gene expression in nematode feeding structures. Plant Cell 9: 2119-2134 [DOI] [PMC free article] [PubMed] [Google Scholar]
- Bechtold N, Pelletier G (1998) In planta Agrobacterium-mediated transformation of adult Arabidopsis thaliana plants by vacuum infiltration. Methods Mol Biol 82: 259-266 [DOI] [PubMed] [Google Scholar]
- Bellen HJ, O'Kane CJ, Wilson C, Grossniklaus U, Pearson RK, Gehring WJ (1989) P-element-mediated enhancer detection: a versatile method to study development in Drosophila. Genes Dev 3: 1288-1300 [DOI] [PubMed] [Google Scholar]
- Bouché N, Bouchez D (2001) Arabidopsis gene knockout: phenotypes wanted. Curr Opin Plant Biol 4: 111-117 [DOI] [PubMed] [Google Scholar]
- Campisi L, Yang YZ, Yi Y, Heilig E, Herman B, Cassista AJ, Allen DW, Xiang HJ, Jack T (1999) Generation of enhancer trap lines in Arabidopsis and characterization of expression patterns in the inflorescence. Plant J 17: 699-707 [DOI] [PubMed] [Google Scholar]
- del Sorbo G, Andrade AC, Van Nistelrooy JG, Van Kan JA, Balzi E, De Waard MA (1997) Multidrug resistance in Aspergillus nidulans involves novel ATP-binding cassette transporters. Mol Gen Genet 254: 417-426 [DOI] [PubMed] [Google Scholar]
- Fobert PR, Labbe H, Cosmopoulos J, Gottlob-McHugh S, Ouellet T, Hattori J, Sunohara G, Lyer VN, Miki BL (1994) T-DNA tagging of a seed-coat-specific cryptic promoter in tobacco. Plant J 6: 567-577 [DOI] [PubMed] [Google Scholar]
- Gaedeke N, Klein M, Kolukisaoglu U, Forestier C, Müller A, Ansorge M, Becker D, Memmun Y, Kuchler K, Schulz B et al. (2001) The Arabidopsis thaliana ABC transporter AtMRP5 controls root development and stomatal movement. EMBO J 20: 1875-1887 [DOI] [PMC free article] [PubMed] [Google Scholar]
- Gazzarini S, McCourt P (2001) Genetic interactions between ABA, ethylene and sugar signaling pathways. Curr Opin Plant Biol 4: 387-391 [DOI] [PubMed] [Google Scholar]
- He YH, Tang WN, Swain JD, Green AL, Jack TP, Gan SS (2001) Networking senescence-regulating pathways by using Arabidopsis enhancer trap lines. Plant Physiol 126: 707-716 [DOI] [PMC free article] [PubMed] [Google Scholar]
- Henikoff S, Greene EA, Pietrokovski S, Bork P, Attwood TK, Hood L (1997) Gene families: the taxonomy of protein paralogs and chimeras. Science 278: 609-614 [DOI] [PubMed] [Google Scholar]
- Higgins CF (1992) ABC transporters: from microorganism to man. Annu Rev Cell Biol 8: 67-113 [DOI] [PubMed] [Google Scholar]
- Higgins CF (2001) ABC transporters: physiology, structure and mechanism: an overview. Res Microbiol 152: 205-210 [DOI] [PubMed] [Google Scholar]
- Jefferson RA, Kavanagh TA, Bevan MW (1987) GUS fusions: β-glucuronidase as a sensitive and versatile gene fusion marker in higher plants. EMBO J 6: 3901-3907 [DOI] [PMC free article] [PubMed] [Google Scholar]
- Jiang C, Langridge WHR, Szalay AA (1992) Identification of genes in vivo by tagging with T-DNA border linked luciferase genes followed by inverse polymerase chain reaction amplification. Plant Mol Biol Rep 10: 345-361 [Google Scholar]
- Kertbundit S, De Greve H, Deboeck F, Van Montagu M, Hernalsteens JP (1991) In vivo random beta-glucuronidase gene fusions in Arabidopsis thaliana. Proc Natl Acad Sci USA 88: 5212-5216 [DOI] [PMC free article] [PubMed] [Google Scholar]
- Klimyuk VI, Nussaume L, Harrison K, Jones JDG (1995) Novel gus expression patterns following transposition of an enhancer trap DS element in Arabidopsis. Mol Gen Genet 249: 357-365 [DOI] [PubMed] [Google Scholar]
- Kolukisaoglu HU, Bovet L, Klein M, Eggmann T, Geisler M, Wanke D, Martinoia E, Schulz B (2002) Family business: the multidrug-resistance related protein (MRP) ABC transporter genes in Arabidopsis thaliana. Planta 216: 107-119 [DOI] [PubMed] [Google Scholar]
- Koncz C, Martini N, Mayerhofer R, Koncz-Kalman Z, Korber H, Redei GP, Schell J (1989) High-frequency T-DNA-mediated gene tagging in plants. Proc Natl Acad Sci USA 86: 8467-8471 [DOI] [PMC free article] [PubMed] [Google Scholar]
- Koncz C, Martini N, Szabados L, Hrouda M, Bachmair A, Schell J (1994) Specialized vectors for gene tagging and expression studies. In SB Gelvin, RA Schilperoort, DPS Verma, eds, Plant Molecular Biology Manual, Vol 2. Kluwer Academic Publishers, Dordrecht, The Netherlands, pp B1-22 [Google Scholar]
- Koncz C, Schell J (1986) The promoter of the TL-DNA gene 5 controls the tissue-specific expression of chimaeric genes carried by a novel type of Agrobacterium vector. Mol Gen Genet 204: 383-396 [Google Scholar]
- Kushnir S, Babiychuk E, Storozhenko S, Davey MV, Papenbrock J, de Rycke R, Engler G, Stephan UW, Lange H, Kispal G et al. (2001) A mutation of the mitochondrial ABC transporter Sta1 leads to dwarfism and chlorosis in the Arabidopsis mutant starik. Plant Cell 13: 89-100 [DOI] [PMC free article] [PubMed] [Google Scholar]
- Lindsey K, Wei W, Clarke MC, McArdle HF, Rooke LM, Topping JF (1993) Tagging genomic sequences that direct transgene expression by activation of a promoter trap in plants. Transgenic Res 2: 33-47 [DOI] [PubMed] [Google Scholar]
- Martinoia E, Klein M, Geisler M, Bovet L, Forestier C, Kolukisaoglu U, Müller-Röber B, Schulz B (2002) Multifunctionality of plant ABC transporters: more than just detoxifiers. Planta 214: 345-355 [DOI] [PubMed] [Google Scholar]
- Mathur J, Szabados L, Schaefer S, Grunenberg B, Lossow A, Jonas-Straube E, Schell J, Koncz C, Koncz-Kalman Z (1998) Gene identification with sequenced T-DNA tags generated by transformation of Arabidopsis cell suspension. Plant J 13: 707-716 [DOI] [PubMed] [Google Scholar]
- Meissner R, Chague V, Zhu Q, Emmanuel E, Elkind Y, Levy AA (2000) Technical advance: a high throughput system for transposon tagging and promoter trapping in tomato. Plant J 22: 265-274 [DOI] [PubMed] [Google Scholar]
- Millar AJ, Short SR, Chua NH, Kay SA (1992) A novel circadian phenotype based on firefly luciferase expression in transgenic plants. Plant Cell 4: 1075-1087 [DOI] [PMC free article] [PubMed] [Google Scholar]
- O'Kane CJ, Gehring WJ (1987) Detection in situ of genomic regulatory elements in Drosophila. Proc Natl Acad Sci USA 84: 9123-9127 [DOI] [PMC free article] [PubMed] [Google Scholar]
- Ökrész L, Máthé C, Horváth É, Koncz C, Szabados L (1998) T-DNA trapping of a cryptic promoter identifies an ortholog of highly conserved SNZ growth arrest response genes in Arabidopsis. Plant Sci 138: 217-228 [Google Scholar]
- Pawlowski K, Kunze R, De Vries S, Bisseling T (1994) Isolation of total poly(A) and polysomal RNA from plant tissues. In SB Gelvin, RA Schilperoort, DPS Verma, eds, Plant Molecular Biology Manual, Vol 2. Kluwer Academic Publishers, Dordrecht, The Netherlands, pp D1-13 [Google Scholar]
- Riggs CD, Chrispeels MJ (1987) Luciferase reporter gene cassettes for plant gene expression studies. Nucleic Acids Res 15: 8115. [DOI] [PMC free article] [PubMed] [Google Scholar]
- Riggs CD, Hunt DC, Lin J, Chrispeels MJ (1989) Utilization of luciferase fusion genes to monitor differential regulation of phytohemagglutinin and phaseolin promoters in transgenic tobacco. Plant Sci 63: 47-57 [Google Scholar]
- Sanchez-Fernandez R, Davies TG, Coleman JO, Rea PA (2001) The Arabidopsis thaliana ABC protein superfamily, a complete inventory. J Biol Chem 276: 30231-30244 [DOI] [PubMed] [Google Scholar]
- Sidler M, Hassa P, Hasan S, Ringli C, Diudler R (1998) Involvement of an ABC transporter in a development pathway regulating hypocotyl cell elongation in the light. Plant Cell 10: 1623-1636 [DOI] [PMC free article] [PubMed] [Google Scholar]
- Smart CC, Fleming AJ (1996) Hormonal and environmental regulation of a plant PDR5-like ABC transporter. J Biol Chem 271: 19351-19357 [DOI] [PubMed] [Google Scholar]
- Smith DL, Fedoroff NV (1995) LRP1, a gene expressed in lateral and adventitious root primordia of Arabidopsis. Plant Cell 7: 735-745 [DOI] [PMC free article] [PubMed] [Google Scholar]
- Springer PS (2000) Gene traps: tools for plant development and genomics. Plant Cell 12: 1007-1020 [DOI] [PMC free article] [PubMed] [Google Scholar]
- Sundaresan V, Springer P, Volpe T, Haward S, Jones JD, Dean C, Ma H, Martienssen (1995) Patterns of gene action in plant development revealed by enhancer trap and gene trap transposable elements. Genes Dev 9: 1797-1810 [DOI] [PubMed] [Google Scholar]
- Szabados L, Kovács I, Oberschall A, Ábrahám E, Kerekes I, Zsigmond L, Nagy R, Alvarado M, Krasovskaja I, Gál M et al. (2002) Distribution of 1000 sequenced T-DNA tags in the Arabidopsis genome. Plant J 32: 233-242 [DOI] [PubMed] [Google Scholar]
- Teeri TH, Herrera-Estrella L, Depicker A, Van Montagu M, Palva ET (1986) Identification of plant promoters in situ by T-DNA-mediated transcriptional fusions to the npt-II gene. EMBO J 5: 1755-1760 [DOI] [PMC free article] [PubMed] [Google Scholar]
- Thompson JF, Hayes LS, Lloyd DB (1991) Modulation of firefly luciferase stability and impact on studies of gene regulation. Gene 103: 171-177 [DOI] [PubMed] [Google Scholar]
- Topping JF, Agyeman F, Henricot B, Lindsey K (1994) Identification of molecular markers of embryogenesis in Arabidopsis thaliana by promoter trapping. Plant J 5: 895-903 [DOI] [PubMed] [Google Scholar]
- van den Brule S, Muller A, Fleming AJ, Smart CC (2002) The ABC transporter SpTUR2 confers resistance to the antifungal diterpene sclareol. Plant J 30: 649-662 [DOI] [PubMed] [Google Scholar]
- Vielle-Calzada JP, Baskar R, Grossniklaus U (2000) Delayed activation of the paternal genome during seed development. Nature 404: 91-94 [DOI] [PubMed] [Google Scholar]
- Xiong L, Zhu JK (2001) Abiotic stress signal transduction in plants: molecular and genetic perspectives. Physiol Plant 112: 152-166 [DOI] [PubMed] [Google Scholar]
Associated Data
This section collects any data citations, data availability statements, or supplementary materials included in this article.


