Abstract
Purpose
To investigate refractive error, especially myopia, in parents of myopic children and its association with education and occupation.
Methods
Six hundred and twenty seven parents (n = 375 mothers and 252 fathers) of the 469 myopic 6 to <12 year-old children enrolled in COMET provided refraction data as well as answered questions about their education and occupation. Eighty-five percent of the refractions were obtained by non-cycloplegic autorefraction (Nidek ARK 700A) and 15% were obtained from the most recent prescription.
Results
The mean age ± SD of the parents was 44.26 ± 5.81 years, and their mean spherical equivalent refraction (SER) was −2.34 ± 2.94 D. Parents with higher education (college degree or greater) had significantly more myopia (−2.97 ± 2.98 D) than parents with lower education (−1.72 ± 2.76 D). The odds of being myopic was significantly higher in the higher education group (multivariate OR = 2.12, 95% CI = 1.41, 3.19). Mean myopia also differed significantly by occupation, with parents in white collar jobs (−2.87 ± 3.10 D) significantly more myopic than those in blue collar jobs (−1.21 ± 2.02 D) by 1.66 D (p < 0.001). The odds of being myopic between the two occupation groups was of borderline significance (multivariate OR=1.61, 95% CI= 0.999, 2.60).
Conclusions
The parents of myopic children participating in a clinical trial of lenses to slow the progression of myopia had a high prevalence of myopia that was associated with their level of education and to a lesser extent with their choice of occupation. To our knowledge, this is the first account of refractive errors, education, and occupation in parents of a large group of myopic children.
Keywords: myopia, refractive error, education, occupation, children’s vision
Many studies have shown that both genetic and environmental factors contribute to the risk of developing myopia, with differing views on the relative contributions of each (reviewed in Morgan and Rose1). A putative environmental risk factor is near work, and various theories have been proposed to account for the association between near work and myopia 2,3 or to downplay the link.4 Intensive near work is often invoked to account for the higher prevalence of myopia found in individuals with more years of education,5–8 although other factors such as intelligence, type of school, study habits, and outdoor play patterns may be involved. Near work also may be a factor in the higher prevalence of myopia found in individuals in certain white collar versus blue collar occupations.9–11
The association between myopia in children and their parents is strong, with studies reporting increased odds of developing myopia with more myopic parents.12–13 Limited information is available relating myopia progression in children to parental myopia.14
As part of the Correction of Myopia Evaluation Trial (COMET), an ancillary study was conducted to explore the relationship between parental refractive error and myopia progression in their children.15–16 A main finding was that for children wearing conventional single vision lenses, the number of myopic parents was a statistically significant risk factor for the progression of myopia, with more progression in children who had two compared to zero or one myopic parent. Another result was a larger treatment benefit of progressive addition lenses versus single vision lenses in those children with two myopic parents. In addition to parental refractive error, in the ancillary study data also were collected on the education and occupations of the parents. The purpose of the present analyses was to investigate the refractive errors of parents of myopic children and their association with education and occupation. To our knowledge, this is the first investigation of refractive errors in the parents of a large group of myopic children. Our hypothesis is that higher education and white collar occupations are associated with myopia in parents of myopic children.
METHODS
Data for the COMET ancillary study on parental refraction were obtained at all four clinical centers, at the New England College of Optometry (NECO), Boston, MA;University of Alabama at Birmingham School of Optometry (UAB), Birmingham, AL; University of Houston College of Optometry (UH), Houston TX; and the Pennsylvania College of Optometry (PCO) at Salus University, Philadelphia, PA. The institutional review boards at each participating center approved the research protocols. All COMET protocols and procedures conformed to the tenets of the Declaration of Helsinki. Informed consent from the parents was obtained after verbal and written explanation of the nature and possible consequences of the study.
Subjects
Six hundred and twenty seven parents (n = 375 mothers and 252 fathers) of the 469 myopic 6 to <12 year-old children enrolled in COMET provided refraction data as well as answered questions about their education and occupation. Eighty-five percent of the refractions were obtained by non-cycloplegic autorefraction (Nidek ARK 700A) and 15% were obtained from the most recent spectacle prescription as long as it was less than five years old. The age range of the parents at the time of data collection was from 28.62 to 63.74 years, with a mean of 44.26 ± 5.81 years. The age range of the mothers was from 28.62 to 57.32 years, with a mean of 43.06 ± 5.35 years, and the age range of the fathers was from 32.42 to 63.74 years, with a mean of 46.03 ± 6.01 years.
Education
At two clinical centers (UAB and NECO) the clinic coordinators asked parents to specify the “highest level of education completed” and then coded each parent’s response into the most appropriate category from the list below. At the other two centers (UH and PCO), the categories were read aloud to the parents, who then chose the most appropriate response from the following options: (1) did not complete high school; (2) completed high school; (3) completed some college/technical school; (4) graduated from a four-year college; or (5) completed graduate or professional school.
Occupation
At three of the four clinical centers, the clinic coordinators collected occupation information by asking parents to indicate their “primary or lifetime occupation.” The type of work specified by the parents was then coded at the Coordinating Center into one of the nine major categories listed below, taken from the Occupational Outlook Handbook, 2000–2001 (U.S. Dept. of Labor, Bureau of Labor Statistics). At the fourth center (UH), a staff member read the categories aloud to the parents, who then chose the most appropriate category from the list. A 10th category (other) was created for occupations that did not fit into the other nine (mainly homemakers), or combined two or more categories.
Executive, administrative, managerial (e.g., accountant, education administrator)
Professional, technical (e.g., architect, lawyer)
Marketing, sales (e.g., real estate agent, travel agent)
Administrative support, including clerical (e.g., bank teller, secretary)
Service (e.g., janitor, cook)
Mechanic, installer, repairer (e.g., auto service technician, line installer)
Construction trade (e.g., bricklayer, carpenter)
Production (e.g., butcher, dental lab technician)
Transportation, material moving (e.g., bus driver, equipment operator) 10. Other (mainly homemakers)
Data Analysis
For those refractions obtained by autorefraction, the mean of five spherical equivalent measurements was calculated for each eye. For those obtained from a prescription the spherical equivalent of each eye was used. Since the two eyes were highly correlated (0.96 for mothers and 0.90 for fathers), the average of the spherical equivalent refraction (SER) of the two eyes from each parent was used for these analyses. Myopia was defined as an average SER ≤ −0.75 D; hyperopia was defined as an average SER ≥ 1.0D, and emmetropia included SERs between these two categories.
Some of the statistical analyses were performed using all of the original categories, while other analyses used grouped categories. For example, the five education levels were grouped into two major categories: 1) some college and less education, and 2) four-year college degree and more education, and the ten occupation levels were grouped into three major categories: 1) white collar (categories 1–4); 2) blue collar (categories 5–9); and 3) other (category 10).
A one-way ANOVA was applied to test the difference across groups defined by individual education or occupation categories as well as the combined categories. Post-hoc tests were conducted to identify which pairs were significantly different. A two-way ANOVA with interaction was used to test the overall effect of education/gender and their interaction. Odds ratios and 95% confidence intervals were computed to assess the association between education/occupation and myopia using univariate logistic regression, multivariate logistic regression adjusting for age and gender (if applicable) of the parents, and multivariate logistic regression with all covariates (age, education, occupation, and gender if applicable) included. The chi-square test was conducted to compare the proportions of white collar jobs for mothers versus fathers at given education levels.
RESULTS
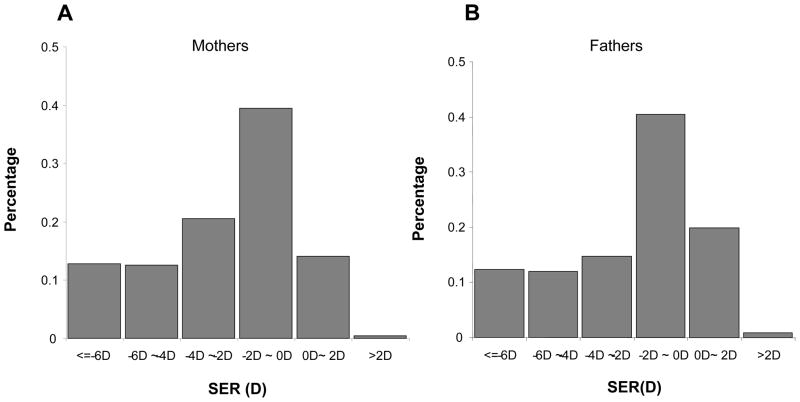
Overall 60.93% of the parents were myopic, 36.04% were emmetropic, and 3.03% were hyperopic. The distributions of spherical equivalent refractive errors in the mothers and fathers were similar, as shown in Figure 1. Table 1 includes the numbers of mothers and fathers in the various education and occupation categories. More fathers than mothers had graduate education (p=0.003), while the level of education for all other categories did not differ between mothers and fathers. The occupation distribution was similar for parents in some categories (e.g., executive, professional, marketing) but differed in others, with more mothers engaged in administrative support and in the other category (mainly homemakers) (p<0.001).
Figure 1.
Distribution of mean spherical equivalent refractions of (a) mothers and (b) fathers of COMET children.
Table 1.
Demographic characteristics of the sample.
| Education n (%) | Mothers | Fathers | Occupation n (%) | Mothers | Fathers |
|---|---|---|---|---|---|
| Did not complete high school | 31(8.27%) | 15(5.95%) | 1: Executive, administrative, managerial | 31(8.27%) | 21(8.33%) |
| High school | 73(19.47%) | 53(21.03%) | 2: Professional, technical | 134(35.73%) | 109(43.25%) |
| Some college/technical school | 94(25.07%) | 51(20.24%) | 3: Marketing, sales | 15(4.00%) | 15(5.95%) |
| Completed four-year college | 106(28.27%) | 59(23.41%) | 4: Administrative support, including clerical | 70(18.67%) | 13(5.16%) |
| Graduate or professional school | 71(18.93%) | 74(29.37%) | 5: Service | 46(12.27%) | 24(9.52%) |
| Total n (%) | 375 (100%) | 252 (100%) | 6: Mechanic, installer, repairer | 0(0.00%) | 13(5.16%) |
| 7: Construction trade | 0(0.00%) | 23(9.13%) | |||
| 8: Production | 1(0.27%) | 16(6.35%) | |||
| 9: Transportation, material moving | 3(0.80%) | 13(5.16%) | |||
| 10: Other (e.g. homemaker) | 75(20.00%) | 5(1.98%) | |||
| Total n (%) | 375 (100%) | 252 (100%) |
Education
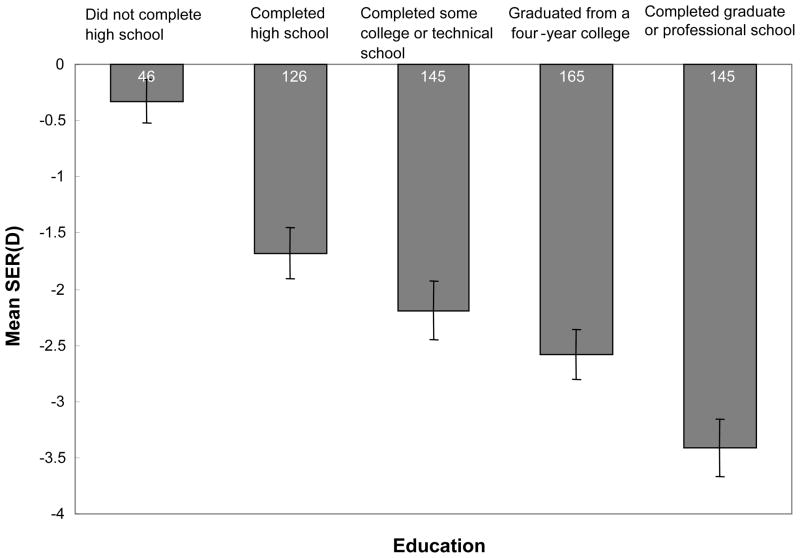
The mean ± SD refraction of the parents of the myopic children enrolled in COMET was −2.34 ± 2.94 D. As shown in Figure 2, mean myopia increased monotonically with increasing level of education, from −0.33 ± 1.30 D for parents without a high school diploma to −3.41 ± 3.05 D for those completing graduate education. Parents who did not finish high school were significantly less myopic compared to the other four education groups (ANOVA, p<0.0001; Tukey’s adjustment, all p values < 0.05). Parents with a graduate or professional degree had more myopia than those with some college or less education (ANOVA, p<0.0001; Tukey’s adjustment, all p values < 0.05).
Figure 2.
Mean spherical equivalent refraction by level of education in parents of COMET children. Error bars show standard errors.
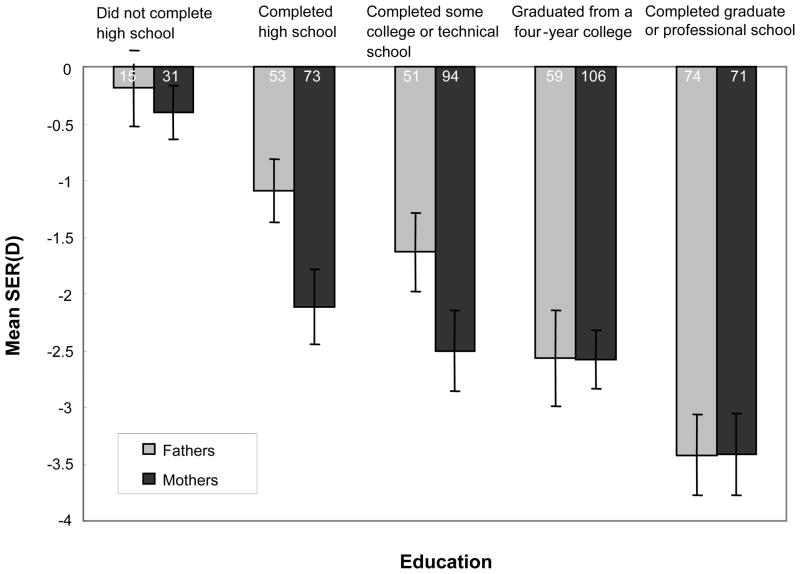
Figure 3 presents mean myopia in mothers and fathers in the same educational categories. The difference in average refractive error between genders varied by education levels (two-way ANOVA interaction, p = 0.04). Overall 50.56% of the parents had some college or less education (the first three categories), with 52.80% of the mothers and 47.22% of the fathers in these categories. In addition, 49.44% of the parents (47.20% of the mothers and 52.78% of the fathers) completed a 4-year college or graduate school. There was a significant gender difference in refraction in the three groups with less education, with mothers more myopic than fathers (−2.03 D vs. −1.21 D; p = 0.01), but not for the two groups with more education (−2.91 D vs. −3.04 D; p = 0.70).
Figure 3.
Mean spherical equivalent refraction by level of education in mothers and fathers of COMET children. Error bars show standard errors.
The percentage of parents who were myopic by at least − 0.75 D increased with education level, ranging from 23.91% in the group not completing high school to 79.31% in the most educated group. Looking at the extremes, the odds of being myopic were significantly higher for parents with a graduate education than for those not completing high school (OR = 12.20, 95% CI = (5.55, 26.81)).
After adjusting for age and gender and combining the five education categories into two, higher education (college degree or more education) vs. less education than a college degree was significantly associated with an approximately two-fold greater odds of being myopic (OR=2.77, 95% CI = (1.96, 3.92), as shown in Table 2. In a multivariate analysis that included all covariates, the association between myopia and higher education remained statistically significant with a similar odds ratio (OR =2.12, 95% CI = 1.31, 3.19). Mothers alone showed a similar trend to the overall results, but in the multivariate analysis including all covariates the association between myopia and higher education in mothers was of borderline significance (OR=1.60, 95% CI=0.97, 2.65). The odds ratios for fathers alone were higher than for mothers and were statistically significant in the multivariate analysis (OR=3.80, 95% CI = 1.82, 7.92).
Table 2.
Mean refraction, percent myopic, and odds ratios by parental education and occupation for all parents and mothers and fathers separately.
| Refractive Error SER (D) | n | Mean (SD) | Myopia (%) | Univariate OR | Multivariate OR1 | Multivariate OR2 |
|---|---|---|---|---|---|---|
| Both genders combined | 627 | −2.34 (2.94) | 382 (60.93%) | |||
|
| ||||||
| Education Level | ||||||
| Some college/technical school degree or lower | 317 | −1.72 (2.76) | 158 (49.84%) | Reference | Reference | Reference |
| Four-year college degree or higher | 310 | −2.97 (2.98) | 224 (72.26%) | 2.62 (1.88, 3.65) | 2.77 (1.96, 3.92) | 2.12 (1.41, 3.19) |
|
| ||||||
| Occupation | ||||||
| Blue collar (5–9) | 139 | −1.21 (2.02) | 62 (44.60%) | Reference | Reference | Reference |
| White collar (1–4) | 408 | −2.87 (3.10) | 281 (68.87%) | 2.75 (1.85, 4.08) | 2.55 (1.70, 3.84) | 1.61 (0.999, 2.60) |
| Other (10) | 80 | −1.56 (2.70) | 39 (48.75%) | 1.18 (0.68, 2.05) | 0.99 (0.55, 1.79) | 0.83 (0.46, 1.53) |
|
| ||||||
| Mothers | 375 | −2.45(2.97) | 240 (64%) | |||
|
| ||||||
| Education Level | ||||||
| Some college/technical school degree or lower | 198 | −2.03 (3.02) | 111 (56.06%) | Reference | Reference | Reference |
| Four-year college degree or higher | 177 | −2.91 (2.84) | 129 (72.88%) | 2.11 (1.36, 3.25) | 2.12 (1.35, 3.32) | 1.60 (0.97, 2.65) |
|
| ||||||
| Occupation | ||||||
| Blue collar (5–9) | 50 | −1.54 (2.27) | 26 (52%) | Reference | Reference | Reference |
| White collar (1–4) | 250 | −2.93 (3.10) | 178 (71.2%) | 2.28 (1.23, 4.24) | 2.25 (1.21, 4.18) | 1.75 (0.89, 3.43) |
| Other (10) | 75 | −1.44(2.55) | 36 (48%) | 0.85 (0.42, 1.74) | 0.84 (0.41, 1.73) | 0.78 (0.38, 1.60) |
|
| ||||||
| Fathers | 252 | −2.17 (2.89) | 142 (56.35%) | |||
|
| ||||||
| Education Level | ||||||
| Some college/technical school degree or lower | 119 | −1.21 (2.18) | 47 (39.50%) | Reference | Reference | Reference |
| Four-year college degree or higher | 133 | −3.04 (3.16) | 95 (71.43%) | 3.83 (2.26, 6.48) | 4.00 (2.33, 6.86) | 3.80 (1.82, 7.92) |
|
| ||||||
| Occupation | ||||||
| Blue collar (5–9) | 89 | −1.03 (1.86) | 36 (40.45%) | Reference | Reference | Reference |
| White collar (1–4) | 158 | −2.78 (3.12) | 103 (65.19%) | 2.76 (1.61, 4.71) | 2.84 (1.64, 4.93) | 1.13 (0.53, 2.41) |
| Other (10) | 5 | −3.46 (4.37) | 3 (60%) | 2.20 (0.35, 13.89) | 2.40 (0.37, 15.50) | 2.26 (0.33, 15.54) |
ORs in bold and italics are statistically significant
: adjusting for age and gender (if applicable)
: adjusting for age, gender (if applicable), education, and occupation
Occupation
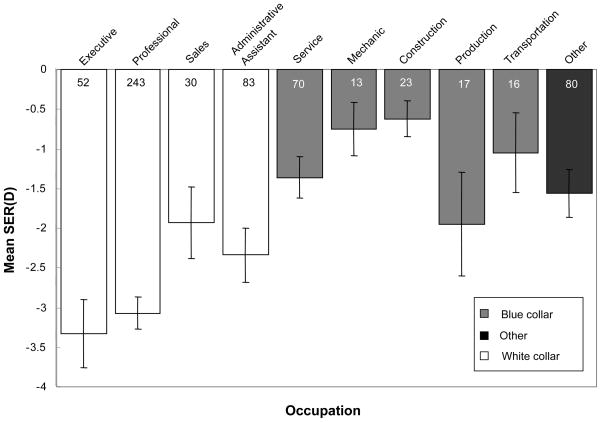
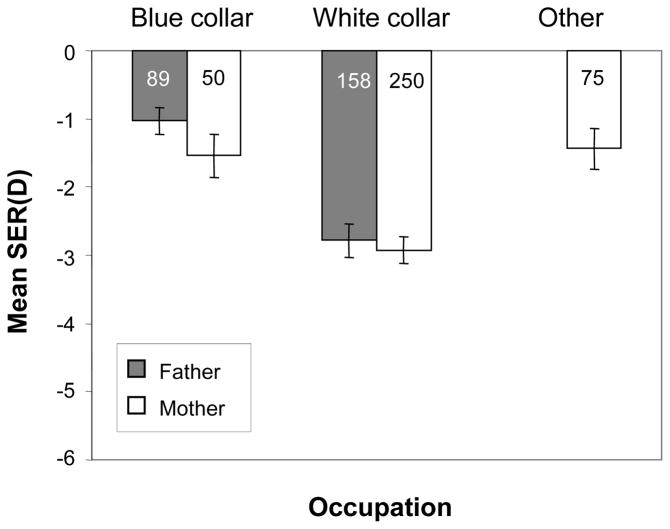
As shown in Figure 4, mean myopia differed significantly across the ten occupation categories (ANOVA, p<0.0001), ranging from −3.40 ± 3.09 D in parents who were executives to −0.60 ± 1.10 D in parents who worked in construction. Parents in white collar jobs (−2.87 ± 3.10 D) were significantly more myopic than those in blue collar jobs (−1.21 ± 2.02 D) or the other category (−1.56 ± 2.70 D) (ANOVA and Tukey’s adjustment, all p values < 0.001). The mean refraction of parents with blue collar jobs was similar to the mean refraction in the other category (Tukey’s adjustment; p = 0.54). After adjusting for age and gender, the white collar group was still significantly associated with more minus refractions (p<0.001). Overall, the mean refractions of mothers and fathers were not significantly different for any occupation category (white collar, blue collar, or other), as shown in Figure 5.
Figure 4.
Mean spherical equivalent refraction by occupation of parents of COMET children. Error bars show standard errors.
Figure 5.
Mean spherical equivalent refraction by occupation (white collar, blue collar, and other) of mothers and fathers of COMET children. Error bars show standard errors. A bar is not included for fathers in the other category due to small numbers.
The percentage of myopes in the white collar group (68.87%) was significantly higher than in the blue collar group (44.60%) (OR = 2.55, 95% CI = (1.70, 3.84)) when adjusting for age and gender, as shown in Table 2. The same pattern was shown for mothers and fathers. However, in the multivariate analysis including all covariates, the association between white collar vs. blue collar occupations and myopia became weaker. For all parents combined, the odds ratio was reduced to 1.61 (95% CI= 0.999, 2.60), which is of borderline significance. When data from mothers and fathers were analyzed separately, no significant association was observed between white collar vs. blue collar occupations and myopia.
Education, Occupation, and Gender
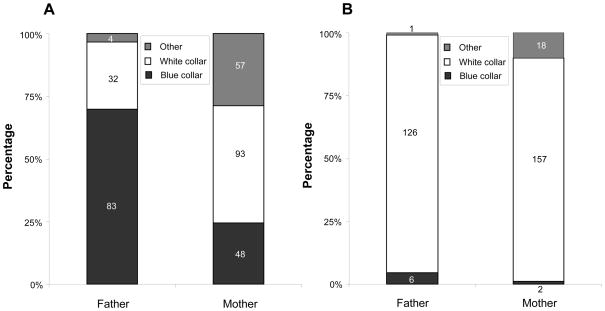
As shown above in Figure 3, mothers with some college or less education had a significantly more myopic mean spherical equivalent than fathers in the same education categories. Furthermore, as shown in Figure 6a, for these education categories, mothers also were more likely to have white collar jobs compared to fathers (93/198 = 46.97% vs. 32/119 = 26.89%), and fathers were more likely to have blue collar jobs (83/119 = 69.75% vs. 48/198 = 24.24%), (chi-square test; p<0.001). However, as shown in Figure 6b, for parents who had a four-year college degree or more education, a high percentage of both mothers and fathers had white collar jobs. The percentages of mothers and fathers with white collar jobs were not significantly different (157/177 = 88.70% vs. 126/133 = 94.74%, p = 0.10).
Figure 6.
(A) Occupation distribution for mothers and fathers with some college degree or less education. (B) Occupation distribution for mothers and fathers with more education.
DISCUSSION
In this study the parents of moderately myopic children had a mean spherical equivalent refractive error of −2.34 D and 60.93% of them were myopic, a prevalence almost twice as high as that found in American adults.17 These numbers may not be surprising given that all of the parents had myopic children and considering the familial aspects of myopia. In addition, because COMET was a clinical trial, it is likely that the parents who responded to recruitment materials seeking myopic children for a study of a lens treatment to slow myopia progression were more likely to be myopic themselves and concerned about the future refractive state of their offspring.
Although the prevalence of myopia varies greatly in the different populations worldwide used to investigate risk factors for myopia, it appears that the association of myopia and higher education is robust. In our highly myopic sample, the overall association of more myopia with more years of education was similar to what has been reported in other adult populations, including those with less myopia and more limited education.1,5, 18 For example, in the Los Angeles Latino Eye Study, a population-based study of 6357 adult Latinos, more education was one of the strongest risk factors for myopia.18 However, the overall prevalence of myopia ≤ −1.0 D in that study was 16.7%, compared to 60.9% in our study, and more than half of the participants did not complete high school.18
Higher education could be related to myopia by a combination of extensive near work and high IQ. After reviewing the literature on risk factors, Morgan and Rose suggested that “school performance, performance on IQ tests, and near work be regarded as potentially linked variables in epidemiological analysis.”1 They further suggested that higher levels of education might be attained by individuals who were prepared for test taking, as evidenced by performance on IQ tests, and who also were involved in near work activities such as reading and studying. However, another study showed that nonverbal IQ was related to myopia independent of near work but the mechanism was not clear.19
In our study more myopia overall was found to be associated with white collar vs. blue collar occupations. Previous investigations also have reported that individuals in white collar jobs had more myopia.20–22 In a population-based study of 3271 urban and 1473 rural adults living in Victoria, Australia, professionals and clerks had a prevalence of myopia of 30.3% and 27.7% respectively, with more negative spherical equivalents than all other occupational groups.20 Similarly, in a population-based study of 2168 Japanese adults, myopia was associated with management occupations in the men and with clerical and sales occupations in the women.21 The prevalence of myopia in 1232 Chinese adults living in Singapore ranged from 52.4% for professionals to 30.7% for blue collar workers, 22 lower than our findings of 68.9% for the white collar group and 44.6% for the blue collar group but with a similar difference in prevalence of approximately 22% between white and blue collar workers. It is unclear if these previous findings for the association of occupation and myopia were confounded by education.
Occupation in the current study appears not to be independently associated with myopia beyond its association with education, overall and separately for mothers and fathers. This is not surprising because myopia onset for most parents likely predated the choice of occupation, and the choice of occupation reflects in part the level of education attained. Because education and occupation were more closely related in fathers than mothers (Figure 6a and b), the reduction in the odds ratio between white collar occupations and myopia after adjusting for education appeared greater for fathers.
An interesting result was that among parents with lower educational levels, the mothers of COMET children had, on average, significantly more negative spherical equivalent refractions than the fathers. They also were more likely to have white collar jobs. These results can be interpreted in different ways. The mothers in white collar jobs may have performed more near work, which could lead to more progression of existing myopia, and/or the fathers in blue collar jobs may have spent more time outdoors which could be protective. Another possibility is that factors related to gender differences other than choice of occupation, such as hours of near work in their youth or hours of indoor vs. outdoor activities, might have contributed to the difference in the amount of myopia between fathers and mothers. Such factors might also account for the higher prevalence of myopia for mothers compared to fathers within the lower education group.
There are some limitations to consider in interpreting the results of our study. Because COMET was a clinical trial, it is likely that in recruiting myopic children we also recruited myopic parents. Therefore, the results of this study are not likely to be generalizable beyond this sample. Also, despite our best efforts to locate and refract the parents of COMET children, only 84% of the mothers and 57% of the fathers participated in this ancillary study. Also, the absence of refractive histories from the parents limits conclusions that can be drawn about the temporal association of refractive error, education, and occupation and the roles of near work and outdoor activity in myopia development and progression. Another study limitation is the lack of data, such as IQ, that might be related to myopia in the parents and also influence their level of education and choice of occupation. Finally, this study is cross-sectional, limiting conclusions that can be drawn about the etiology of myopia. Longitudinal studies of children and young adults in different educational and occupational situations provide more compelling evidence of a role for the visual environment, with individuals in more near-work intensive environments and/or with less outdoor activity showing more myopia development or progression of existing myopia.9–11
In summary, the parents of moderately myopic children participating in a clinical trial of PALs vs. SVLs to slow the progression of myopia had a high prevalence of myopia that was associated with their level of education and to a lesser extent with their choice of occupation. To our knowledge, this is the first account of refractive errors and associated factors in the parents of a large group of myopic children.
Acknowledgments
This research was supported by NEI/NIH grants EY11756, EY11754, EY11805, EY11752, EY11740, EY11755
Members of the COMET Study Group
Study Chair’s Office
New England College of Optometry, Boston, Massachusetts
Jane Gwiazda (Study Chair/Principal Investigator); Kenneth Grice (Study Coordinator 9/96-7/99); Christine Fortunato (Study Coordinator 8/99-9/00); Cara Weber (Study Coordinator 10/00-8/03); Alexandra Beale (Study Coordinator 11/03-7/05); Rosanna Pacella (Research Assistant 10/96-10/98); Thomas Norton (Consultant, University of Alabama at Birmingham).
Coordinating Center
Department of Preventive Medicine, Stony Brook University Health Sciences Center; Stony Brook, New York
Leslie Hyman (Principal Investigator); M. Cristina Leske (Co-Principal Investigator until 9/03); Mohamed Hussein (Co-Investigator/Biostatistician until 10/03); Li Ming Dong (Biostatistician 12/03-5/10); Elinor Schoenfeld (Epidemiologist, until 9/05); Lynette Dias (Study Coordinator 6/98-present); Rachel Harrison (Study Coordinator 4/97-3/98); Jennifer Thomas (Assistant Study Coordinator 12/00-04/04); Marcela Wasserman (Assistant Study Coordinator 05/04-7/06); Cristi Rau (Assistant Study Coordinator 2/99-11/00); Elissa Schnall (Assistant Study Coordinator 11/97-11/98); Wen Zhu (Senior Programmer until 12/06); Ying Wang (Data Analyst 1/00-12/05); Ahmed Yassin (Data Analyst 1/98-1/99); Lauretta Passanant (Project Assistant 2/98-12/04); Maria Rodriguez (Project Assistant 10/00-present); Allison Schmertz (Project Assistant 1/98-12/98); Ann Park (Project Assistant 1/99-4/00); Phyllis Neuschwender (Administrative Assistant, until 11/99); Geeta Veeraraghavan (Administrative Assistant 12/99-4/01); Angela Santomarco (Administrative Assistant 7/01-8/04).
National Eye Institute, Bethesda, Maryland
Donald Everett (Program Director, Collaborative Clinical Trials Branch).
Clinical Centers
University of Alabama at Birmingham School of Optometry, Birmingham, Alabama
Wendy Marsh-Tootle (Principal Investigator); Katherine Niemann (Optometrist 9/98-present); Kristine Becker (Ophthalmic Consultant 7/99-3/03); James Raley (Optician 9/97-4/99); Angela Rawden (Back-up Optician 10/97-9/98); Catherine Baldwin (Primary Optician & Clinic Coordinator 10/98-present); Nicholas Harris (Clinic Coordinator 3/98-9/99); Trana Mars (Back-up Clinic Coordinator 10/97-3/03); Robert Rutstein (Consulting Optometrist until 8/03).
New England College of Optometry, Boston, Massachusetts
Daniel Kurtz (Principal Investigator until 6/07); Erik Weissberg (6/99-present; Principal Investigator since 6/07); Bruce Moore (Optometrist until 6/99); Robert Owens (Primary Optician); Justin Smith (Clinic Coordinator 1/01-8/08); Sheila Martin (Clinic Coordinator until 9/98); Joanne Bolden (Coordinator 10/98-9/03); Benny Jaramillo (Back-up Optician 3/00-6/03); Stacy Hamlett (Back-up Optician 6/98-5/00); Laura Vasilakos (Back-up Optician 2/02-12/05); Sarah Gladstone (Back-up Optician, 6/04-3/07); Patricia Kowalski (Consulting Optometrist until 6/01); Jennifer Hazelwood (Consulting Optometrist 7/01-8/03).
University of Houston College of Optometry, Houston, Texas
Ruth Manny (Principal Investigator); Connie Crossnoe (Optometrist until 5/03); Sheila Deatherage (Optician until 3/07); Charles Dudonis (Optician until 1/07); Sally Henry (Clinic Coordinator until 8/98); Jennifer McLeod (Clinic Coordinator 9/98-8/04); Mamie Batres (Clinic Coordinator 8/04-1/06); Julio Quiralte (Back-up Coordinator 1/98-7/05); Karen Fern (Consulting Optometrist until 8/03; Optometrist since 9/03).
Pennsylvania College of Optometry at Salus University, Philadelphia, Pennsylvania
Mitchell Scheiman (Principal Investigator); Kathleen Zinzer (Optometrist until 4/04); Timothy Lancaster (Optician until 6/99); Theresa Elliott (Optician until 8/01); Mark Bernhardt (Optician 6/99-5/00); Dan Ferrara (Optician 7/00-7/01); Jeff Miles (Optician 8/01-12/04); Scott Wilkins (Optician 9/01-8/03); Renee Wilkins (Optician 01/02-8/03); Jennifer Nicole Smith (Optician & Back-up Coordinator 10/03-9/05); Karen Pollack (Clinic Coordinator 11/03-present); Abby Grossman (Clinic Coordinator 8/01-11/03); Mariel Torres (Clinic Coordinator 7/97-6/00); Heather Jones (Clinic Coordinator 8/00-7/01); Melissa Madigan-Carr (Coordinator 7/01-3/03); Theresa Sanogo (Back-up Coordinator 7/99-3/03); JoAnn Bailey (Consulting Optometrist until 8/03).
References
- 1.Morgan I, Rose K. How genetic is school myopia? Prog Retin Eye Res. 2005;24:1–38. doi: 10.1016/j.preteyeres.2004.06.004. [DOI] [PubMed] [Google Scholar]
- 2.Goss DA. Clinical accommodation and heterophoria findings preceding juvenile onset of myopia. Optom Vis Sci. 1991;68:110–6. doi: 10.1097/00006324-199102000-00005. [DOI] [PubMed] [Google Scholar]
- 3.Gwiazda J, Thorn F, Bauer J, Held R. Myopic children show insufficient accommodative response to blur. Invest Ophthalmol Vis Sci. 1993;34:690–4. [PubMed] [Google Scholar]
- 4.Mutti DO, Zadnik K. Has near work’s star fallen? Optom Vis Sci. 2009;86:76–8. doi: 10.1097/OPX.0b013e31819974ae. [DOI] [PubMed] [Google Scholar]
- 5.Richler A, Bear JC. Refraction, nearwork and education. A population study in Newfoundland. Acta Ophthalmol (Copenh) 1980;58:468–78. doi: 10.1111/j.1755-3768.1980.tb05748.x. [DOI] [PubMed] [Google Scholar]
- 6.Kinge B, Midelfart A, Jacobsen G, Rystad J. The influence of near-work on development of myopia among university students. A three-year longitudinal study among engineering students in Norway. Acta Ophthalmol Scand. 2000;78:26–9. doi: 10.1034/j.1600-0420.2000.078001026.x. [DOI] [PubMed] [Google Scholar]
- 7.Zylbermann R, Landau D, Berson D. The influence of study habits on myopia in Jewish teenagers. J Pediatr Ophthalmol Strabismus. 1993;30:319–22. doi: 10.3928/0191-3913-19930901-12. [DOI] [PubMed] [Google Scholar]
- 8.Konstantopoulos A, Yadegarfar G, Elgohary M. Near work, education, family history, and myopia in Greek conscripts. Eye (Lond) 2008;22:542–6. doi: 10.1038/sj.eye.6702693. [DOI] [PubMed] [Google Scholar]
- 9.Hepsen IF, Evereklioglu C, Bayramlar H. The effect of reading and near-work on the development of myopia in emmetropic boys: a prospective, controlled, three-year follow-up study. Vision Res. 2001;41:2511–20. doi: 10.1016/s0042-6989(01)00135-3. [DOI] [PubMed] [Google Scholar]
- 10.McBrien NA, Adams DW. A longitudinal investigation of adult-onset and adult-progression of myopia in an occupational group. Refractive and biometric findings. Invest Ophthalmol Vis Sci. 1997;38:321–33. [PubMed] [Google Scholar]
- 11.Cortinez MF, Chiappe JP, Iribarren R. Prevalence of refractive errors in a population of office-workers in Buenos Aires, Argentina. Ophthalmic Epidemiol. 2008;15:10–6. doi: 10.1080/09286580701755560. [DOI] [PubMed] [Google Scholar]
- 12.Zadnik K. The Glenn A. Fry Award Lecture 1995. Myopia development in childhood. Optom Vis Sci. 1997;74:603–8. [PubMed] [Google Scholar]
- 13.Pacella R, McLellan J, Grice K, Del Bono EA, Wiggs JL, Gwiazda JE. Role of genetic factors in the etiology of juvenile-onset myopia based on a longitudinal study of refractive error. Optom Vis Sci. 1999;76:381–6. doi: 10.1097/00006324-199906000-00017. [DOI] [PubMed] [Google Scholar]
- 14.Saw SM, Nieto FJ, Katz J, Schein OD, Levy B, Chew SJ. Familial clustering and myopia progression in Singapore school children. Ophthalmic Epidemiol. 2001;8:227–36. doi: 10.1076/opep.8.4.227.1609. [DOI] [PubMed] [Google Scholar]
- 15.Gwiazda J, Hyman L, Hussein M, Everett D, Norton TT, Kurtz D, Leske MC, Manny R, Marsh-Tootle W, Scheiman M. A randomized clinical trial of progressive addition lenses versus single vision lenses on the progression of myopia in children. The COMET Study Group. Invest Ophthalmol Vis Sci. 2003;44:1492–500. doi: 10.1167/iovs.02-0816. [DOI] [PubMed] [Google Scholar]
- 16.Kurtz D, Hyman L, Gwiazda JE, Manny R, Dong LM, Wang Y, Scheiman M. Role of parental myopia in the progression of myopia and its interaction with treatment in COMET children. Invest Ophthalmol Vis Sci. 2007;48:562–70. doi: 10.1167/iovs.06-0408. [DOI] [PubMed] [Google Scholar]
- 17.Vitale S, Ellwein L, Cotch MF, Ferris FL, 3rd, Sperduto R. Prevalence of refractive error in the United States, 1999–2004. Arch Ophthalmol. 2008;126:1111–9. doi: 10.1001/archopht.126.8.1111. [DOI] [PMC free article] [PubMed] [Google Scholar]
- 18.Tarczy-Hornoch K, Ying-Lai M, Varma R. Myopic refractive error in adult Latinos: the Los Angeles Latino Eye Study. Invest Ophthalmol Vis Sci. 2006;47:1845–52. doi: 10.1167/iovs.05-1153. [DOI] [PubMed] [Google Scholar]
- 19.Saw SM, Tan SB, Fung D, Chia KS, Koh D, Tan DT, Stone RA. IQ and the association with myopia in children. Invest Ophthalmol Vis Sci. 2004;45:2943–8. doi: 10.1167/iovs.03-1296. [DOI] [PubMed] [Google Scholar]
- 20.Wensor M, McCarty CA, Taylor HR. Prevalence and risk factors of myopia in Victoria, Australia. Arch Ophthalmol. 1999;117:658–63. doi: 10.1001/archopht.117.5.658. [DOI] [PubMed] [Google Scholar]
- 21.Shimizu N, Nomura H, Ando F, Niino N, Miyake Y, Shimokata H. Refractive errors and factors associated with myopia in an adult Japanese population. Jpn J Ophthalmol. 2003;47:6–12. doi: 10.1016/s0021-5155(02)00620-2. [DOI] [PubMed] [Google Scholar]
- 22.Wong TY, Foster PJ, Hee J, Ng TP, Tielsch JM, Chew SJ, Johnson GJ, Seah SK. Prevalence and risk factors for refractive errors in adult Chinese in Singapore. Invest Ophthalmol Vis Sci. 2000;41:2486–94. [PubMed] [Google Scholar]


