

Abstract
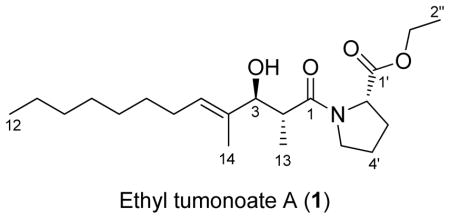
The evolutionary relationships of cyanobacteria, as inferred by their SSU (16S) rRNA genes, were used as predictors of their potential to produce varied secondary metabolites. The evolutionary relatedness in geographically distant cyanobacterial specimens was then used as a guide for the detection and isolation of new variations of predicted molecules. This phylogeny-guided isolation approach for new secondary metabolites was tested in its capacity to direct the search for specific classes of new natural products from Curaçao marine cyanobacteria. As a result, we discovered ethyl tumonoate A (1), a new tumonoic acid derivative with anti-inflammatory activity and inhibitory activity of calcium oscillations in neocortical neurons.
Cyanobacteria form a monophyletic bacterial phylum extraordinarily rich in bioactive secondary metabolites.1,2 A number of these metabolites are potent toxins associated with harmful algal blooms.3 Ironically, many of these same bioactive molecules have simultaneously been discovered to have a variety of potential pharmaceutical applications.2 In order to support and enhance the search for novel natural products it is valuable to have proper understanding of the taxonomy of the secondary metabolite-producing cyanobacteria.4 The traditional system of classifying cyanobacteria, which is based on phenotypical observations, has recently shown major incongruities with phylogenetic classifications where evolutionarily informative housekeeping genes are analyzed.5,6 This is partly a result of significant morphological plasticity among cyanobacteria, even at the genus level.7 Furthermore, cyanobacterial classification systems are largely founded on a relatively limited number of morphological characters, which often appear similar due to convergent evolution.8 Thus, the recent inclusion of phylogenetic analysis in classification of these microorganisms has led to a more accurate taxonomic understanding of these cyanobacterial groups.9,10 These developments have benefitted not only the field of taxonomy, but also natural products drug discovery efforts. For example, phylogenetic approaches have been used to: (i) accurately identify natural product-producing strains;11 (ii) analyze the microbial diversity in natural product producing assemblages;12,13 (iii) recollect specific natural product producing strains from the environment;12 and (iv) distinguish cyanobacterial chemotypes.14
According to basic evolutionary principles, metabolic and biosynthetic pathways are evolving between geographically isolated or distant populations as an adaptation to new environments. This concept of biogeographical diversification corresponds to a major underlying rationale and approach in the search for new natural products.13,14 While in fresh-water cyanobacteria secondary metabolites such as microcystins and cylindrospermopsins, have been reported from phylogenetically unrelated genera, the production of secondary metabolites in marine cyanobacteria as well as the distribution of their biosynthetic pathways has been linked with the phylogenetic positions of the secondary metabolite production.15,3 However, to date the two concepts of evolutionary relatedness and geographic diversification have not been effectively combined for predictive exploration of new natural products from marine cyanobacteria.
The major focus of this study was to use evolutionary relationships of marine cyanobacteria inferred by their SSU (16S) rRNA genes as predictors of their potential to produce various different secondary metabolites. The evolutionary relatedness of geographically distant populations was then used as a guide for the detection and isolation of new variations of predicted molecules. Furthermore, because new geographic locations likely represent unique environments with different evolutionary pressures, such analogs may possess different biological activities. This phylogeny-guided isolation approach for new secondary metabolites was tested for its capacity to direct the search for specific classes of new natural products from Curaçao marine cyanobacteria. As a result, we discovered ethyl tumonoate A (1), a new tumonoic acid derivative with anti-inflammatory activity in murine macrophage cells and inhibitory activity of calcium oscillations in neocortical neurons.
Results and Discussion
In October 2008 the tropical depression Omar made landfall on the Caribbean island of Curaçao bringing torrential rainfall and beach erosion.16 As a probable result of this disruptive weather system, extensive black, mat-forming cyanobacterial blooms emerged at several sites along the island’s leeward coast (Figure 1). Four geographically dispersed populations of this cyanobacterium (NAC8-45, NAC8-46, NAC8-54 and NAC8-55) were collected and morphologically and phylogenetically compared. All four specimens fell under the criteria of Lyngbya according to traditional morphology-based classification systems. The SSU (16S) rRNA genes, however, revealed a relatively close phylogenetic relation with the Oscillatoria reference strain PCC 7515 as well as other marine Oscillatoria species (Figure 2). The genera Lyngbya and Oscillatoria are evolutionarily distant, but share a number of morphological features and are therefore often mistaken for each other.17,18 As a consequence, the four specimens were re-classified as members of the genus Oscillatoria based on their phylogenetic position in relation to the Oscillatoria reference strain. The specimens were more specifically identified as Oscillatoria margaritifera (Kützing ex Gomont, 1892) based on a polyphasic combination of phylogenetic and morphological characters (Figure 2; Table 1). Because tropical marine Oscillatoria are also related to the genus Trichodesmium, the paraphyly of Oscillatoria suggests the need for revision of tropical marine Oscillatoria as a distinct and separate generic entity; hence the definition cf. Oscillatoria margaritifera (Figure 2).
Figure 1.

(A) Underwater pictures of cf. Oscillatoria margaritifera NAC8-46 from 8–10 m in Caracas baii, Curaçao. (B) Photomicrograph (400X) of filaments of cf. O. margaritifera NAC8-46.
Figure 2.

Maximum-likelihood (PhyML) phylogenetic inference of the cf. Oscillatoria margaritifera strains based on the SSU (16S) rRNA gene. The evolutionarily distant Gloeobacter violaceus PCC 7421 was used as outgroup. A lineage of the unicellular order Chroococcales and a lineage of the heterocystous order Nostocales as well as several genera of the order Oscillatoriales, were added to place the Oscillatoria lineage in a broader taxonomic perspective. Representative reference strains were selected from Bergey’s Manual of Systematics and are distinguished with asterisks. The Oscillatoria lineage is defined on the basis of the phylogenetic nesting with the Oscillatoria reference strain PCC 7515T and is highlighted. Specimens are designated as taxa, strain and acc. Nr. in brackets. The secondary metabolites produced by the Oscillatoria species are numbered next to the Oscillatoria lineage. Corresponding secondary metabolite producing strains are numbered with the equivalent number. The statistical supports are indicated at each node according to the maximum-likelihood (PhyML), Bayesian Inference (MrBayes), Maximum Parsimony (MP) methods. The scale bar is equivalent to 0.04 substitutions per nucleotide position.
Table 1.
Morphological Characterization of cf. Oscillatoria margaritifera Strains from Curaçaoa
| Strain | Thallu s | Sheaths | Filamentwidth (μm)b | Cell width (μm)b | Cell length (μm)b | Cross-wall constrictionc | Apical cells |
|---|---|---|---|---|---|---|---|
| NAC8-45 | Mats/clumps | Thin, barely visible | 20.3±0.7 | 16.8±0.8 | 2.0±0.1 | >0.5 (>3.0%) | slightly rounded with thickened cell walls |
| NAC8-46 | Mats/clumps | Thin, barely visible | 22.8±0.7 | 20.2±1.0 | 1.9±0.6 | >0.5 (>2.5%) | slightly rounded with thickened cell walls |
| NAC8-54 | Mats/clumps | Thin, barely visible | 22.4±0.4 | 20.8±0.9 | 2.1±0.5 | >0.5 (>2.4%) | slightly rounded with thickened cell walls |
| NAC8-55 | Mats/clumps | Thin, barely visible | 38.0±0.7 | 35.4±1.0 | 3.1±0.3 | >0.5 (1.4%) | slightly rounded with thickened cell walls |
The size measurements presented in this table are averages in μm. Filament diameters are the average of three filament measurements and cell measurements the average of ten adjacent cells of three filaments.
Amount of cell cross-wall constriction in μm and percentage of total cell width.
Interestingly, the cf. O. margaritifera strains were phylogenetically most closely related (p-distance = 99.3%) to a tumonoic acid-producing Blennothrix cantharidosmum PNG05-4 from Papua New Guinea (Figure 2).19 The morphologically similar genus Blennothrix has been shown to share a close evolutionary history with the genus Oscillatoria, indicating that taxonomic delimitation of these two genera is also needed.19,20 Other closely related strains include the Panamanian venturamide-producing Oscillatoria sp. PAB-21 and the viridamide-producing Oscillatoria nigro-viridis strain 3LOSC from Curaçao. Phylogenetic inference suggests that PAB-21 and 3LOSC strains diverged as a prior evolutionary event into a more distant basal lineage. This basal group also includes the microcolin-producing strain LP16 which originally was characterized as a Lyngbya polychroa.3 Herein, LP16 will be assumed to be a species of Oscillatoria because of its clear phylogenetic nesting within the Oscillatoria clade. The original tumonoic acid-producer, also described as a Lyngbya, was likely also misidentified because of the lack of phylogenetic inference.21
On the basis of the close evolutionary relatedness with the tumonoic acid-producing B. cantharidosmum, the cf. O. margaritifera strains were predicted to have a high likelihood of possessing the genes encoding for the biosynthesis of these or closely related molecules. Therefore, these four cf. O. margaritifera strains were screened for tumonoic acid-type molecules by a combination of LC-ESI-MS and MALDI-TOF-MS. All four cf. O. margaritifera populations displayed molecular ions corresponding to the known tumonoic acids A–C and E–G, as well as their methyl esters (methyl tumonoates A and B). The identities of these were confirmed by comparison of retention times and MS/MS fragmentation patterns with the authentic compounds (see Supporting Information).
The substantial geographic distance between the related Pacific B. cantharidosmum PNG05-4 and the Caribbean cf. O. margaritifera strains inspired further investigation of their organic extracts by LC-ESI-MS for new variations of the tumonoic acids. A major constituent with a molecular weight of m/z 368 [M+H]+ was detected in all four cf. O. margaritifera populations and database searches failed to suggest its identity. Three midpolar vacuum liquid chromatography (VLC)-fractions of NAC8-46 contained the metabolite, and these were subsequently subjected to RP HPLC to yield a pale yellow oil in a 3.0% yield (1, 55.1 mg). HR-ESI-MS gave a peak at m/z 390.2617 [M+Na]+ indicating a molecular formula of C21H37NO4. The IR spectrum showed characteristic absorption bands at 1630 cm−1 and at 1733 cm−1, indicating the presence of amide and ester groups in the molecule, respectively. The 1H and 13C NMR spectra of 1 showed an olefinic methine (δH 5.34, t; δC 129.0), an α proton of an amino acid (δH 4.39, dd; δC 58.7), an oxygenated methine (δH 4.04, d; δC 79.9) and an oxygenated methylene (δH 4.08, m; δC 61.0). The overlapped methylenes (δH 1.16–1.25) and methyls (δH 0.78, t; 0.99, d) suggested a branched fatty acid chain. Based on 2D NMR data analysis, all of the protons and carbons of a proline residue, an ethyl group and two terminal regions of a fatty acid were assigned. HMBC correlations from H2-1″ to C-1′ indicated that the ethyl group was attached to the proline via an ester linkage. The HMBC correlations from the H-2, H3-13 and H2-5′ to C-1 revealed that the proline and the fatty acid were linked through an amide bond. Three remaining methylenes, having similar 1H and 13C chemical shifts (δH 1.18, m; δC 29.3, δH 1.17, m; δC 29.2, δH 1.16, m; δC 31.8), were assigned as linking the two termini of the fatty acid. A 1D NOE correlation between H3-14 and H2-6 indicated the E geometry of the double bond. The H-2 pentet (δH 2.67, dq, J = 7.2, 7.2 Hz) in the fatty acid chain suggested that H3-13 and the 3-OH substituent were of anti-configuration (Table 2).19,21,22 The small difference in the 13C NMR chemical shifts of C-3′ from C-4′ (ΔδC3′-C4′=4.3 ppm) indicated that proline peptide bond was in the trans conformation (Table 2).23
Table 2.
NMR Spectroscopic Data for Ethyl Tumonoate A (1) in CDCl3 at 600 MHz (1H) and 150 MHz (13C).
| position | δC | δH multi (J in Hz) | COSY | HMBCa |
|---|---|---|---|---|
| Fatty acyl group | ||||
| 1 | 174.9 | |||
| 2 | 41.1 | 2.67, dq (7.2, 7.2) | 2-Me, 3 | 1, 3, 4, 13 |
| 3 | 79.9 | 4.04, d (7.2) | 2 | 1, 2, 4, 5, 13, 14 |
| 4 | 134.2 | |||
| 5 | 129.0 | 5.34, t (7.1) | 6 | 3, 6, 7, 14 |
| 6 | 27.6 | 1.92, m | 5, 7 | 4, 5, 7, 8 |
| 7 | 29.4 | 1.25, m | 6 | 5 |
| 8 | 29.3 | 1.18, m | ||
| 9 | 29.2 | 1.17, m | ||
| 10 | 31.8 | 1.16, m | ||
| 11 | 22.7 | 1.18, m | 12 | |
| 12 | 14.1 | 0.78, t (7.0) | 11 | 10, 11 |
| 13 | 14.4 | 0.99, d (7.2) | 2 | 1, 2, 3 |
| 14 | 11.4 | 1.52, s | 3, 4, 5 | |
| 3-OH | 3.32, brs | |||
| Proline | ||||
| 1′ | 172.2 | |||
| 2′ | 58.7 | 4.39, dd (8.6, 4.0) | 3′ | 1′, 3′, 4′, 5′ |
| 3′ | 29.1 | 2.10, m, 1.88 m | 2′, 4′ | 1′, 2′, 4′, 5′ |
| 4′ | 24.8 | 1.96, m, 1.90 m | 3′, 5′ | 2′, 3′, 5′ |
| 5′ | 47.0 | 3.57, m | 4′ | 2′, 3′, 4′ |
| Ethyl group | ||||
| 1″ | 61.0 | 4.08, m | 2″ | 1′, 2″ |
| 2″ | 14.1 | 1.16, t (7.3) | 1″ | 1″ |
From 1H to the indicated 13C
The absolute configuration of proline in ethyl tumonoate A (1) was determined by acid hydrolysis followed by derivatization with Marfey’s reagent fluorodinitrophenyl-5-L-valine amide (FDVA) and subsequent LCMS analysis, and revealed that it was of L configuration.24 The absolute configuration of the 3-OH group was determined as S by derivatization with Mosher’s reagent (R/S-MTPA-Cl) followed by 1H NMR data analysis (Figure 3).25 Therefore the absolute configuration of the 2,4-dimethyl-3-hydroxydodec-4-enoic acid was 2R,3S.
Figure 3.

ΔδS-R values around C-3 between the Mosher’s esters of ethyl tumonoate A (1).25
Live filaments from cultured specimens of cf. O. margaritifera were screened by MALDI-TOF-MS for methyl and ethyl tumonoates to confirm that these molecules were real secondary metabolites and not isolation artifacts. Molecular weights of m/z 368 [M+H]+ and m/z 562.2 [M+Na]+ were detected, corresponding to ethyl tumonoate A and methyl tumonoate B, respectively. Methyl esters of NRPS-type metabolites have been shown to be produced in other bacteria by an unusual S-adenosyl-L-methionine (SAM)-dependent methyl-transferase.26 Additionally, naturally-occurring methyl esters have been found as natural products in other cyanobacterial collections.11 From the MALDI-TOF MS experiments described above and this precedence, we conclude that the ethyl group of compound 1 and methyl group of methyl tumonoate B are true natural products of cf. O. margaritifera.
Ethyl tumonoate A (1) shares structural resemblance with a number of other cyanobacterial secondary metabolites, such as the viridamides and the microcolins; the latter are derived from phylogenetically related cyanobacteria (Figure 2). These molecules are composed of 8–12 carbon-long fatty acid chains connected with amino acid moieties, a structure type predicted to be biosynthesized by mixed polyketide synthase (PKS) and non-ribosomal peptide synthetase (NRPS) clusters. Because of the structural similarities of the molecules as well as the evolutionary relatedness of the organisms, these secondary metabolites are likely derived from homologous PKS/NRPS pathways. However, marine cyanobacteria have often been found to contain multiple, genetically different biosynthetic pathways.8,27 Thus, the fact that the venturamides are structurally distinct from the aforementioned secondary metabolites is most likely explained by their biosynthesis involving paralogous genetic pathways. The venturamides appear structurally more similar to trichamide, a metabolite isolated from the related cyanobacterium Trichodesmium erythraeum IMS 101.
The structural resemblance of the tumonoic acids to bacterial homoserine lactones stimulated investigations into the quorum sensing activities of these molecules.19 In fact, several of the tumonoic acids moderately inhibit cell-to-cell communication, resulting in a reduction in bioluminescence in Vibrio harveyi.19 Similarly, the potent immunosuppressive activity in the structurally and evolutionary related microcolins A and B was a rationale for testing ethyl tumonoate A for these activities.28 Ethyl tumonoate A (1) showed in vitro anti-inflammatory activity in the RAW264.7 murine macrophage cell-based nitric oxide assay with an IC50 of 9.8 μM (3.6 μg/mL) with little or no cytotoxicity. Additionally, only a low level of toxicity was observed at concentrations of 10 μg/mL or higher against H-460 human lung tumor cells. The low toxicity of ethyl tumonoate A (1) corresponds with the lack of toxicity previously reported for related tumonoic acid analogs.19,21
The original VLC fractions were also screened for their ability to activate or suppress calcium flux in neocortical neurons. VLC fractions E and F produced calcium influx at high concentrations (0.05 mg/mL), while fractions E, F, and G suppressed spontaneous calcium oscillations at lower concentrations. Because these fractions predominately contained the tumonoic acids, these metabolites were isolated and individually tested as pure compounds in the same assay. While ethyl tumonoate A at 10 μM produced a nearly complete inhibition of Ca2+ oscillations, tumonoic acids A and F showed partial inhibition at this concentration, and tumonoic acid G was completely inactive.
Conclusions
Evolutionary relationships inferred from common house-keeping genes have had an enormous impact on cyanobacterial taxonomy and systematics.10 Moreover, phylogenetics has been increasingly informative for natural products research in the characterization, comparison and recollection of natural products-producing organisms. In this study, we demonstrated a direct correlation between phylogenetics and class of secondary metabolite production in marine cyanobacteria. It should be noted that in fresh-water cyanobacteria, secondary metabolites such as microcystins and cylindrospermopsins, have been reported from phylogenetically unrelated genera.29 However, the evolutions of the biosynthetic pathways encoding these toxins have not been firmly established, whether evolved from an ancient ancestor followed by gene loss in non-producing taxa or being laterally transferred.29 The direct correlation found in marine cyanobacteria allows for the prediction of orthologous biosynthetic pathways and production of specific secondary metabolites. Herein, we applied this knowledge to investigate related but geographically distant cyanobacterial populations for new bioactive secondary metabolites. This phylogeny-guided isolation approach led to the discovery of ethyl tumonoate A, a new tumonoic acid derivative with anti-inflammatory and ion modulation activities.
Experimental Section
General Experimental Procedures
Optical rotations were measured on a JASCO P-2000 polarimeter and IR spectra on a ThermoElectron Nicolet IR100 FT-IR spectrometer. NMR spectra were recorded with chloroform as an internal standard (δC 77.2, δH 7.26) on a Bruker 600 MHz spectrometer (600 and 150 MHz for 1H and 13C NMR, respectively) equipped with 1.7 mm MicroCryoProbe. LR- and HR-ESI-MS were obtained on a ThermoFinnigan LCQ Advantage Max mass detector and Thermo Scientific LTQ-XL Orbitrap mass spectrometer, respectively. LCMS analysis was carried out on a Finnigan LCQ Advantage Max spectrometer with a Finnigan Surveyor HPLC system equipped with Thermo Finnigan Surveyor PDA plus detector. HPLC was performed using a Waters 515 pumps and Waters 996 photodiode array detector.
Sampling and Taxonomic Characterization
Cyanobacterial strains were collected by SCUBA or snorkeling from the following four sites along the leeward coast of Curaçao, Netherlands Antilles: NAC8-45 (Marie Pampoen; harbor inlet; 12° 05′47.22 N, 68° 54′54.54 W; 2–3 m depth), NAC8-46 (Caracas baii; coral reef; 12° 04′31.48 N, 68° 51′49.37 W; 8–10 m depth), NAC8-54 (Pierbaai reef; coral reef; 12° 05′40.07 N, 68° 54′47.55 W; 8–10 m depth), and NAC8-55 (Jan Theil baii; coral reef; 12° 04′33.80 N, 68° 52′54.55 W; 3–4 m depth). Specimens were cleaned from macro-flora/fauna under a dissecting scope. Algal tissue (ca. 200 mg) was preserved for genetic analysis in 10 mL RNAlater (Ambion), for chemical analysis in seawater/EtOH (1:1) at −20 °C, and in seawater filtered through 0.2 μm Acrodisc Syringe filters (PALL Life Sciences) for culturing and morphological analysis. Morphological characterizations were performed using an Olympus IX51 epifluorescent microscope (100X) equipped with an Olympus U-CMAD3 camera. Taxonomic identification of cyanobacterial specimens was performed in accordance with modern phycological systems.10,17
Polymerase Chain Reaction (PCR) and Cloning
Genomic DNA was extracted using the Wizard Genomic DNA Purification Kit (Promega Inc.) following the manufacturer’s specifications. DNA concentration and purity were measured on a DU® 800 spectrophotometer (Beckman Coulter). The 16S rRNA genes were PCR-amplified from isolated DNA using the cyanobacteria-specific primers, 106F and 1509R, as previously described.30 The PCR reaction volumes were 25 μL containing 0.5 μL (~50 ng) of DNA, 2.5 μL of 10 x PfuUltra IV reaction buffer, 0.5 μL (25 mM) of dNTP mix, 0.5 μL of each primer (10 μM), 0.5 μL of PfuUltra IV fusion HS DNA polymerase and 20.5 μL dH2O. The PCR reactions were performed in an Eppendorf Mastercycler gradient as follows: initial denaturation for 2 min at 95 °C, 25 cycles of amplification: 20 sec at 95 °C, 20 sec at 50 °C and 1.5 min at 72 °C, and final elongation for 3 min at 72 °C. PCR products were purified using a MinElute PCR Purification Kit (Qiagen) before subcloned using the Zero Blunt TOPO PCR Cloning Kit (Invitrogen) following the manufacturer’s specifications. Plasmid DNA was isolated using the QIAprep Spin Miniprep Kit (Qiagen) and sequenced with M13 primers. The gene sequences are available in the DDBJ/EMBL/GenBank databases under acc. No.: GU724196, GU724197, GU724207 and GU724208.
Phylogenetic Inference
Gene sequences were aligned bi-directionally using the L-INS-i algorithm in MAFFT 6.717. A total of 1,378 bp (310 parsimony informative sites) of the 16S rRNA gene were analyzed without data exclusion. The evolutionary distant unicellular cyanobacterium Gloeobacter violaceus PCC 7421T (NC005125) was included as an out-group. Representative type-strains (T) were selected from Bergey’s Manual.17 Phylogenetic analyses were compared using the Maximum Likelihood (ML), Bayesian inference and Maximum parsimony (MP) methods. Appropriate nucleotide substitution models were compared and selected using uncorrected/corrected Akaike Information Criterion (AIC/AICc), Bayesian Information Criterion (BIC), and the Decision-theoretic (DT) in jModelTest 0.1.1. Bayesian analysis was conducted using MrBayes 3.1.31 The AIC1, AIC2, DIC and BIC criteria all selected GTR+I+G as the optimum model. The Markov chains, one cold and three heated were run for 3,000,000 generations. The Maximum Likelihood (ML) inference was performed using PhyML v2.4.4.32 The analysis was run using the GTR+I+G model with 1,000 bootstrap replicates. The maximum parsimony (MP) analysis was performed in PAUP* 4.0b10 using a heuristic search through the branch-swapping tree-bisection-reconnection (TBR) algorithm with the addition of 10,000 random replicates to find the most parsimonious tree. Bootstrap support was obtained from 1,000 replicates.
Isolation and Structure Elucidation
Biomass of each cyanobacterial specimen was extracted exhaustively with CH2Cl2–MeOH (2:1). The extracts were fractionated by silica gel VLC using a stepwise gradient from 100% hexanes to 100% MeOH in nine fractions (A–I) of increasing polarity. VLC-fractions were purified over a 500 mg C-18 Sep-Pak followed by RP HPLC (Phenomenex Jupiter 10 μm C18, 300 Å, 10×250 mm, 85% CH3OH/H2O at 3 mL/min). For MALDI-TOF-MS, each specimen (5–10 μg wet wt.) was extracted with 1 μg/μL of matrix solution (70 mg/mL alpha-cyano-4-hydroxycinnamic acid and 2,5-dihydroxybenzoic acid (1:1), 750 μL CH3CN, 248 μL dH2O, 2 μL trifluoroacetic acid) in 96-well plastic plates for 20–30 sec. One μL of matrix extract was deposited on the well of a Bruker Microflex MSP 96 Stainless Steel Target Plate and run on a Bruker Microflex mass spectrometer equipped with flexControl 3.0.
Ethyl Tumonoate A (1)
pale yellow oil; [α]D25 −77.5 (c 1.0, CHCl3); IR (neat) νmax 1733, 1630 cm−1; 1H, 13C and 2D NMR data, see Table 2; HRESIMS m/z [M+Na]+ 390.2617 (calcd for C21H37NO4Na, 390.2620).
Absolute Configuration of the Proline Residue in Ethyl Tumonoate A (1) by Marfey’s Method.24
Ethyl tumonoate A (100 μg) was treated with 100 μL of 6 N HCl at 110 °C for 30 min. The reaction products obtained following lyophilization of the crude reaction mixture were dissolved in 100 μL of H2O and re-lyophilized. The dried hydrolysate was dissolved in 100 μL of 1 M NaHCO3 and then 25 μL of 1% L-FDVA (1-fluoro-2,4-dinitrophenyl-5-L-valine amide) in acetone was added. The solution was vortexed and incubated at 40 °C for 60 min. The reaction was quenched by the addition of 25 μL of 2 N HCl, diluted with 100 μL of MeOH, and then a 10 μL aliquot was analyzed by LC-MS using the following RP HPLC conditions: [(HP Lichrosphere 100 RP-18 column, 5.0 μm, 4.0×125 mm) with a stepped gradient elution of 0.1% trifluoroacetic acid in H2O (eluent A) and 100% CH3CN (eluent B); gradient program 0–5 min, B, 30%, 5–25 min; B, 30–70%, flow rate, 500 μL/min]. The Marfey derivatives of authentic D- and L-Pro eluted at 15.88 and 13.74 min, respectively. The Marfey derivative from acid hydrolysates of 1 was eluted at 13.47 min, and coinjection with the authentic L-Pro derivative gave a single peak.
Absolute Configuration of the 3-Hydroxy Group of Ethyl Tumonoate A (1) by Mosher’s Method.25
Dried compound 1 (1 mg) was dissolved in 200 μL of anhydrous pyridine, and a catalytic amount of DMAP (4-dimethylaminopyridine) and an excess amount of (R)-MTPA-Cl were added. The reaction vial was maintained at room temperature for 24 h, and the reaction progress was monitored by NP TLC. The (S)-MTPA ester of 1 was isolated by preparative NP TLC with a developing solvent of hexanes–EtOAc (1:1) and an eluent of 100% EtOAc. Using the same procedure with (S)-MTPA-Cl, the (R)-MTPA ester of 1 was also obtained. The absolute configuration of the 3-hydroxy group was determined by 1H NMR analysis of the (R)/(S)-MTPA esters (see Supporting Information).
3-(S)-MTPA Ester of Ethyl Tumonoate A (1)
Pale yellow oil; 1H NMR (CDCl3, 600 MHz) δH 5.79 (1H, t, J = 7.2 Hz, H-5), 5.61 (1H, d, J = 10.6 Hz, H-3), 4.15 (2H, m, H-1″), 4.14 (1H, m, H-2′), 3.56 (1H, m, H-5′a), 3.47 (1H, m, H-5′b), 2.96 (1H, dq, J = 10.6, 6.9 Hz, H-2), 2.07 (2H, m, H-6), 1.94 (1H, m, H-4′a), 1.93 (1H, m, H-3′a), 1.86 (1H, m, H-3′b), 1.77 (1H, m, H-4′b), 1.64 (3H, s, 4-Me), 1.37 (2H, dd, J = 13.3, 6.9 Hz, H-7), 1.32–1.21 (8H, m, H-8, H-9, H-10, H-11), 1.25 (3H, t, J = 7.1 Hz, H-2″), 1.01 (3H, d, J = 7.0 Hz, 2-Me), 0.87 (3H, t, J = 7.1 Hz, 3H); LR ESIMS m/z 583.94 [M+H]+, 606.17 [M+Na]+.
3-(R)-MTPA Ester of Ethyl Tumonoate A (1)
Pale yellow oil; 1H NMR (CDCl3, 600 MHz) δH 5.72 (1H, t, J = 6.9 Hz, H-5), 5.50 (1H, d, J = 10.6 Hz, H-3), 4.36 (1H, dd, J = 7.9 Hz, H-2′), 4.18 (2H, m, H-1″), 3.59 (1H, m, H-5′a), 3.52 (1H, m, H-5′b), 2.95 (1H, dq, J = 10.7, 6.9 Hz, H-2), 2.05 (2H, m, H-6), 1.98 (1H, m, H-3′a), 1.96 (1H, m, H-4′a), 1.91 (1H, m, H-3′b), 1.80 (1H, m, H-4′b), 1.49 (3H, s, 4-Me), 1.36 (2H, m, H-7), 1.33–1.20 (8H, m, H-8, H-9, H-10, H-11), 1.27 (3H, t, J = 7.1 Hz, H-2″), 1.03 (3H, d, J = 6.9 Hz, 2-Me), 0.87 (3H, t, J = 6.6 Hz, 3H); LR ESIMS m/z 583.82 [M+H]+, 606.11 [M+Na]+.
Nitric oxide Assay
Cells from the mouse macrophage cell line RAW264.7 (ATCC; Manassas, VA) were cultured in DMEM with 4 mM L-glutamine and 4.5 g/L glucose supplemented with 10% fetal bovine serum (FBS), penicillin, and streptomycin. Unless otherwise stated RAW264.7 cells were seeded in 96-well plates (5 × 10⁴ cells/well), and after settling for 1 day they were stimulated with 3 μg/mL LPS in the absence or presence of ethyltumonate A (1 to 10 μg/mL) for 24 h in triplicate wells at 37 °C with 5% CO2. The generation of NO was assessed in the supernatant of cell cultures by quantification of nitrite using the Griess reaction.33 In brief, 50 μL of each supernatant were added to 96-well plates together with 50 μL 1% sulfanilamide in 5% phosphoric acid plus 50 μL 0.1% naphthylenediamine dihydrochloride NED in H2O, and the optical density was measured at 570 nm. The IC50 value, the sample concentration resulting in 50% inhibition of NO production, was determined using non-linear regression analysis (% nitrite versus concentration). Cytotoxicity was measured in NCI H-460 human lung carcinoma cells using the MTT assay. 33 Cells were seeded in 96-well plates at 3.3 × 10⁴ cells/mL in 180 μL of RPMI 1640 medium with 10% FBS. After overnight recovery, the test compounds were dissolved in DMSO and diluted into medium without FBS and then added to the wells (tested at final concentrations of 30 and 3 μg/mL). After 48 h, cell viability was determined by MTT staining.
Neocortical Neuron Culture
Primary cultures of neocortical neurons were obtained from embryonic day 16 Swiss-Webster mice. Briefly, pregnant mice were euthanized by CO2 asphyxiation, and embryos were removed under sterile conditions. Neocortices were collected, stripped of meninges, minced by trituration with a Pasteur pipette and treated with trypsin for 25 min at 37 °C. The cells were then dissociated by two successive trituration and sedimentation steps in soybean trypsin inhibitor and DNase containing isolation buffer, centrifuged and resuspended in Eagle’s minimal essential medium with Earle’s salt (MEM) and supplemented with 1 mM L-glutamine, 10% FBS, 10% horse serum, 100 IU/mL penicillin and 0.10 mg/mL streptomycin, pH 7.4. Cells were plated onto poly-L-lysine-coated 96-well (9 mm) clear-bottomed black-well culture plates (Costar) at a density of 1.5 × 10⁵ cells/well. Cells were then incubated at 37 °C in a 5% CO2 and 95% humidity atmosphere. Cytosine arabinoside (10 μM) was added to the culture medium on day 2 after plating to prevent proliferation of nonneuronal cells. The culture media was changed on days 5 and 7 using a serum-free growth medium containing Neurobasal Medium supplemented with B-27, 100 IU/mL penicillin, 0.10 mg/mL streptomycin, and 0.2 mM L-glutamine. Neocortical cultures were used in experiments between 8–13 days in vitro (DIV). All animal use protocols were approved by the Institutional Animal Care and Use Committee (IACUC).
Intracellular Ca2+ Monitoring
Neocortical neurons grown in 96-well plates were used for [Ca2+]i measurements at 12–13 DIV. Briefly, the growth medium was removed and replaced with dye loading buffer (50 μL/well) containing 4 μM fluo-3 and 0.04% pluronic acid F-127 in Locke’s buffer (8.6 mM Hepes, 5.6 mM KCl, 154 mM NaCl, 5.6 mM glucose, 1.0 mM MgCl2, 2.3 mM CaCl2, 0.0001 mM glycine, pH 7.4). After 1 h incubation in dye loading buffer, the neurons were washed four times in fresh Locke’s buffer (200 μL/well) using an automated cell washer (BioTek instrument) and transferred to a FLEXstation II (Molecular Devices). The final volume of Locke’s buffer in each well was 150 μL. Cells were excited at 485 nm and Ca2+-bound Fluo-3 emission was detected at 535 nm.
Data Analysis
Time-response and concentration-response graphs were generated using Graphpad Prism software (Graphpad Software). The EC50 values were determined by non-linear regression analysis using a logistic equation.
Supplementary Material
Acknowledgments
We dedicate this work to J. Komárek for his contributions to cyanobacterial taxonomy. We gratefully acknowledge the government of Curaçao for collection permits and the CARMABI Research Station for assistance and research support. We also thank J. Nunnery for assistance with the cyanobacterial collections. This research was supported by the Halliday award (SIO) and NIH Grant NS 053398.
Footnotes
Supporting Information Available: LR and HR ESIMS, one-dimensional (1H and 13C) and two-dimensional (COSY, HSQC and HMBC) NMR spectra of ethyl tumonoate A (1) and 1H NMR spectra of (S)- and (R)-MTPA esters of ethyl tumonoate A. This material is available free of charge via the Internet at http://pubs.acs.org.
References and Notes
- 1.Tan LT. Phytochemistry. 2007;68:954–979. doi: 10.1016/j.phytochem.2007.01.012. [DOI] [PubMed] [Google Scholar]
- 2.Gerwick WH, Coates RC, Engene N, Gerwick LG, Grindberg R, Jones A, Sorrels C. Microbe. 2008;3:277–284. [Google Scholar]
- 3.Sharp K, Arthur KE, Gu L, Ross C, Harrison G, Gunasekera SP, Meickle T, Matthew S, Luesch H, Thacker RW, Sherman DH, Paul VJ. Appl Env Microbiol. 2009;75:2879–2888. doi: 10.1128/AEM.02656-08. [DOI] [PMC free article] [PubMed] [Google Scholar]
- 4.Gerwick WH. Ocean Agenda 21: Passages to the Pacific Century. Oregon State University Sea Grant; 1989. pp. 59–65. [Google Scholar]
- 5.Wilmotte A, Herdman M. Bergey’s Manual of Systematic Bacteriology. 2. Springer; New York: 2001. pp. 487–493. [Google Scholar]
- 6.Komárek J. Algae. 2006;21:349–375. [Google Scholar]
- 7.Sumina EL. Microbiology. 2006;75:459–464. [Google Scholar]
- 8.Engene N, Choi H, Esquenazi E, Rottacker EC, Ellisman MH, Dorrestein PC, Gerwick WH. Environ Microbiol. doi: 10.1111/j.1462-2920.2011. In press. [DOI] [PMC free article] [PubMed] [Google Scholar]
- 9.Hoffman L, Komárek J, Kaštovsk J. Arch Hydrobiol. 2005;159:95–115. [Google Scholar]
- 10.Komárek J, Anagnostidis K. In: Süßwasserflora von Mitteleuropa. 2 Büdel B, Gärtner G, Krienitz L, Schagerl M, editors. Vol. 19. Gustav Fischer; Jena: 2005. [Google Scholar]
- 11.Simmons TL, Engene N, Ureña LD, Romero LI, Ortega-Barría E, Gerwick L, Gerwick WH. J Nat Prod. 2008;71:1544–1550. doi: 10.1021/np800110e. [DOI] [PMC free article] [PubMed] [Google Scholar]
- 12.Simmons TL, Coates RC, Clark BR, Engene N, Gonzalez D, Esquenazi E, Dorrestein PC, Gerwick WH. Proc Natl Acad Sci U S A. 2008;105:4587–4594. doi: 10.1073/pnas.0709851105. [DOI] [PMC free article] [PubMed] [Google Scholar]
- 13.Taniguchi M, Nunnery JK, Engene N, Esquenazi E, Byrum T, Dorrestein PC, Gerwick WH. J Nat Prod. 2009;73:393–398. doi: 10.1021/np900428h. [DOI] [PMC free article] [PubMed] [Google Scholar]
- 14.Tidgewell K, Engene N, Byrum T, Media J, Doi T, Valeriote FA, Gerwick WH. J ChemBioChem. 2010;11:1458–1466. doi: 10.1002/cbic.201000070. [DOI] [PMC free article] [PubMed] [Google Scholar]
- 15.Thacker RW, Paul VJ. Appl Env Microbiol. 2004;70:3305–3312. doi: 10.1128/AEM.70.6.3305-3312.2004. [DOI] [PMC free article] [PubMed] [Google Scholar]
- 16.Meterological service of Netherlands Antilles and Aruba. ( http://www.weather.an/reports/documents/EffectsofOmar.pdf)
- 17.Castenholz RW. Bergey’s Manual of Systematic Bacteriology. 2. Springer; New York: 2001. pp. 474–487. [Google Scholar]
- 18.Engene N, Coates RC, Gerwick WH. J Phycol. 2010;46:591–601. [Google Scholar]
- 19.Clark BR, Engene N, Teasdale ME, Rowley DC, Matainaho T, Valeriote FA, Gerwick WH. J Nat Prod. 2008;71:1530–1537. doi: 10.1021/np800088a. [DOI] [PMC free article] [PubMed] [Google Scholar]
- 20.Abed RM, Palinska KA, Camoin G, Gulobic S. FEMS Microbiol Lett. 2006;260:171–177. doi: 10.1111/j.1574-6968.2006.00321.x. [DOI] [PubMed] [Google Scholar]
- 21.Harrigan GG, Luesch H, Yoshida WY, Moore RE, Nagle DG, Biggs J, Park PU, Paul VJ. J Nat Prod. 1999;62:464–467. doi: 10.1021/np980460u. [DOI] [PubMed] [Google Scholar]
- 22.Paik S, Carmeli S, Cullingham J, Moore RE, Patterson GML, Tius MA. J Am Chem Soc. 1994;116:8116–8125. [Google Scholar]
- 23.Dorman DE, Borvey FA. J Org Chem. 1973;38:1719–1722. [Google Scholar]
- 24.Marfey P. Carlsberg Res Commun. 1984;49:591–596. [Google Scholar]
- 25.Dale JA, Dull DL, Mosher HS. J Org Chem. 1969;34:2543–2549. [Google Scholar]
- 26.Weinig S, Hecht HJ, Mahmud T, Müller R. Chem Biol. 2003;10:939–952. doi: 10.1016/j.chembiol.2003.09.012. [DOI] [PubMed] [Google Scholar]
- 27.Jones AC, Monroe EA, Podell S, Hess W, Klages S, Esquenazi E, Niessen S, Hoover H, Rothmann M, Lasken R, Yates JR, III, Reinhardt R, Kube M, Burkart M, Allen EE, Dorrestein PC, Gerwick WH, Gerwick L. Proc Natl Acad Sci U S A. doi: 10.1073/pnas.1101137108. in press. [DOI] [PMC free article] [PubMed] [Google Scholar]
- 28.Zhang LH, Longley RE, Koehn FE. Life Sci. 1997;60:751–762. doi: 10.1016/s0024-3205(96)00645-5. [DOI] [PubMed] [Google Scholar]
- 29.Stüken A, Jakobsen KS. Microbiol. 2010;156:2438–2451. doi: 10.1099/mic.0.036988-0. [DOI] [PubMed] [Google Scholar]
- 30.Nübel U, Garcia-Pichel F, Muyzer G. Appl Environ Microbiol. 1997;63:3327–3332. doi: 10.1128/aem.63.8.3327-3332.1997. [DOI] [PMC free article] [PubMed] [Google Scholar]
- 31.Ronquist F, Huelsenbeck JP. Bioinformatics (Oxf) 2003;12:1572–1574. doi: 10.1093/bioinformatics/btg180. [DOI] [PubMed] [Google Scholar]
- 32.Guindon S, Gascuel O. System Biol. 2003;52:696–704. doi: 10.1080/10635150390235520. [DOI] [PubMed] [Google Scholar]
- 33.Green LC, Wagner DA, Glogowski J, Skipper PL, Wishnok JS, Tannenbaum SR. Anal Biochem. 1982;126:131–138. doi: 10.1016/0003-2697(82)90118-x. [DOI] [PubMed] [Google Scholar]
- 34.Mosman T. J Immunol Methods. 1983;65:55–63. doi: 10.1016/0022-1759(83)90303-4. [DOI] [PubMed] [Google Scholar]
Associated Data
This section collects any data citations, data availability statements, or supplementary materials included in this article.