Abstract
Increased dispersion of action potential duration across cardiac tissue has long been considered an important substrate for the development of most electrical arrhythmias. Although this dispersion has been studied previously by characterizing the static intrinsic gradients in cellular electrophysiology and dynamical gradients generated by fast pacing, few studies have concentrated on dispersions generated solely by structural effects. Here we show how boundaries and geometry can produce spatially dependent changes in action potential duration (APD) in homogeneous and isotropic tissue, where all the cells have the same APD in the absence of diffusion. Electrotonic currents due to coupling within the tissue and at the tissue boundaries can generate dispersion, and the profile of this dispersion can change dramatically depending on tissue size and shape, action potential morphology, tissue dimensionality, and stimulus frequency and location. The dispersion generated by pure geometrical effects can be on the order of tens of milliseconds, enough under certain conditions to produce conduction blocks and initiate reentrant waves.
Keywords: electrotonic current, spatial gradients, dispersion of refractoriness, dispersion of repolarization
INTRODUCTION
It is well known that electrical activity in cardiac tissue generally is spatially heterogeneous, with variations in action potential shapes and durations across the tissue [1]. This heterogeneity can arise either from static or dynamical processes. Static heterogeneity generally is associated with intrinsic gradients in cellular electrophysiology [1–6] or cell-to-cell coupling [7,8] occurring throughout the tissue. Even without static heterogeneity, the underlying nonlinear dynamics of cardiac tissue [9,10] can produce bifurcations and heterogeneity in repolarization at fast pacing rates [11,12]. These dynamically induced heterogeneities also can give rise to spatial gradients, such as those associated with spatially concordant and discordant alternans [11–14].
Although standard static and dynamical heterogeneities have been studied widely, very little is known about the role boundaries and geometrical properties play in determining the spatial distribution of action potential properties in tissue. Even when the depolarizing wave propagates at a constant velocity, differences in repolarization can occur from loading effects at the boundaries or site of stimulation. As a result, the action potential duration (APD), which for a given propagating wave is defined at every point as the difference between the repolarization and depolarization times, can vary spatially. The effects of wavefront curvature [15,16], obstacles [17,18], tissue bath [19], boundaries [16,20,21], and interactions with intrinsic heterogeneities [22] have been investigated previously, but other properties like tissue size, shape, and dimensionality as well as stimulus frequency and location, all of which can influence spatial heterogeneity, have not been studied quantitatively. These effects arise even in otherwise homogeneous tissue and are mediated by electrotonic (diffusive) currents between neighboring cells. As a result, the shape of the action potential (AP) [23] also impacts the way in which APD is distributed in tissue.
This manuscript focuses on the importance of tissue structure in determining the spatial distribution of APD in otherwise homogeneous tissue. In particular, we will discuss how properties including tissue geometry, size and dimensionality; stimulus frequency and location; and AP shape all can contribute significantly to the overall spatial distribution of APD in the absence of intrinsic electrophysiological gradients.
METHODS
Models of cardiac action potentials
Two different models of cardiac action potentials were used. In many cases, we used the Fox-McHarg-Gilmour (FMG) model [24], which is a robust description of canine ventricular cells. To demonstrate how action potential shape can influence boundary effects, the three-variable phenomenological model of Cherry and Fenton [23] was used with two different parameter sets that achieve the same action potential duration but with different action potential shapes. For consistency with Ref. [23], we refer to the two parameter sets as Model 1 and Model 2. All initial values and parameter values are as given in the original references, with the exception of four parameters in Model 1, which were adjusted to ensure the conduction velocities of Model 1 and Model 2 were equal and to fine-tune the APDs of the two parameter sets to produce identical values at the stimulus site in a 4 cm × 4 cm square geometry. The modified parameter values for Model 1 are as follows: , , , and τd = 0.18.
Computational methods
The model equations were integrated using the explicit Euler method. For the FMG model, the spatial resolution was 0.0125 cm and the time step size was 0.02 ms. For Model 1 and Model 2, the spatial and temporal resolutions were 0.01 cm and 0.02 ms, respectively. The diffusion coefficient was set to 0.001 cm2/ms, and no-flux boundary conditions were used throughout. As discussed in Ref. [25] and Ref. [26], the values of the time and space steps used are small enough to provide a sufficiently resolved solution. For non-rectangular geometries, the phase-field method [27,28] was used to implement the no-flux boundary conditions. Central stimulus sites were chosen to be the smallest possible square regions able to produce a propagating wave, which in most cases was 7×7 computational nodes for both models. Line stimuli were chosen to be the same width (7 computational nodes) to facilitate comparison. For the three-dimensional cases, spherical regions of diameter 11 nodes were used, and the comparisons in one and two dimensions used linear and circular stimulus regions with the same diameter. The three-dimensional simulations were run in parallel using MPI on 40 processors of the Cray XT3 system at the Pittsburgh Supercomputing Center.
Measurement of depolarization and repolarization times and APD
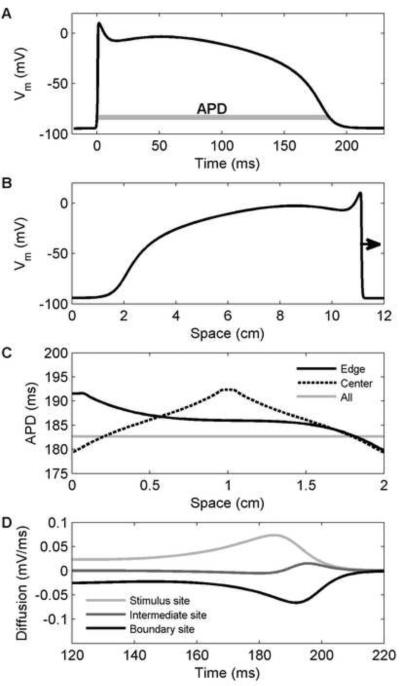
Depolarization time was measured as the time when the voltage reached 10 percent of its full depolarization. Similarly, repolarization time was measured as the time when the voltage repolarized to the same voltage value, corresponding to 90 percent of repolarization to the resting membrane potential. In both cases, linear interpolation was used to obtain more resolved timing data. APD was measured as the difference between the repolarization and depolarization times, as indicated in Fig. 1A. Dispersions in any of these values were measured as the difference between the maximum and minimum values obtained over the entire domain.
Figure 1.
Action potential properties of the Fox-McHarg-Gilmour (FMG) model [24] in a one-dimensional cable. A. Action potential from the center of a cable 2 cm long stimulated at one end. Action potential duration (APD) is indicated. B. Profile of a wave propagating from left to right 220 ms after initiation at the left edge. A long cable (12 cm) was used to fit an entire wavelength. C. Spatial distribution of APD along the cable for a stimulus at the left edge (solid), at the center (dashed), or everywhere (gray) to eliminate the effects of coupling. D. Diffusion currents during repolarization for center stimulus case of panel C at locations within the stimulated region (light gray), at the boundary (black), and halfway between (dark gray). Within the stimulated region, the current is large and positive, which lengthens APD. At the boundary, the current is large and negative, which shortens APD.
RESULTS AND DISCUSSION
Boundary effects in a one-dimensional cable
Boundaries strongly influence the spatial distribution of APD, primarily through alterations in repolarization. Following a centrally applied stimulus, during depolarization, locations at the boundaries show almost no difference from other sites; if propagation occurs at a spatially constant velocity, depolarization time by definition varies linearly with distance from the site of stimulation. However, the reflecting nature of no-flux boundary conditions affects the development of the action potential along the boundary. For example, in a one-dimensional cable, during repolarization most cells find themselves with one neighbor that is more depolarized (farther from the stimulus site) and one neighbor that is more repolarized (closer to the stimulus site); i.e., there is an asymmetry because of the direction of propagation, as shown in Fig. 1B. At the boundary, this condition does not hold; there is no longer a neighbor that is more depolarized. The loss of the more depolarized neighbor at the boundary increases the repolarizing electrotonic current arising from diffusive coupling, thereby accelerating repolarization and shortening APD. In the case where a uniform stimulus is applied to the entire domain, there is no asymmetry, and every cell will produce an APD equal to the APD produced by a single (uncoupled) cell. Fig. 1C shows the spatial profiles that arise for the FMG model in one-dimensional cables stimulated at the left edge, in the center of the cable, or everywhere at once. The non-stimulated edges of the domain for edge and center stimuli have APDs that are substantially shorter than the longest APDs, which occur at the stimulus sites (because during repolarization the neighbors of the stimulus site are always more depolarized, leading to APD prolongation). For sites in between the stimulus location and the boundaries, APD varies smoothly but non-uniformly for sufficiently long cables, with steeper gradients closer to the stimulus site and boundaries. Fig. 1D shows the diffusion currents during repolarization for the case of a center stimulus at locations within the stimulated region (light gray), at the boundary (black), and halfway between (dark gray). During repolarization, the diffusion current is large and positive at the stimulus site, thus prolonging APD, and is large and negative at the boundary, thus shortening APD.
Spatial profiles in square geometries
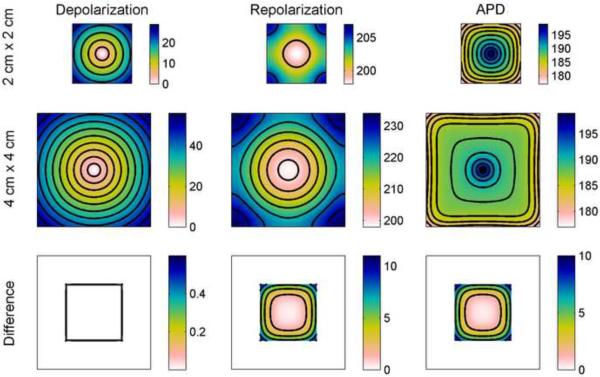
The effects of boundaries on the spatial distribution of APD in two-dimensional domains are similar but result in more complicated spatial patterns. Fig. 2 shows depolarization, repolarization, and APD profiles using the FMG model from small (2 cm × 2 cm) and large (4 cm × 4 cm) square geometries along with a comparison of the data from the interior 2 cm × 2 cm square portion of the larger square with data from the smaller square. Note that all depolarization and repolarization figures panels show isochrones, but in the APD panels the lines represent lines of equal APD. Depolarization proceeds linearly from the centrally located stimulus and isochrones of depolarization time form concentric circles. Differences in depolarization between the small and large squares can be seen only at the boundaries and are slight: the difference in depolarization time at the edge of the small square compared with the corresponding location in the interior of the large square is less than 2 percent. However, the pattern for repolarization is substantially different both qualitatively and quantitatively. Isochrones of repolarization transition from concentric circles near the stimulus site to curves that are normal to the boundaries. Furthermore, in the small square, the dispersion in repolarization time is only 8.0 ms, compared to 27.9 ms for the depolarization time dispersion. In the large square the repolarization dispersion (35.4 ms) is a larger fraction of, but is still significantly smaller than, the depolarization dispersion (55.5 ms), indicating the homogenizing effects of electrotonic coupling over the course of the action potential. The edges of the small square repolarize 10.1 ms earlier than the corresponding locations in the interior of the larger square.
Figure 2.
Spatial distribution of APD in the FMG model in a square geometry. Depolarization and repolarization times (with isochrones 5 ms apart) are shown along with APD (with lines of equal APD 2 ms apart) (all units are ms). Note that all depolarization and repolarization figures panels show isochrones, but in the APD panels the lines represent lines of equal APD. Top row shows data from a 2 cm × 2 cm square and middle row shows data from a larger 4 cm × 4 cm square. Bottom row shows the differences obtained by subtracting the data from the smaller square from the data of the central 2 cm × 2 cm portion of the larger square and indicate a decrease in repolarization time, and consequently in APD, of as much as 10 ms imposed by the boundaries of the smaller square. Isochrones for the difference are 0.2 ms apart for the depolarization difference and 2 ms apart for repolarization and APD differences. Colorbars indicate ms.
APD is defined as the difference between repolarization time and depolarization time and necessarily must smooth out the differences in the isochrone patterns of depolarization and repolarization. This can be seen as a transition in the APD isochrones from circles near the stimulus site to squares with rounded corners closer to the boundary, where APD values are smaller. It is important to note that the “squarish” shape of the spatial APD profile arises from the shape of the domain and the effects of geometry, rather than from insufficient spatial resolution. In fact, the APs are well resolved on both the wave front and the wave back, as seen in Fig. 1B. Fig. 2 also shows APD prolongation near the stimulus site. This occurs because the stimulus site is the first location to repolarize, and its still-depolarized neighbors delay repolarization, the opposite of what is seen at the boundaries. In the larger square, it can be seen that the isochrones are more crowded near the boundaries and near the stimulus site, so that the region in between has smaller APD gradients. The total dispersion in APD is nearly identical for the small and large squares (19.9 ms and 20.1 ms, respectively), a value larger than the dispersion of repolarization in the small square but smaller than the dispersion of repolarization in the large square. For both sizes, the magnitude of the dispersion of depolarization is still the largest, with diffusive coupling making repolarization, and therefore APD, more homogeneous. In comparing the APD at the edge of the smaller square and at the corresponding location in the larger square, it is seen that the repolarization difference is nearly identical to the difference in APD, about 9.6 ms.
Influence of action potential shape through electrotonic currents
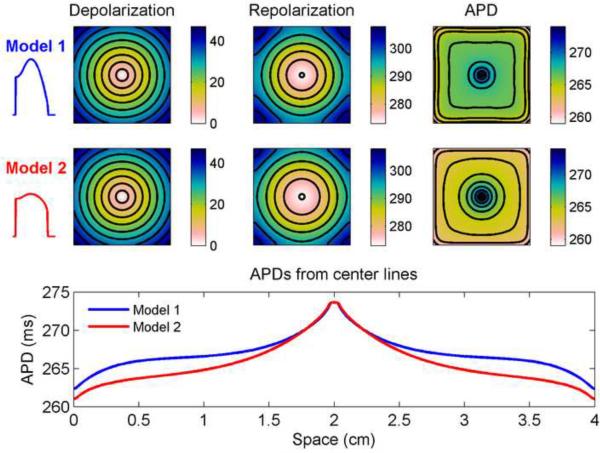
Although the boundaries have a strong effect on the overall distribution of APDs, the shape of the action potential also can have a significant influence on the specific spatial distribution. This is because the boundary effects are mediated through electrotonic currents, which in turn are affected by action potential shape [23]. To illustrate this effect, we used a different model [23] with two different parameter sets that match in stimulus site APD and conduction velocity but have different action potential shapes, as shown in Fig. 3. Model 1 has a slower repolarization phase that gives it a more triangular shape, whereas Model 2 has a faster repolarization phase and a more square shape. Figure 3 shows the depolarization and repolarization times and APD profiles for the two models in a 4 cm × 4 cm square. Depolarization profiles for the two models are nearly identical, as expected, but subtle differences during repolarization contribute to differences in APD. In particular, as shown in the spatial profile of APD through the center of the squares, the APDs match exactly at the stimulus site but reach different minima at the edges, resulting in a larger overall APD dispersion for Model 2 (13 ms) than for Model 1(11 ms). In addition, the spatial profiles differ qualitatively: Model 1's profile is more symmetric, whereas the profile for Model 2 decreases over a longer distance from the stimulus site before reaching its inflection point.
Figure 3.
Spatial distribution of action potential duration (APD) in the model of Ref. [23] using parameter sets corresponding to Model 1 (with a more triangular action potential) and Model 2 (with a more square action potential) in a 4 cm × 4 cm square geometry. Depolarization and repolarization times (with isochrones 5 ms apart) are shown along with APD (with isochrones 1.5 ms apart) (all units are ms). Bottom row shows the spatial distribution of APDs along a horizontal line through the center of the square using the two models. Although the APD at the stimulus site is identical, the two parameter sets produce different APD spatial profiles because their different action potential shapes result in different electrotonic effects. Colorbars indicate ms.
Boundary effects in rectangular geometries
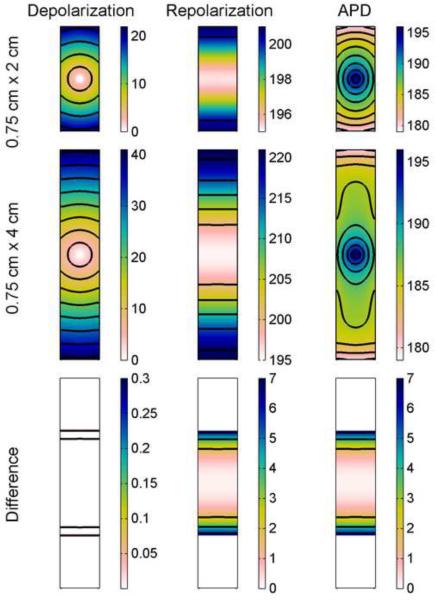
Similar effects can be seen in narrower rectangular geometries that allow the boundary effects from two opposite edges to be felt sooner and more strongly. Fig. 4 shows depolarization and repolarization times along with APD distributions in rectangles 2 and 4 cm long and 0.75 cm wide using the FMG model. In this case depolarization isochrones show a stronger boundary influence from the left and right edges as the wave fronts are pulled normal to the boundaries while they propagate away from the stimulus site, especially in the longer rectangle, where depolarization isochrones are nearly parallel to the top and bottom edges by the time they reach them. Repolarization shows an even stronger influence from the boundaries: all isochrones are essentially parallel to the top and bottom edges, and no indication of the initial radial propagation from the stimulus site can be seen. In the distribution of APD, the isochrones take on a pattern between those of depolarization and those of repolarization, as in the square geometries. In this case, the pattern quickly transitions from circular to elliptical and, after reaching the left and right boundaries, evolves to form lines increasingly parallel to the top and bottom edges. In the larger rectangle, prominent U-shaped isochrones form between the regions with elliptical and parallel isochrones. As in the square geometries, the difference in repolarization times between the smaller rectangle and the same-size interior portion of the larger rectangle is more pronounced than the difference in depolarization times and accounts for the difference in APD. However, the repolarization time dispersion again is small in comparison to the depolarization time dispersion, reaching only 26 and 62 percent of the depolarization time dispersion in the small and large rectangles, respectively. Over the course of the action potential, electrotonic currents between neighboring cells serve to smooth out differences, making repolarization more uniform.
Figure 4.
Spatial distribution of APD in the FMG model in a rectangular geometry. Depolarization and repolarization times (with isochrones 5 ms apart) are shown along with APD (with isochrones 2 ms apart) (all units are ms). Top row shows data from a 0.75 cm × 2 cm rectangle and middle row shows data from a larger 0.75 cm × 4 cm rectangle. Bottom row shows the differences obtained by subtracting data of the smaller rectangle from data from the central 0.75 cm × 2 cm portion of the larger rectangle and indicate a decrease in repolarization time, and consequently in APD, of as much as 7 ms imposed by the boundaries of the smaller rectangle. Isochrones for the difference are 0.2 ms apart for the depolarization difference and 2 ms apart for repolarization and APD differences. Colorbars indicate ms.
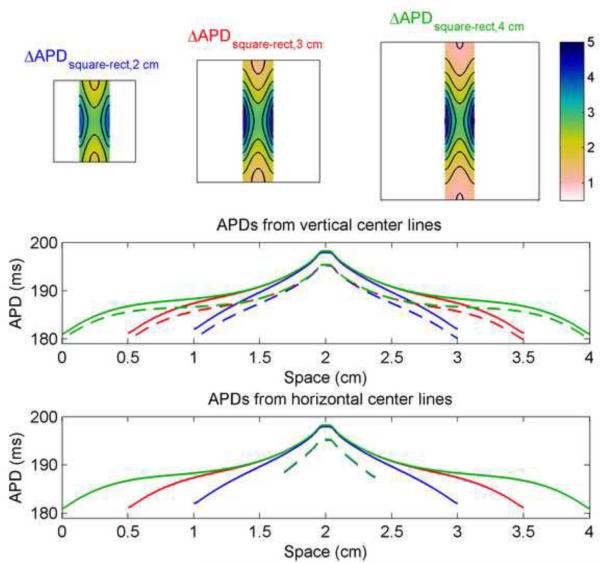
Comparing the APD distributions of the FMG model from the square and rectangular geometries highlights the effects of the closer left and right boundaries in the rectangles, as shown in Fig. 5. The largest differences are concentrated at the left and right edges, but differences in APD are also apparent along the top and bottom edges, especially in the shorter rectangles. Along vertical lines through the centers of the squares and rectangles, the APD spatial profile varies depending on the length and, to a lesser degree, on geometry, with the APD in the rectangles (dashed) decreased by 1–3 ms compared with the APD in the corresponding squares (solid). The profile shape also varies qualitatively, from a steep, nearly linear decrease from center to edge in the smallest geometries to more S-shaped in the largest. Along horizontal lines through the centers, the rectangles show a nearly linear decrease in APD from center to edge, but the APD reached at the edge is 5–7 ms longer than the edge APD values in the corresponding squares. In addition, the edge value reached in the squares depends on the size of the square, with larger squares featuring smaller APDs at the edges.
Figure 5.
Differences in APD between square and rectangular geometries in the FMG model. All rectangles are 0.75 cm wide. Top row shows the differences obtained by subtracting data from rectangles 2 cm, 3 cm, and 4 cm long from data of the central portion of 2 cm × 2 cm, 3 cm × 3 cm, and 4 cm × 4 cm squares, respectively, and indicate a decrease in APD of as much as 5 ms imposed by the boundaries of the rectangle. Isochrones are 0.5 ms apart. Bottom rows show the spatial distribution of APDs along vertical and horizontal lines through the centers of the squares (solid) and rectangles (dashed). Colorbars indicate ms.
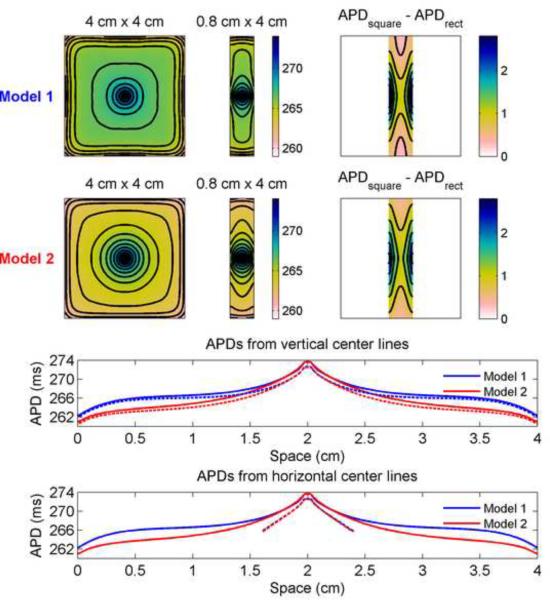
Similar differences can be seen for Model 1 and Model 2, as shown in Fig. 6. Although the APDs along a horizontal center line through the rectangles are nearly identical for the two models, the isochrones for Model 1 transition more quickly away from the circular and elliptical patterns present near the stimulus site and also exhibit sharper gradients in APD close to the boundaries. As a result, compared to Model 2, Model 1 shows a larger region between the stimulus site and the boundaries where APD changes quite slowly and the isochrones are less crowded. In addition, Model 2 exhibits a greater decrease in APD along the top and bottom edges of the rectangle compared to the corresponding square than Model 1 does.
Figure 6.
Differences in APD between 4 cm × 4 cm square and 0.8 cm × 4 cm rectangular geometries using Model 1 and Model 2. Top rows show spatial distributions of APD using the two parameter sets (isochrones 1 ms apart) along with the difference in APD obtained by subtracting the data obtained from the rectangle from the data of the central 0.8 cm × 4 cm portion of the square (isochrones 0.4 ms apart). Bottom rows show the spatial distribution of APD along vertical and horizontal lines through the centers of the squares (solid) and rectangles (dashed). Colorbars indicate ms.
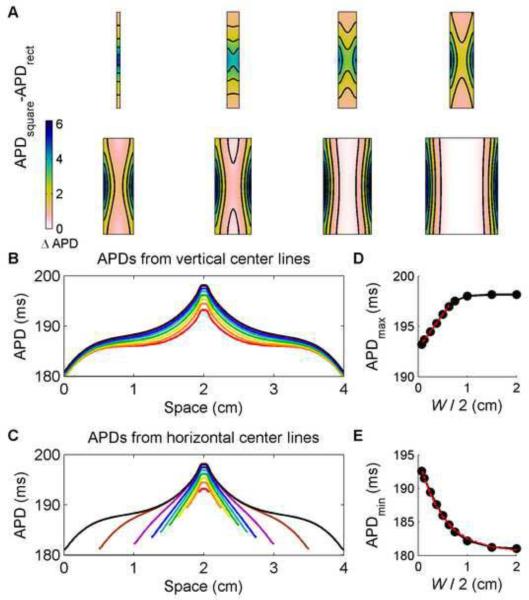
The effects of geometry on APD are further demonstrated in Fig. 7, where the APD distribution using the FMG model in a 4 cm × 4 cm square is compared with rectangles 4 cm long of varying widths. Overall, the narrower rectangles show greater differences in APD in their central regions when compared with the corresponding interior portion of the square, while the wider rectangles show greater differences at the left and right edges but only minimal differences in their interiors, as shown in Fig. 7A–C. Two other trends are apparent. First, the maximum APD, which is achieved at the stimulus site, increases linearly as the rectangle width is increased for narrow widths, as shown in Fig. 7D. For rectangles wider than about 1.4 cm (0.7 cm from the stimulus site to the left and right edges), this dependence begins to disappear, and when the distance from the stimulus site to the edges is at least 1 cm, the APD at the stimulus site saturates and remains essentially independent of width. The decrease in stimulus site APD with decreasing width can be understood as the greater repolarizing influence of closer boundaries felt at the stimulus site. Models 1 and 2 demonstrate similar behavior (not shown), with linear fits of APDmax up to widths of 1.2 cm. A second trend is that the minimum APD reached at the edges decreases exponentially with increasing width. Figure 7E shows this decrease in APD, with the APD saturating as the geometry becomes square. Again, Models 1 and 2 behave similarly (not shown), with a lower value of APDmin reached by Model 2. In other words, narrower domains cannot support dispersions in APD as pronounced as those observed in wider domains. In both cases, boundary effects can be observed at distances larger than the typical value of the space constant for sub-threshold pulses, which is generally estimated to be around 0.35–1 mm [29].
Figure 7.
Differences in APD between square and rectangular geometries of varying widths using the FMG model. A. Differences obtained by subtracting data from rectangles of 8 different widths (0.15, 0.5, 0.75, 1, 1.25, 1.5, 2, and 3 cm) from data from the central portion of a 4 cm × 4 cm square. B. Spatial distribution of APDs along vertical lines through the centers of the rectangles and square. C. Spatial distribution of APDs along horizontal lines through the centers of the rectangles and square. D. Maximum APD values from the rectangles (obtained at the stimulus site) as a function of width. For short widths W, the maximum APD follows a linear function of the distance from the stimulus site (W/2). The maximum APD saturates to a constant value for larger widths. E. Minimum APD values from the rectangles (obtained at the left and right boundaries) as a function of width. The minimum APD values are well approximated by an exponential function of the distance from the stimulus site W/2. Colorbars indicate ms.
Influence of corners in rectangular geometries
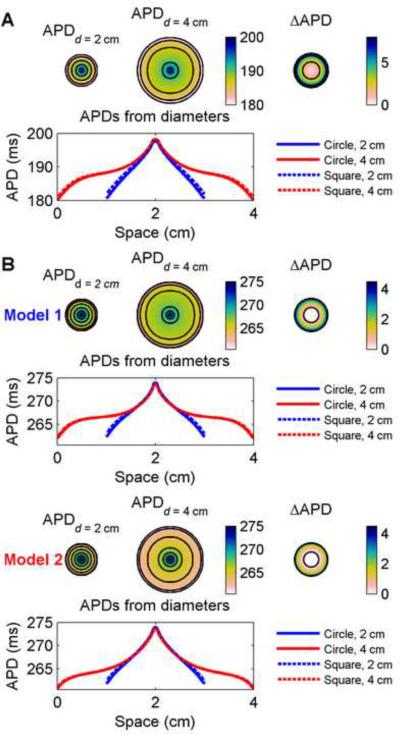
Rectangular geometries, while simple, introduce straight surfaces and 90-degree corners although propagation proceeds radially. To separate the effects of geometry from pure boundary effects, we characterized dispersions in circular geometries with diameters of 2 cm and 4 cm. Fig. 8 shows the spatial distribution of APDs in the two sizes of circles as well as the difference in APD between the smaller circle and the interior of the larger circle. By using circular geometries, the influence of corners, which could potentially serve as current sinks, was eliminated, and curvature effects were controlled because the wavefront curvature was dependent only on the distance from the circle centers. The boundaries of the small circle in this case decreased APD by as much as 7.1 ms for the FMG model and 4.3 and 3.1 ms for Models 1 and 2, respectively, compared with the interiors of the large circles. As shown in Fig. 8B, the spatial profiles differ between Model 1 and Model 2. Because the boundary effects of Model 2 are concentrated further from the stimulus site, with a decreased edge APD and inflection point closer to the edge compared to Model 1, the APD dispersions in both circles are smaller for Model 1 (11.6 and 11.7 ms for the small and large circles, respectively) than for Model 2 (12.1 and 12.9 ms for the small and large circles, respectively). For comparison, the profiles along horizontal center lines from squares whose edges have lengths equal to the circle diameters are shown. The maximum differences between APDs in the circular and square geometries at any location were 1.1 and 0.8 ms for the FMG model, 0.8 and 0.4 ms for Model 1, and 0.7 and 0.3 ms for Model 2 in the 2 and 4 cm diameter circles, respectively. Thus, although the presence of corners further decreases the APD near the edges, the predominant effects arise from the boundaries themselves.
Figure 8.
Spatial distribution of APDs in a circular geometry for (A) the FMG model and for (B) Model 1 and Model 2. APDs are shown for circles 2 cm and 4 cm in diameter (isochrones are 4 ms and 2 ms apart for (A) and (B), respectively). Top right shows the difference obtained by subtracting data from the smaller circle from data from the central 2 cm-diameter circle of the larger circle and indicate a decrease in APD of as much as 8 ms for the FMG model and more than 4 ms for Models 1 and 2 imposed by the boundaries of the smaller circle (isochrones 4 ms apart). Bottom rows show the spatial distribution of APDs along a horizontal diameter of the circles and indicate the influence of boundaries. For comparison, data from horizontal lines through the centers of 2 cm × 2 cm and 4 cm × 4 cm squares are shown (dashed) and indicate the small but observable influence of the corners of the squares. Model 1 and Model 2 show different spatial profiles because of different electrotonic effects. Colorbars indicate ms.
Effects of dimensionality
It has been shown previously [15,16] that large curvature, such as occurs at and near the stimulus site during radial propagation, can prolong APD. Along with curvature, it is also possible that electrotonic loading effects associated with dimensionality can affect APD profiles. To analyze the relative contributions of curvature and electrotonic loading, we calculated depolarization and repolarization times and APD profiles from a one-dimensional (1D) cable, a diameter of a two-dimensional (2D) circle, and a diameter of a three-dimensional (3D) sphere. Because the curvature is identical in the 2D and 3D cases, any differences between 2D and 3D APD profiles cannot arise from curvature effects.
Figure 9 shows depolarization and repolarization time and APD profiles from the three cases for Models 1 and 2. The primary difference occurs at the stimulus site, where the maximum APD increases with the system dimensionality. The APD profiles are different in all three cases, indicating that curvature effects cannot explain the differences between 2D and the 3D. Instead, the depolarization and repolarization time profiles indicate that electrotonic effects are involved. Depolarization times differ slightly at the edges, with the time increasing with dimensionality. Although circular or spherical regions of identical radius were stimulated, electrotonic loading effects made propagation easier in the 1D case, where each excited cell only needed to depolarize one neighbor for successful impulse conduction, and correspondingly more difficult in two and three dimensions, where smaller numbers of cells had to depolarize larger numbers of cells. Hence, propagation begins most quickly in one dimension and most slowly in three dimensions, after which the velocities in all three cases become the same. During repolarization, the situation is reversed. Electrotonic effects from tissue still stimulated are more pronounced with increasing system dimension and thus serve to delay repolarization at the stimulus site. Figure 9 shows that the largest dispersion in the repolarization time profile occurred for the one-dimensional cable and that the smallest dispersion occurred for the three-dimensional sphere. The delayed repolarization associated with higher system dimension therefore resulted in an increased APD at the stimulus site, as well as a slightly decreased reduction in APD at the boundary.
Figure 9.
Influence of dimensionality on the distribution of depolarization and repolarization times and APD on a one-dimensional cable 2 cm long (solid), along a diameter of a two-dimensional circle 2 cm in diameter (dashed), and along a diameter of a three-dimensional sphere 2 cm in diameter (dash-dots). Although the APDs at the boundaries are nearly the same, the APD at the stimulus site increases with dimensionality because of electrotonic effects that increasingly delay repolarization as the dimension increases.
To address the extent to which curvature effects could explain the differences between the 1D and 2D results, we simulated a 1D cable using cylindrical coordinates to incorporate curvature naturally. In this case (not shown), we found that the APD at the stimulus site was about 3 ms longer using cylindrical coordinates, in agreement with previous findings [15,16], and accounted for the majority of the difference between in APD profiles between the 1D and 2D cases. Thus, electrotonic loading effects were more important in explaining the differences between the 2D and 3D simulations than the differences between the 1D and 2D simulations.
Effects of stimulus frequency
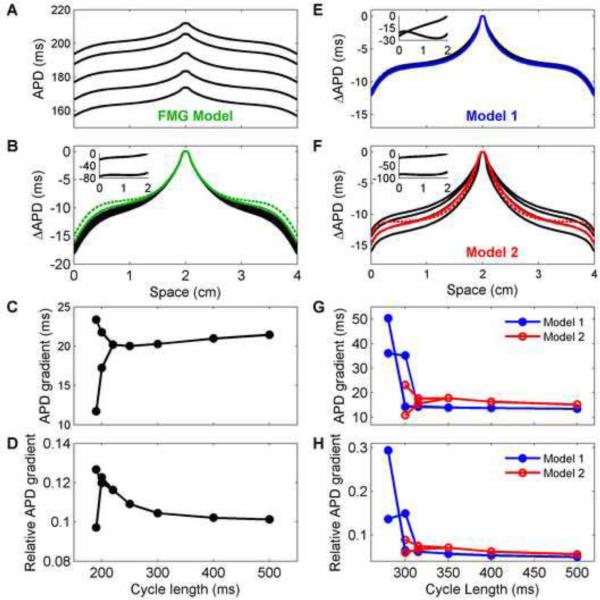
Because electrotonic effects are influenced by action potential shape, which changes as a function of pacing rate, the frequency of stimulation also can affect the spatial distribution of APD, as shown in Fig. 10. For the FMG model, decreasing the cycle length results in decreased APD everywhere in the tissue (Fig. 10A) but very similar profiles. Indeed, by subtracting the APD at the stimulus site and plotting the resulting profiles together (Fig. 10B), the APD profiles are nearly identical, although longer cycle lengths result in slightly decreased APD values at the edges. Fig. 10C shows the APD dispersion between the stimulus site and edges and indicates the reduced APD dispersion as the cycle length is decreased, as well as the dispersions present during long and short beats during alternans. Dividing the APD dispersion by the APD at the stimulus site gives the relative APD dispersion shown in Fig. 10D. Although the absolute dispersions at long cycle lengths are larger, the larger APD values at these cycle lengths result in lower relative dispersions. In addition, the relative dispersions during the long alternans beats appear to fall on the same curve as the relative dispersions outside of the alternans region.
Figure 10.
APD spatial profiles as a function of cycle length using (A–D) the FMG model and (E–H) Models 1 and 2 in a 4 cm × 4 cm square geometry. A. APDs obtained along center lines after pacing for 5 s for cycle lengths of 500, 400, 300, 250, and 220 ms (top to bottom). B. APD profiles plotted as the difference from the APD at the stimulus site. When adjusted for maximum APD, the profiles nearly coincide. The APD difference averaged for long and short cycle lengths is shown for cycle lengths of 200 (color, solid) and 190 ms (color, dashed) for beats 49 and 50 (200 ms) and beats 98 and 99 (190 ms). Insets show differences in APD from the APD at the stimulus site for beats 98 and 99 at a cycle length of 190 ms. C–D. Magnitude of APD dispersion as a function of cycle length (during alternans, dispersions for both long and short action potentials are shown). Although the APD dispersion increases slightly for long cycle lengths, the relative dispersion actually decreases because the APDs themselves are longer. The maximum dispersions occur during alternans, up to a maximum of about 13% of the stimulus site APD. EF. Difference in APD from the APD at the stimulus site obtained along center lines for cycle lengths of 1000, 500, 400, 350 ms (black, top to bottom) after pacing for (5, 5, 4, and 7 s, respectively). The APD difference averaged for long and short cycle lengths is shown for cycle lengths of 315 (color, solid) and 300 ms (color, dashed) for beats 49 and 50 (315 ms) and beats 98 and 99 (300 ms). Insets show differences in APD from the APD at the stimulus site for beats 98 and 99 at a cycle length of 300 ms. For Model 1, as for the FMG model, the profile is nearly independent of cycle length, even for averages during alternans. In contrast, Model 2 experiences larger decreases in APD at the tissue edges as the cycle length is decreased, and the average profiles during alternans have different shapes than the profiles without alternans. G–H. Magnitude of APD dispersion as a function of cycle length (during alternans, dispersions for both long and short action potentials are shown). Both the absolute and relative APD dispersions increase for shorter cycle lengths without alternans for Model 2, whereas only the relative dispersion increases for Model 1. The maximum dispersions during alternans reach a maximum of about 50 percent of the stimulus site APD for Model 1 and about 30 percent for Model 2. For the cycle lengths shown, alternans is discordant at the times indicated only for Model 1 at cycle lengths of 300 and 315 ms.
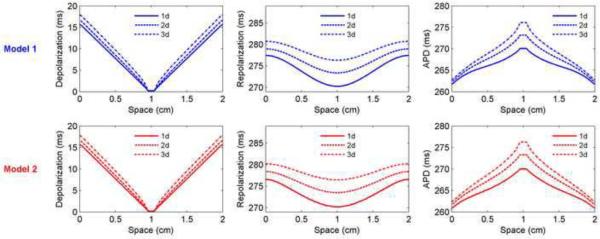
Models 1 and 2 exhibit somewhat different behavior. Subtracting the APD at the stimulus site and plotting profiles from several different cycle lengths together results in superimposed profiles (Fig. 10E) and nearly constant APD dispersions (Fig. 10G–H) for Model 1, but not for Model 2 (Fig. 10F), where shorter cycle lengths produce larger dispersions (Fig. 10G–H). Even the averaged values of the APDs for long and short beats during alternans (shown for two cycle lengths as solid and dashed colors in Fig. 10E and F) aligned with the shifted profiles for Model 1, but not for Model 2, even though the APD dispersions overall are significantly larger during alternans for Model 1.
Influence of stimulus location
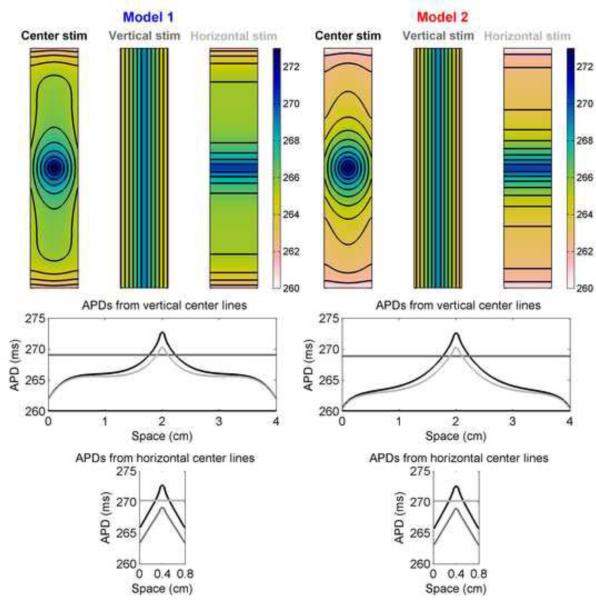
Because the boundaries exhibit significant effects on action potentials, altering the size and location of the stimulus site relative to the boundaries can modify the APD profile. Figure 11 shows how vertical and horizontal stimuli (which effectively transform the domain to be one-dimensional) result in different spatial profiles as well as different maximum and minimum APDs in a rectangular geometry for Models 1 and 2. The center stimulation, not surprisingly, results in the greatest overall dispersion, with the horizontal stimulation achieving a slightly smaller maximum APD because boundary effects are felt sooner when the stimulus spans opposite boundaries. Although the dispersion across the middle horizontally is nearly the same for the center and vertical stimulation sites, the entire profile is shifted negatively toward shorter APDs for the vertical simulation case. The maximum APD is larger for the center stimulus because of electrotonic loading effects associated with dimensionality, as discussed previously. The differences in spatial profiles arising because of different electrotonic currents in the two models are quite apparent. Although the depolarization profiles and the APDs recorded at the stimulus site are nearly identical, the minimum APDs achieved at the edges are smaller for Model 2. Even more striking, APDs are as much as 2.5 ms shorter for Model 2 than for Model 1 at the same location in the interior of the domain (1.5 ms shorter at the boundaries), despite identical APDs at the stimulus site.
Figure 11.
APD distributions in a 0.75 cm × 4 cm rectangle as a function of stimulus location using Models 1 and 2. Top row shows APD distributions obtained from center, vertical strip, and horizontal strip stimuli. Isochrones are 1 ms apart. Bottom rows show the spatial distribution of APDs along vertical and horizontal lines through the centers of the rectangles. Colorbars indicate ms.
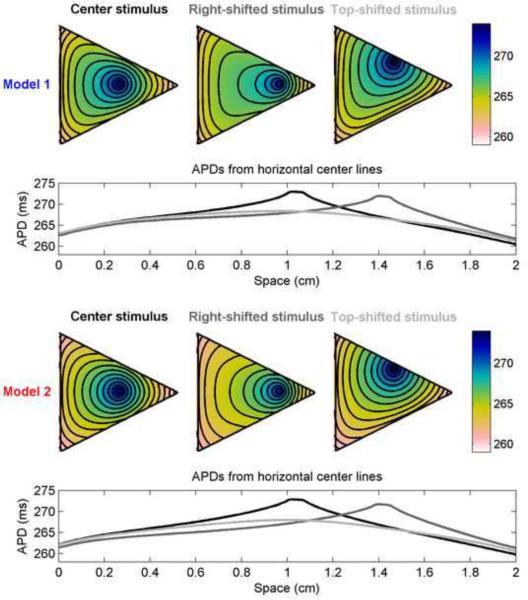
With more complex geometries and different variations in stimulus site, APD profiles can become increasingly complex. Figure 12 shows APD distributions from Models 1 and 2 in a triangular geometry with three different stimulus locations. The maximum and minimum APD values, the overall APD dispersion, and the shape of the distribution can vary significantly. For instance, the maximum APD and APD dispersion along horizontal center lines are largest for the top-shifted stimulus and smallest for the right-shifted stimulus, with Model 2 producing larger dispersions despite having slightly smaller APDmax values. The overall dispersions in APD are 12.8, 11.3 ms, and 13.0 ms for Model 1 and 13.5, 12.1, and 14.0 ms for Model 2 for the center, right-shifted, and top-shifted stimulus locations, respectively.
Figure 12.
Spatial distribution of APDs in a triangular geometry using Models 1 and 2 for different stimulus sites. Top rows show APDs throughout the triangles with stimuli located near the center (left, black), shifted toward the right (center, dark gray), and shifted toward the top (right, light gray); stimulus site corresponds to the site of maximum APD. Isochrones are 1 ms apart. Geometry is an isosceles triangle with a base and height measuring 2 cm, so that it fits within a 2 cm × 2 cm square. Bottom rows show the APDs along horizontal lines through the centers of the triangles. The distribution of APDs depends strongly on the site of stimulation. Colorbars indicate ms.
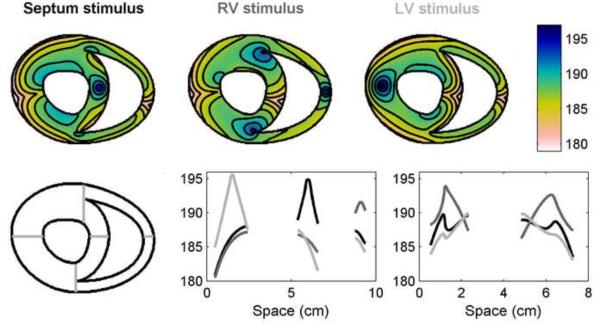
Similar behavior can be seen for the FMG model in a geometry corresponding to a transverse slice of canine ventricles [30]. Figure 13 shows the APD distributions arising from stimuli located in the septum, right ventricle (RV), and left ventricle (LV). Along with expected APD maxima located at the stimulus site and decreased APDs near the boundaries, other new phenomena emerge. For example, APD is decreased at sites where wave fronts propagating toward each other collide (in the LV and RV for the septum stimulus, in the LV and septum for the RV stimulus, and in the septum and RV for the LV stimulus). In addition, APD is prolonged secondary to propagation slowing when the wave must travel around the sharp cusps where the RV and septum meet. This prolongation is especially pronounced with the RV stimulus and is present to a smaller degree with the septum stimulus. For the LV stimulus case, this prolongation does not occur because the wave does not need to make the sharp bend around the cusps. The prolongation is also absent in all cases in the LV because of the smooth geometry of the LV chamber (no cusps are present).
Figure 13.
Spatial distribution of APDs in a two-dimensional slice of a canine ventricular anatomy using the FMG model. Top row shows APDs throughout the slice with stimuli located in the septum (left, black), right ventricle (RV, center, dark gray), and left ventricle (LV, right, light gray; stimulus site corresponds to the site of maximum APD. Isochrones are 2 ms apart. Bottom row shows the APDs along a horizontal line through the center of the slice (center) and through two separate vertical lines through the anterior and posterior regions where the right ventricular chamber terminates (right). The positions of the horizontal and vertical lines within the slice are indicated on the left. Colorbars indicate ms.
In examining APD profiles within the tissue along a horizontal section, significant differences can be seen, as shown in the lower panels of Fig. 13. In the center panel, the profiles pass through the stimulus site in all cases, but the APD achieved at the stimulus location depends on the distance from the stimulus to the boundary. As such, the largest APD at the stimulus site occurs when the stimulus is located in the LV (the thickest region) and the smallest stimulus site APD is generated by the RV stimulus. Analyzing the APD distribution near the cusps, as shown in the right panel, indicates that pronounced differences in APD can be observed when the front must propagate around the cusp. This effect is most prominent for the RV stimulus case, with the local gradient increasing significantly and achieving at the cusps an APD value larger than that what is seen at the stimulus site. The APD dispersions produced in this realistic geometry suggest that boundary and geometry effects may lead to a dispersion of refractoriness independent of any intrinsic or dynamically induced heterogeneity of APD and could contribute to the development of a potentially arrhythmogenic substrate [31].
Conclusion
Even in the absence of well characterized static and dynamic heterogeneity, tissue boundaries and geometry can give rise to APD dispersions in cardiac tissue that have the potential to facilitate conduction block and arrhythmia development. Dispersion of APD in this case arises from the diffusive electrotonic currents between neighboring cells that allow for wave propagation in cardiac tissue. At the tissue boundaries, cells are never adjacent to tissue that is more depolarized during repolarization, and so the boundaries act as a sink where APD is abbreviated. Local stimulation can increase APD dispersion because the site of stimulation is the only location during repolarization where cells are never adjacent to tissue that is more repolarized, leading to the presence of a source where APD is prolonged. These effects can be compounded by AP morphology, which can modulate APD spatial profiles; tissue dimensionality, where differences in electrotonic loading lead to APD prolongation at the stimulus site; tissue size and shape, including the presence of sharp cusps or corners; and stimulus location.
Although it is perhaps easiest to study the spatial dispersion of APD computationally, several experimental studies have addressed the issue as well in a variety of species and found similar results. In canine epicardial tissue, APDs have been found to vary by 10 ms within 5 mm of the site of stimulation [32]. Large dispersions of repolarization time and APD (measured as activation-recovery intervals (ARI)) also have been observed in the human ventricles using endocardial mapping, with increased dispersion of repolarization time at fast rates arising from a decrease in ARI near the pacing site; dispersions of 50 ms from apex to base were measured [33]. In rat ventricular tissue, dispersions of APD of 20 ms were observed on the epicardium between apex and base (a distance of about 2 cm) [34]. Dispersions of repolarization time and APD also have been observed transmurally in rabbit left ventricular free wall preparations, with dispersions of APD of 9 ms measured across the ventricular wall [35]. In addition, when the site of stimulation was changed from epicardial to endocardial in these studies, although the magnitude of the dispersion remained the same, its direction changed so that longer APDs were located proximal to the site of stimulation [35], consistent with our findings. The magnitudes of dispersions of repolarization time and APD measured from experiments in many cases are larger than those observed here. These differences may arise from a number of different factors, such as the presence of intrinsic electrophysiological gradients in cardiac tissue or limitations of the model.
In practice, the spatial dispersion of APD may be less important than the dispersion of repolarization times because repolarization times determine the level of refractoriness and therefore where conduction block and arrhythmias may develop. Because cardiac action potentials are about two orders of magnitude longer than the action potential upstroke durations, electrotonic currents during the action potential smooth out differences in depolarization time associated with wave propagation, so that the dispersion of repolarization time generally is much smaller than the dispersion of depolarization time (or time to full tissue activation). The degree of this dispersion reduction depends on the detailed geometrical, stimulus site, dimensional, and action potential morphology properties that have been discussed. We have found that the dispersion of repolarization is comparatively higher in larger square and rectangular domains than in smaller domains of the same shape; that wider rectangular domains can support slightly larger dispersions of repolarization; that circular geometries, where sink effects from corners are absent, have slightly larger dispersions of repolarization than rectangular domains; that a model with a less steep repolarization phase has an increased dispersion of repolarization compared with a model with steep repolarization; that the dispersion of repolarization decreases as the spatial dimension increases; and that the location of the stimulus can have profound effects on the dispersion of repolarization by interacting with the geometry of the domain. All of these factors may combine to facilitate or to hinder the induction of reentrant waves in cardiac tissue.
-
>
We study how boundaries and geometry can produce spatial dispersion of APD in cardiac tissue.
-
>
Electrotonic currents can generate dispersion.
-
>
This dispersion depends on tissue size/shape, AP shape, dimensionality, and stimulus details.
-
>
The dispersion from geometrical effects may be enough to produce block and initiate reentry.
ACKNOWLEDGMENTS
We thank O. Bernus, J.J. Fox, N.F. Otani, F. Sachse, F. Siso-Nadal, and H. Zhang for useful discussions. This work was supported in part by National Science Foundation Grants no. 0800793 (F.H.F. and E.M.C.) and no. 0824399 (E.M.C.) and by the National Institutes of Health grant HL075515-S03,-S04 (F.H.F.). This work also was supported in part by the National Science Foundation through TeraGrid resources provided by the Pittsburgh Supercomputing Center. We acknowledge the Isaac Newton Institute for Mathematical Sciences.
Footnotes
Publisher's Disclaimer: This is a PDF file of an unedited manuscript that has been accepted for publication. As a service to our customers we are providing this early version of the manuscript. The manuscript will undergo copyediting, typesetting, and review of the resulting proof before it is published in its final citable form. Please note that during the production process errors may be discovered which could affect the content, and all legal disclaimers that apply to the journal pertain.
REFERENCES
- [1].Gussak I, Antzelevitch C, Hammill SC, Shen WK, Bjerregaard P. Cardiac Repolarization. 1st ed. Humana Press; 2003. [Google Scholar]
- [2].Clark RB, Bouchard RA, Salinas-Stefanon E, Sanchez-Chapula J, Giles WR. Heterogeneity of action potential waveforms and potassium currents in rat ventricle. Cardiovasc. Res. 1993;27:1795–1799. doi: 10.1093/cvr/27.10.1795. [DOI] [PubMed] [Google Scholar]
- [3].Patel SP, Campbell DL. Transient outward potassium current, “Ito”, phenotypes in the mammalian left ventricle: underlying molecular, cellular and biophysical mechanisms. J. Physiol. 2005;569:7–39. doi: 10.1113/jphysiol.2005.086223. [DOI] [PMC free article] [PubMed] [Google Scholar]
- [4].Sun X, Wang H-S. Role of the transient outward current (Ito) in shaping canine ventricular action potential – a dynamic clamp study. J. Physiol. 2005;564:411–419. doi: 10.1113/jphysiol.2004.077263. [DOI] [PMC free article] [PubMed] [Google Scholar]
- [5].Antzelevitch C, Fish J. Electrical heterogeneity within the ventricular wall. Basic Res. Cardiol. 2001;96:517–527. doi: 10.1007/s003950170002. [DOI] [PubMed] [Google Scholar]
- [6].Szentadrassy N, Banyasz T, Biro T, Szabo G, Toth BI, Magyar J, Lazar J, Varro A, Kovacs L, Nanasi PP. Apico-basal inhomogeneity in distribution of ion channels in canine and human ventricular myocardium. Cardiovasc. Res. 2005;65:851–860. doi: 10.1016/j.cardiores.2004.11.022. [DOI] [PubMed] [Google Scholar]
- [7].Cherry EM, Ehrlich JR, Nattel S, Fenton FH. Pulmonary vein reentry--properties and size matter: insights from a computational analysis. Heart Rhythm. 2007;4:1553–62. doi: 10.1016/j.hrthm.2007.08.017. [DOI] [PubMed] [Google Scholar]
- [8].Engelman ZJ, Trew ML, Smaill BH. Structural heterogeneity alone is a sufficient substrate for dynamic instability and altered restitution. Circ Arrhythm Electrophysiol. 2010;3:195–203. doi: 10.1161/CIRCEP.109.890459. [DOI] [PubMed] [Google Scholar]
- [9].Nolasco JB, Dahlen RW. A graphic method for the study of alternation in cardiac action potentials. J Appl Physiol. 1968;25:191–196. doi: 10.1152/jappl.1968.25.2.191. [DOI] [PubMed] [Google Scholar]
- [10].Guevara MR, Ward G, Shrier A, Glass L. Electrical alternans and period-doubling bifurcations. Comput Cardiol. 1984:167–170. [Google Scholar]
- [11].Watanabe MA, Fenton FH, Evans SJ, Hastings HM, Karma A. Mechanisms for discordant alternans. J Cardiovasc Electrophysiol. 2001;12:196–206. doi: 10.1046/j.1540-8167.2001.00196.x. [DOI] [PubMed] [Google Scholar]
- [12].Qu Z, Garfinkel A, Chen PS, Weiss JN. Mechanisms of discordant alternans and induction of reentry in simulated cardiac tissue. Circulation. 2000;102:1664–1670. doi: 10.1161/01.cir.102.14.1664. [DOI] [PubMed] [Google Scholar]
- [13].Pastore JM, Girouard SD, Laurita KR, Akar FG, Rosenbaum DS. Mechanism linking T-wave alternans to the genesis of cardiac fibrillation. Circulation. 1999;99:1385–1394. doi: 10.1161/01.cir.99.10.1385. [DOI] [PubMed] [Google Scholar]
- [14].Fenton FH, Cherry EM, Hastings HM, Evans SJ. Multiple mechanisms of spiral wave breakup in a model of cardiac electrical activity. Chaos. 2002;12:852–892. doi: 10.1063/1.1504242. [DOI] [PubMed] [Google Scholar]
- [15].Comtois P, Vinet A. Curvature effects on activation speed and repolarization in an ionic model of cardiac myocytes. Phys. Rev. E. 1999;60:4619. doi: 10.1103/physreve.60.4619. [DOI] [PubMed] [Google Scholar]
- [16].van Oosterom A, Jacquemet V. The effect of tissue geometry on the activation recovery interval of atrial myocytes. Physica D: Nonlinear Phenomena. 2009;238:962–968. [Google Scholar]
- [17].Sampson KJ, Henriquez CS. Interplay of ionic and structural heterogeneity on functional action potential duration gradients: Implications for arrhythmogenesis. Chaos. 2002;12:819. doi: 10.1063/1.1497735. [DOI] [PubMed] [Google Scholar]
- [18].Krogh-Madsen T, Christini D. Action Potential Duration Dispersion and Alternans in Simulated Heterogeneous Cardiac Tissue with a Structural Barrier. Biophys. J. 2007;92:1138–1149. doi: 10.1529/biophysj.106.090845. [DOI] [PMC free article] [PubMed] [Google Scholar]
- [19].Bishop M, Plank G. Representing Cardiac Bidomain Bath-Loading Effects by an Augmented Monodomain Approach: Application to Complex Ventricular Models. IEEE Trans. Biomed. Eng. 2011 doi: 10.1109/TBME.2010.2096425. [DOI] [PMC free article] [PubMed] [Google Scholar]
- [20].Siso-Nadal F, Otani NF, Gilmour RF, Fox JJ. Boundary-induced reentry in homogeneous excitable tissue. Phys. Rev. E. 2008;78:031925. doi: 10.1103/PhysRevE.78.031925. [DOI] [PMC free article] [PubMed] [Google Scholar]
- [21].Cain JW, Schaeffer DG. Shortening of cardiac action potential duration near an insulating boundary. Math. Med. Biol. 2008;25:21–36. doi: 10.1093/imammb/dqn002. [DOI] [PMC free article] [PubMed] [Google Scholar]
- [22].Sampson KJ, Henriquez CS. Electrotonic influences on action potential duration dispersion in small hearts: a simulation study. Am J Physiol Heart Circ Physiol. 2005;289:H350–360. doi: 10.1152/ajpheart.00507.2004. [DOI] [PubMed] [Google Scholar]
- [23].Cherry EM, Fenton FH. Suppression of alternans and conduction blocks despite steep APD restitution: electrotonic, memory, and conduction velocity restitution effects. Am J Physiol Heart Circ Physiol. 2004;286:H2332–41. doi: 10.1152/ajpheart.00747.2003. [DOI] [PubMed] [Google Scholar]
- [24].Fox JJ, McHarg JL, Gilmour RF. Ionic mechanism of electrical alternans. Am J Physiol Heart Circ Physiol. 2002;282:H516–30. doi: 10.1152/ajpheart.00612.2001. [DOI] [PubMed] [Google Scholar]
- [25].Clayton RH, Bernus O, Cherry EM, Dierckx H, Fenton FH, Mirabella L, Panfilov AV, Sachse FB, Seemann G, Zhang H. Models of cardiac tissue electrophysiology: progress, challenges and open questions. Prog Biophys Mol Biol. 2011;104:22–48. doi: 10.1016/j.pbiomolbio.2010.05.008. [DOI] [PubMed] [Google Scholar]
- [26].Niederer SA, Kerfoot E, Benson A, Bernabeu MO, Bernus O, Bradley C, Cherry EM, Clayton R, Fenton FH, Garny A, Heidenreich E, Land S, Maleckar M, Pathmanathan P, Plank G, Rodriguez JF, Roy I, Sachse FB, Seemann G, Slavhaug O, Smith NP. Verification of cardiac tissue electrophysiology simulators using an N-version benchmark. Phil Trans R Soc Lond A. doi: 10.1098/rsta.2011.0139. in press. [DOI] [PMC free article] [PubMed] [Google Scholar]
- [27].Fenton FH, Cherry EM, Karma A, Rappel WJ. Modeling wave propagation in realistic heart geometries using the phase-field method. Chaos. 2005;15:13502. doi: 10.1063/1.1840311. [DOI] [PubMed] [Google Scholar]
- [28].Bueno-Orovio A, Pérez-García VM, Fenton FH. Spectral methods for partial differential equations in irregular domains: The spectral smoothed boundary method. SIAM J. Sci. Comput. 2006;28:886. [Google Scholar]
- [29].Fast VG, Rohr S, Gillis AM, Kléber AG. Activation of cardiac tissue by extracellular electrical shocks: formation of “secondary sources” at intercellular clefts in monolayers of cultured myocytes. Circ. Res. 1998;82:375–385. doi: 10.1161/01.res.82.3.375. [DOI] [PubMed] [Google Scholar]
- [30].Nielsen PM, Le Grice IJ, Smaill BH, Hunter PJ. Mathematical model of geometry and fibrous structure of the heart. Am J Physiol. 1991;260:H1365–78. doi: 10.1152/ajpheart.1991.260.4.H1365. [DOI] [PubMed] [Google Scholar]
- [31].Siso-Nadal F, Otani NF, Gilmour J, Fox JJ. Boundary-induced reentry in homogeneous excitable tissue. Phys. Rev. E. 2008;78:031925–5. doi: 10.1103/PhysRevE.78.031925. [DOI] [PMC free article] [PubMed] [Google Scholar]
- [32].Osaka T, Kodama I, Tsuboi N, Toyama J, Yamada K. Effects of activation sequence and anisotropic cellular geometry on the repolarization phase of action potential of dog ventricular muscles. Circulation. 1987;76:226–236. doi: 10.1161/01.cir.76.1.226. [DOI] [PubMed] [Google Scholar]
- [33].Hanson B, Sutton P, Elameri N, Gray M, Critchley H, Gill JS, Taggart P. Interaction of activation-repolarization coupling and restitution properties in humans. Circ Arrhythm Electrophysiol. 2009;2:162–170. doi: 10.1161/CIRCEP.108.785352. [DOI] [PubMed] [Google Scholar]
- [34].Walton RD, Benoist D, Hyatt CJ, Gilbert SH, White E, Bernus O. Dual excitation wavelength epifluorescence imaging of transmural electrophysiological properties in intact hearts. Heart Rhythm. 2010;7:1843–1849. doi: 10.1016/j.hrthm.2010.08.019. [DOI] [PubMed] [Google Scholar]
- [35].Myles RC, Bernus O, Burton FL, Cobbe SM, Smith GL. Effect of activation sequence on transmural patterns of repolarization and action potential duration in rabbit ventricular myocardium. Am. J. Physiol. Heart Circ. Physiol. 2010;299:H1812–1822. doi: 10.1152/ajpheart.00518.2010. [DOI] [PMC free article] [PubMed] [Google Scholar]


