Abstract
The research investigates the role of the immotile chondrocytic primary cilium in the growth plate. This study was motivated by (i) the recent evidence of the mechano-sensorial function of the primary cilium in kidney tubule epithelial cells; and (ii) the distinct three-dimensional orientation patterns that the chondrocytic primary cilium forms in articular cartilage in the presence or the absence of loading. For our investigation, we used the Smad1/5CKO mutant mouse, whose disorganized growth plate is due to the conditional deletion of Smad 1 and 5 proteins that also affect the so-called Indian Hedgehog pathway, whose physical and functional topography has been shown to be partially controlled by the primary cilium. Fluorescence and confocal microscopy on stained sections visualized ciliated chondrocytes. Morphometric data regarding position, orientation and eccentricity of chondrocytes, and ciliary localization on cell membrane, length and orientation, were collected and reconstructed from images. We established that both localization and orientation of the cilium are definite, and differently so, in the Smad1/5CKO and control mice. The orientation of the primary cilium, relative to the major axis of the chondrocyte, clusters at 80° with respect to the anterior-posterior direction for the Smad1/5CKO mice, showing loss of the additional clustering present in the control mice at 10°. We therefore hypothesized that the clustering at 10° contains information of columnar organization. To test our hypothesis, we prepared a mathematical model of relative positioning of the proliferative chondrocytic population based on ciliary orientation. Our model belongs to the category of “interactive particle system models for self-organization with birth”. The model qualitatively reproduced the experimentally observed chondrocytic arrangements in growth plate of each of the Smad1/5CKO and control mice. Our mathematically predicted cell division process will need to be observed experimentally to advance the identification of ciliary function in the growth plate.
Keywords: Chondrocyte, growth plate, interactive particle system, cilium, self-organization
Introduction
The biological function of the immotile primary cilium, virtually one per eukaryotic cell, has been hypothesized within the last twenty-five years as critical for mechano-transduction and fundamental to development and physiology of essentially all organisms from paramecia to humans [1–4]. Ciliary localization at the membrane of growth plate chondrocytes has been found to be consistently proximal and distal on the chondrocytic membrane [5]. Ciliary incidence and length of articular chondrocytic primary cilium participate into the mechano-sensory mechanism [6], and ciliary orientation forms three-dimensional (3D) patterns in the articular cartilage in relation to presence and absence of loading [7]. The role of ciliary localization, length and orientation in the 3D biological environment of the growth plate is unknown.
Under normal conditions, the growth plate is a highly organized tissue responsible for bone growth [8]. Chondrocytes form longitudinal columns divided transversely in adjacent zones indicative of specific stages of chondrocytic development, namely proliferative, pre-hypertrophic and hypertrophic, with cell size and shape differing among the growth plate zones [9,10]. Because alterations of the growth plate patterns due to abnormal biological processes are readily apparent through growth plate disorganization and because the primary cilium can be rendered visible by fluorescent tagging, we chose the growth plate as the appropriate environment to study the orientation of the primary cilium in animal models.
The growth plate’s organized structure reflects the normal function resulting from an orchestrated interplay of signaling pathways. The Tg737orpk mouse shows fewer and smaller cilia in the chondrocytes of the growth plate relative to a control littermate, which shows more abundant cilia with defined orientations [11]. Ciliogenesis is impaired by the lack of the IFT protein polaris that normally localizes at the primary cilium and is required for Sonic hedgehog signaling [12]. Further, mice homozygous for mutations of Kif3, a component of the kinesin-II motor protein complex required for ciliary assembly, exhibit a lack of primary cilium in growth plate chondrocytes, coupled with a disorganization of the growth plate that disrupts the normal preferential orientation of chondrocytes [13,14]. However, the function of the primary cilium in chondrocytes as well as other cell types remains unclear [1,14–20]. We have explored the existence of patterns of localization, length and orientation of the primary cilium in growth plate chondrocytes (Fig. 1) of mice models in our quest to understand ciliary function.
Figure 1.
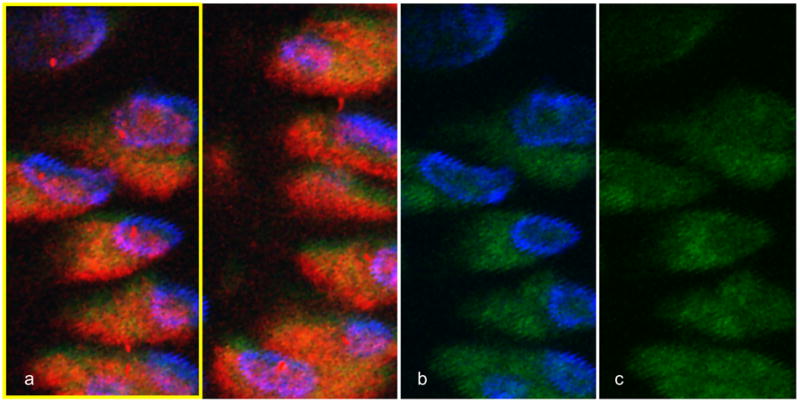
The primary cilium of proliferative chondrocytes of wild type mouse at the end of gestation by confocal microscopy. (a) The chondrocytic cilia are visible by monoclonal anti-acetylated-α-tubulin (in red). For the yellow portion of (a), we show in (b) the chondrocytic nucleus stained with DAPI (blue), and in (b) and (c) the endogenous fluorescence is used to visualize the background (darker green).
Because the primary cilium is closely related to the Golgi complex and the centrosome, with which it shares the elder centriole, and because the centriole and the centrosome control cell polarity [21–23], we have experimentally investigated the distribution of localization of axonemal projection from the chondrocyte into the extra cellular matrix (ECM), and the length and orientation of the primary cilium in 3D in relation to chondrocytic eccentricity and orientation in the growth plate of mice models. We have chosen to investigate the double knockout mouse Smad 1/5 conditional with Col2-cre (Smad1fx/fx;Smad5fx/fx;Col2-Cre, henceforth referred to as Smad1/5CKO) [24] and its wild type (WT) control because of the Smad1/5CKO’s disorganized growth plate (Fig. 2) and altered Hedgehog pathway, previously found to be mediated by primary cilia [25]. We have chosen the end of gestation for the animals’ age because Smad1/5CKO dies at birth.
Figure 2.
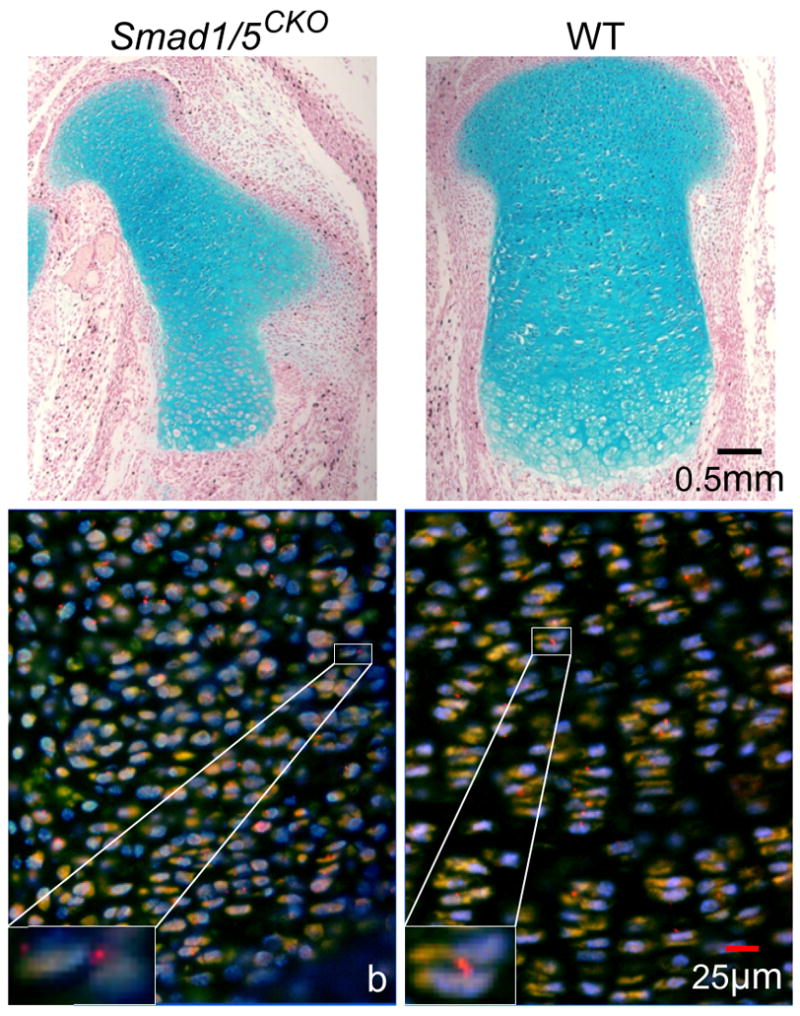
Proximal femur’s growth plate of double knockout mouse Smad1/5CKO and WT littermate. (a) Alcian blue-stained sections show lack of chondrocytic columnar arrangements in Smad1/5CKO, present in WT mouse. Ectopic cartilage is present in the enlarged perichondrium of the mutant (see also Fig. 4 of Retting et al., 2009). (b) Fluorescent microscopy images show primary cilia (red) and nuclei (blue) of chondrocytes that appear lighter than the surrounding ECM.
Mathematical models of growth plate have focused on (1) elongation of bone that the growth plate causes under the hypothesis that elongation occurs as a mechano-sensory response with the epiphyseal cartilage reacting to the local magnitude of stresses [26]; and (2) specific models of the process of cell division internal to mother and daughter cells [27,28]. Mathematical models of cell cycle have also viewed populations of cells as communicating through networks [29]. In order to (i) understand the correlation between the various cellular and ciliary parameters observed experimentally under normal and genetically altered conditions; and (ii) explore the possibility of the existence of a mechanism of cell division that involves the 3D orientation of the cilium, we have prepared a computer simulation of a proliferative cell population based on our experimental observation. Further, dynamic mathematical models are developed to describe bone’s biological processes [30].
The novelty of our mathematical model of cell division is the inclusion of the orientation of the primary cilium in 3D in the cell population signaling that determines the position of the daughter cell with respect to the mother cell. Our mathematical model applies to both Smad1/5CKO and WT control. Cellular eccentricity and ciliary localization of projection, length and orientation, are the input variables. The output is the arrangement of the ciliated chondrocytes.
Methods
Experimental methods
The Smad1/5CKO mutant mouse was obtained as described in [23]. Briefly, Smad1 [31] and Smad5 [32] floxed mice were crossed with Col2-Cre mice [33] to generate Smad1fx/fx;Col2-Cre and Smad5fx/fx;Col2-Cre mice (referred to as Smad1CKO and Smad5CKO, respectively; CKO, cartilage-specific knockout). Smad1fx/+;Smad5fx/+;Col2-Cre mice were intercrossed to generate Smad1fx/fx;Smad5fx/fx mice (Smad1/5CKO).
Immunocytochemistry, fluorescence microscopy and confocal microscopy were combined to visualize ciliated chondrocytes in the growth plate of mice ex vivo. Embryos were harvested at 16.5 days of gestation (E16.5) from Smad1/5CKO mice and their WT control littermates. Mice were fixed overnight in formalin, then decalcified in formic acid overnight, and embedded in paraffin. Hind limbs were isolated from six male Smad1/5CKO mutants and from six male WT mice. 7μm and 30μm thick longitudinal sections were boiled for 15 minutes in citrate buffer [34]. Sections were blocked with 5% goat serum for 1 hour and incubated overnight at 4°C with monoclonal anti-acetylated tubulin (Sigma) as the primary antibody. Sections were incubated with AlexaFluor-555-conjugated secondary antibody (Invitrogen) for 1 hour at room temperature and counterstained with DAPI (Vectashield).
We employed a Leica TCS-SP scanning confocal microscope (Heidelberg, Germany) at UCLA’s Imaging Core Facility. To observe the 30μm thick sections we used a 20x Planapochromat lens together with an argon ion gas laser set at Alexa 488nm to capture the endogenous green fluorescence of the background [35], a 561nm diode pumped solid state laser to excite the red fluorochromes of tagged cilia, and a Spectra-Physics Millenia X 532nm diode pump laser and a Tsunami picosecond titanium sapphire laser to produce the pulsed infrared beam required for excitation of DAPI-tagged nuclei. The 2photon DAPI was set at 770nm and exciting around 385nm. Because the plane of focus had a thickness of 2.53μm at 20x, we scanned every 1.26μm, which equals half the amplitude of the Gaussian curve [36], to capture the tissue continuously without gaps or overlapping. Light detected by photomultipliers was converted to pseudo-color for good visualization: background as dark green, primary cilia red and nuclei as light blue (Figure 1). Cilia appear as rods or dots projecting from the membrane of the chondrocyte contrasted by the darker background. Images were collected through the thickness of the specimens in terms of so-called z-stacks.
Data were collected on each image from the proliferative zone of the WT and from the region of the Smad1/5CKO growth plate corresponding to the proliferative zone of the WT following published methods [37]. This choice was due to the impossibility to discern specific zones within the disorganized growth plate of Smad1/5CKO. Briefly, the 250×250μm tiff images of each of the z-stacks were analyzed at 120x magnification. Each of the tiff images was imported into XaraX1 software. Consistently through the stack, an xy reference system was chosen on the plane of each image, with the x-axis along the medial-lateral direction and the y-axis along the axis of the bone. Further, the specimen thickness paralleled the z-axis pointing towards the posterior aspect. Each image was analyzed from top to bottom and from left to right. The cells that appeared with their cilium were numbered by their first appearance as the z-stack was examined from top to bottom. On each image, an ellipse was adapted to each optical section of each visible cell and the major and minor axes of each ellipse marked. A segment was then overlapped to each visible fluorescent detail that was interpreted as a cilium. The first and last scan numbers on which the cell appeared with or without its cilium were recorded. On each image on which the cell appeared with its cilium, the x and y coordinates of the ellipse center were recorded, and the major axis length, the major axis angle and the minor axis length were measured. The area of each ellipse was computed from the axes’ lengths. Length and angle with respect to the x-axis of the segments drawn on cilia were measured. The x and y coordinates of the initial and final points of segment were recorded. To assess orientation of major cell axis and of primary cilium in 3D, we used the azimuth angle θ (or longitude) in the xy-plane measured from the x-axis and the zenith angle ϕ (or co-latitude, angle out of the xy-plane) measured from the positive z-axis.
We then used the ciliary θϕ-algorithm [37] to conduct the 3D reconstruction in terms of the best-to-fit ellipsoid of each cell from the ellipses that fit the cell profiles on each image on which the cell appears. The 3D reconstruction of a given cilium was obtained by connecting the centroids of the first and last segments on the z-stack that were overlapped to each appearance of the cilium on the stack. The length of the cilium in 3D was measured as the distance of the centroids of the first and last segments. For each ciliated chondrocyte, we computed: cellular longitudinal position, cellular angles θce and ϕce of the major axis of the ellipsoid that simulate the cell with respect to the xyz system, cellular eccentricity as 1-(b/a)2 where a and b are the maximum and minimum dimensions respectively along perpendicular directions, the angles θci and ϕci that the cilium forms with respect to the xyz system, and the angles θci,ce and ϕci,ce that the cilium forms with respect to the major axis of the cell. For each image obtained from fluorescence microscopy on the 7μm thick sections, data were collected following the method applied on a single image of the confocal z-stack.
During imaging of the growth plates for collection of z-stacks, proximal-distal orientation of the bone’s position in vivo was maintained, based on the characteristic morphological differences of the epiphyseal and the metaphyseal bone. We did not differentiate between medial and lateral, and between anterior and posterior, aspects because of lack of morphological differences. Consequently, (i) the range of values for each of θci and θce with respect to the bone’s reference reduces from 0°–360° to 0°–180°; (ii) the range of values of the angle ϕci reduces from 0°–180° to 0°–90°; and θci,ce ranges between 0° and 360° and ϕci,ce reduces to 0°–90°.
Statistical methods for experimental data analysis
We analyzed the data expressed as mean ± standard deviation or as percentage per animal and per animal group, either Smad1/5CKO or WT. We used one-way ANOVA to compare normally distributed data or data whose normality could be achieved by usual transformations. Significant difference was set for p-value <0.05 before considering the Bonferroni adjustment for multiple comparisons. We used the Kolmogorov-Smirnov test to evaluate significant differences of distributions of theta cell between WT and Smad1/5CKO [38]. We used non-parametric Chi squared analysis for data whose normality could not be achieved by transformations, i.e. axonemal length and the azimuth ϕci,ce. Because significant differences were not found among animals of the same group, data was presented by group, Smad1/5CKO and WT.
Mathematical modeling
We programmed MATLAB (Mathworks) to carry out our simulation, which belongs to the category “interacting particle system for self-organization with birth” [39]. We modeled each 2D profile of ciliated chondrocytes on the medial-lateral-longitudinal plane with an ellipse. The positioning of the ellipses was produced by an algorithm that simulated the result of cell division in the region defined as the proliferative zone of WT and corresponding region of the Smad1/5CKO. This is a 3D algorithm because it depends on 3D experimental data. We show the results in 2-D. We assumed that
the primary cilium is required for growth plate organization [5];
all proliferative cells within a growth plate divide at approximately the same rate [40];
cells divide along a plane perpendicular to the axis of the miotic spindle, which is directed transversely to the long axis of the bone [9]. After division, the daughter cell moves (“rotates”) with respect to the mother cell to acquire the stacked orientation in the normal animal [5,8]. Therefore, normal mother-daughter cell alignment (i.e. the orientation of the line that passes through the centers of mother and daughter cells) on the medial-lateral-longitudinal plane is modeled perpendicular to orientation of the cell on the medial-lateral-longitudinal plane.
a daughter cell inherits mother’s orientation on the medial-lateral-longitudinal plane [41];
mother-daughter cell pairs tend to align in columns along the longitudinal axis of the bone with normal cell signaling [37];
rotation of daughter cell after division with respect to the mother cell depends on population cell to cell signaling [3,42];
cell population signaling for positioning of daughter cell depends on (i) the primary cilium angle ϕci,ce; and (ii) the distance between signaling cell and daughter cell, with the closer cells exerting the stronger signals, but all cells of the population participating in the signaling [43,44,44.A]; and
resistance of ECM to cell movement dominates inertia of cell to move [45].
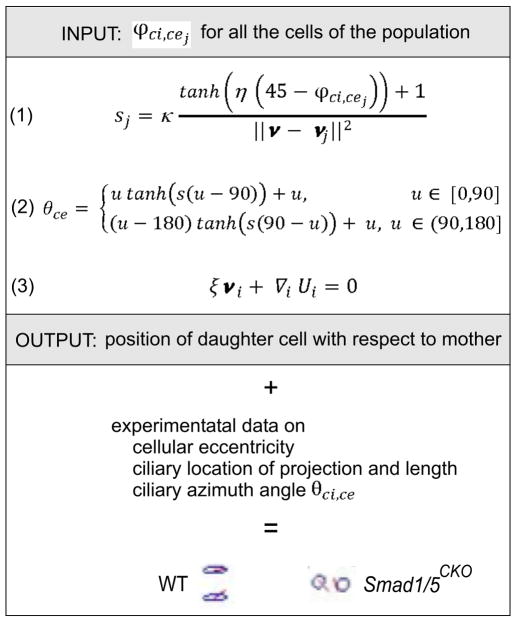
At the beginning of the process, the ellipses modeling the chondrocytes from the resting zone were distributed randomly (or spatially uniformly distributed [46]), not in columns, but rather in a square domain with local coordinates that vary between 0 and 1. The experimentally collected data were also normalized to such domain. Each dividing cell whose location was indicated by the vector ν received a signal with strength sj from the j-th cell whose location is provided by the position vector ν⊥̇:
| (1) |
which corresponded to strong signal for ϕci,cej = 10° and weak signal for ϕci,cej = 80°. The non negative values of κ and η were meant to be determined to match the experimental data. The total signal received by each dividing cell equaled the sum of the signals defined by equation 1, emitted by each cell of the population, s=Σjsj The polar angle determining both the mother and daughter cell orientation, θce, is stochastically determined by,
| (2) |
where uniformly ranges from 0° to 180°. The orientation of the line that connected the centers of the mother and daughter cells equaled was modeled perpendicular to cellular orientation, θmd = θce − 90 within the medial-lateral-longitudinal plane. Thus, mother-daughter cell pairs tended to align in columns for high signal. Cellular motion is modeled using Newton’s second law that describes the balance of cellular repulsive forces at short distances and resistance of the ECM to cell motion with the inertia term neglected because we assumed that resistance of ECM to cell motion dominates inertia, set to zero:
| (3) |
where ξ denotes the resistance coefficient of the ECM to cell movement; ∇i denotes the gradient vector (defined in terms of partial derivatives) with respect to the location of the i-th cell; and Ui=Σij f(dij) where f(dij) =e −dij for dij < r and f(dij) = 0 for dij ≥ r denotes a truncated Morse potential, usually used in interacting particle models to prevent particle collision at small distances. The parameter r represented the minimum distance among cells and was meant to be determined by the experimental data. In order to update the positions of the cells after each cell division, equation (3) was solved to provide an equilibrium state of stable cell interaction before another cell division occurred.
Results
We have investigated localization, axonemal length and orientation in 3D of the chondrocytic primary cilium in the disorganized growth plate of Smad1/5CKO mouse in comparison to the WT control. The purpose was to detect morphological differences that could point to the biological role of primary cilium in the growth plate. Because the distinction among the morphological zones is lost in the growth plate of the Smad1/5CKO [23], the comparison between Smad1/5CKO and WT littermates was carried out on the epiphyseal side of the growth plate that corresponds to the proliferative zone of the WT.
Experimental results
In general, some of the growth plate chondrocytes of the Smad1/5CKO maintain the characteristic localization, length and orientation in 3D of the chondrocytic primary cilium of the WT control, while the remaining chondrocytes show definite different characteristics.
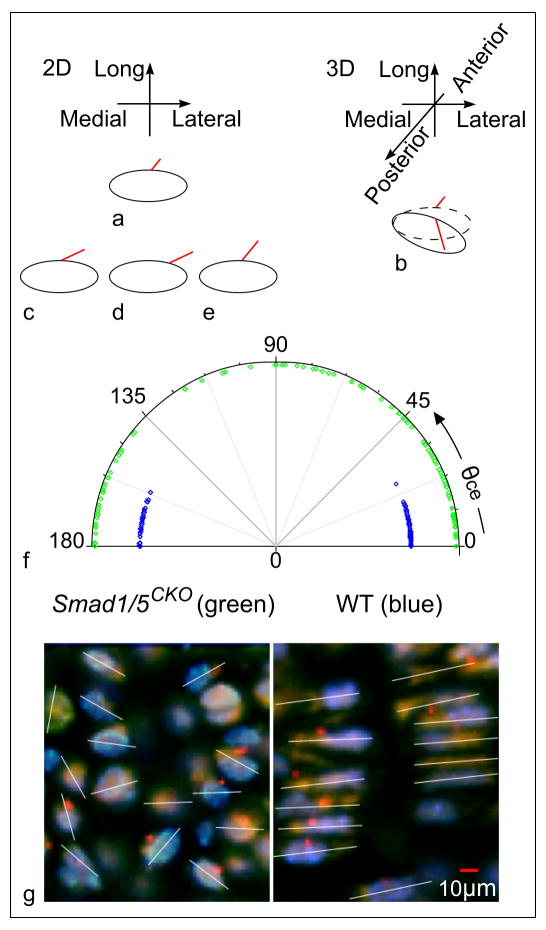
Localization of projection of ciliary axoneme on the chondrocytic membrane (Fig. 3) was investigated in relation to chondrocytic size and shape. The chondrocytic profiles of the Smad1/5CKO mouse were smaller than in the WT mouse (34.9±13.5 vs. 38.8±13.6μm2, n=149, p<0.01) and more numerous, as indicated by the larger area fraction (0.23 vs. 0.14, p<0.01) (Fig. 2). The chondrocytic shape was assessed in terms of “roundness” measured by eccentricity. Because a more pronounced roundness is measured by a value of eccentricity closer to zero, the significantly lower values of chondrocytic eccentricity for the Smad1/5CKO in comparison to the WT (0.56±0.20 vs. 0.70±0.15 for eccentricity, p<0.01) indicated rounder shape in the Smad1/5CKO than in the control. The chondocytes of Smad1/5CKO showed a variable orientation (measured by angle θce) with respect to the medial-lateral direction that differed significantly (p=0.01) from the WT mouse, whose chondrocytic major axis essentially parallels the medial-lateral direction orientation with θce clustering at 0° and 180° (Fig. 4).
Figure 3.
Localization, length and orientation of primary cilium and orientation of chondrocytes with respect to the medial-lateral axis. We offer examples (diagrams not to scale) of ciliated cells to clarify distinct concepts and appearances in 2D and 3D. The cilium appears shorter in (a) 2D than in (b) 3D. Such length may or may not be the same as the cilia in (c), (d), and (e) that we visualize in 2D only. In 2D, cilia (c) and (d) show same orientation and different localization on the membrane; while (c) and (e) show same localization and different orientation. (f) The Smad1/5CKO mutants show a wide range of values (green), indicating that the major axis of the chondrocyte can form any angle (between 0° and 180°) with the medio-lateral direction. In comparison, the major axis of proliferative chondrocytes of the WT mice (blue) cluster at values 0° and 180°, indicating that for normal animals, the major axis of the chondrocyte in the proliferative zone is somewhat parallel to the medial-lateral direction. (g) The white lines through the cells denote cellular orientation in the medial-lateral-longitudinal plane.
Figure 4.
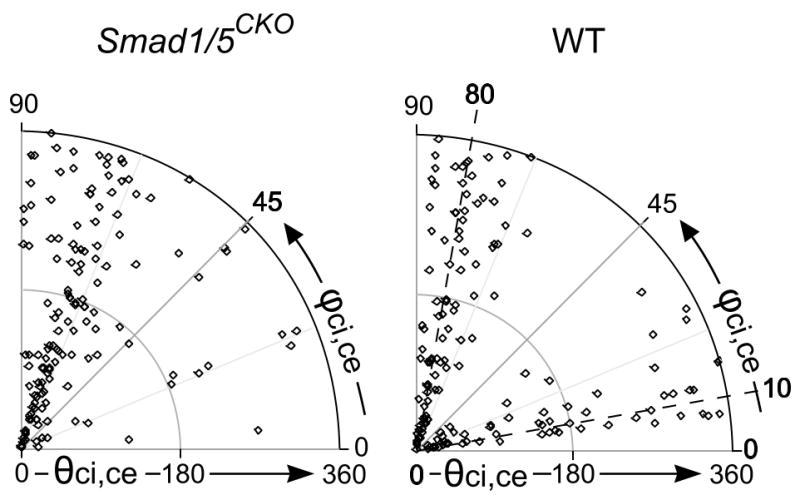
Definite patterns of ciliary orientation in 3D. The distribution of values for the azimuth angle of the primary cilium (see circumferential ϕci,ce) with respect to its chondrocyte differs between the Smad1/5CKO and WT mice. One of the values of clustering (ϕci,ce =10°) for WT is lost for the Smad1/5CKO. We hypothesize that the clustering at 10° controls columnar arrangement in the WT, lost in the Smad1/5CKO. The other angle θci,ce that together with ϕci,ce defines the orientation of the primary cilium assumes random values (dots span radially the whole 0° to 360° range) for both Smad1/5CKO and WT.
The localization of projection of the primary cilium into the ECM is consistent with the chondrocytic orientation for both Smad1/5CKO and WT. Ciliary projection occurred proximally or distally for chondrocytes with normal medial-lateral polarity for 92% of chondrocytes of Smad1/5CKO and 98% of chondrocytes of WT (Fig. 4). Ciliary projection occurred medially or laterally in 88% of the chondrocytes of the Smad1/5CKO when the major axis of the chondrocyte showed an orientation that differs from the medial-lateral polarity (88% vs. 98% for WT, p<0.01). The location of ciliary emergence of the primary cilium from the cell membrane correlates with chondrocytic “roundness”, measured by eccentricity. Indeed, medial or lateral location correlates to the “rounder” or less eccentric chondrocytes of the Smad1/5CKO; while proximal or distal location correlated to “flatter” or more eccentric proliferative chondrocytes. Hence, ciliary location controls cell shape or responds to it in the growth plate.
Ciliary length and orientation did not correlate to each other. Indeed, the ciliary length does not differ significantly between the Smad1/5CKO mouse and its control in terms of means (2.8±1.1μm vs. 3.1±1.5μm, p>0.46) and ranges (Table I). These data indicated that ciliary length and cell shape are independent from each other. In contrast, the ciliary orientation in 3D with respect to the major axis of the chondrocyte was described by a zenith angle ϕci,ce that clusters along either the anterior or the posterior direction at approximately 80° for the Smad1/5CKO mouse and differently (p<0.01) for the WT control with a dual clustering along either (i) anterior-posterior direction (approximately 10°) or (ii) direction of growth (approximately 80°) (Fig. 5). The ciliary azimuth angle θci,ce was randomly distributed for both Smad1/5CKO and WT mice.
Table I.
The length of the ciliary axoneme measured in 3D.
| Length in μm | Smad1/5CKO | WT |
|---|---|---|
| n | 48 | 36 |
| min | 1.1 | 1.1 |
| max | 5.2 | 5.1 |
| mean | 2.8 | 3.1 |
| stdev | 1.1 | 1.5 |
| median | 2.6 | 2.6 |
| p>0.46 | ||
Figure 5.
Mathematical modeling on the basis of experimental data. This diagram illustrates the input and output variables of the equations that define the simulation of cell organization after cell division; and the experimental data used for ciliated chondrocyte representation.
Mathematical results
Because we found that the 3D orientation of the primary cilium in the growth plate of the WT mouse clusters at two specific angles, ϕci,ce =10° and ϕci,ce =80° with respect to the anterior-posterior direction (z), while in the disorganized growth plate of the Smad1/5CKO mouse, it clustered only at ϕci,ce =80° (Fig. 5), we hypothesize that ϕci,ce =10° contains the information for columnar organization.
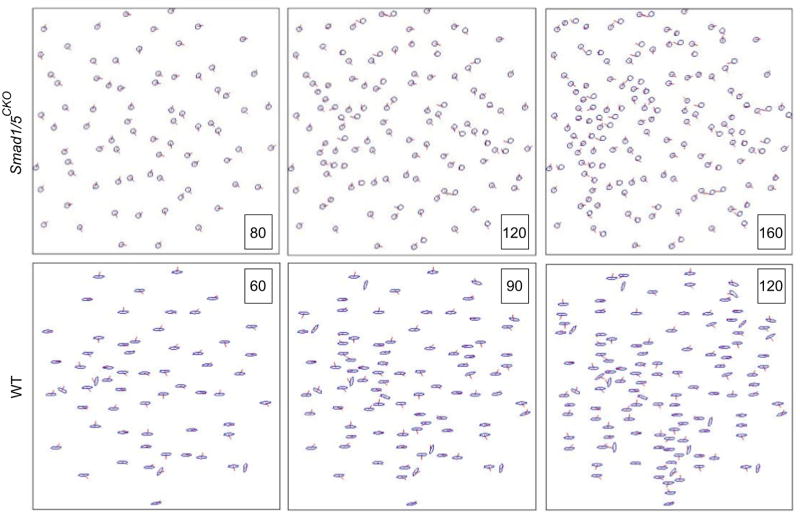
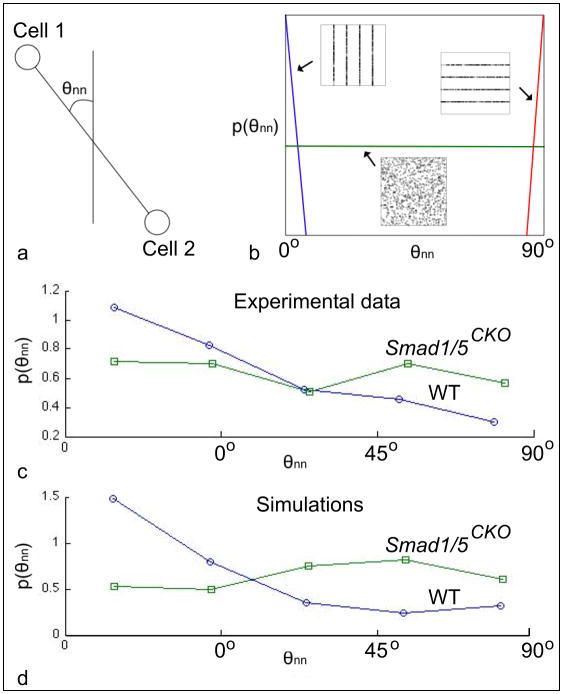
Our mathematical simulations of organization in the growth plate were obtained by the combination of (i) the cell division model described by equations (1) through (3) that uses the experimentally observed distribution of ciliary angle, and that apply to both the Smad1/5CKO and WT mouse; and (ii) the experimentally observed distributions of cell eccentricity and orientation, and ciliary location of emergence and length (Fig. 6). The simulations of cell organization used for both the Smad1/5CKO and WT mice the values κ =0.01, η =10, and r =0.06 (Fig. 7). We started the simulations with 80 cells for the Smad1/5CKO and 60 cells for the WT. We compared the simulated distributions of cell centers with the experimentally observed distributions of cell centers for each of the Smad1/5CKO and WT mice (Fig. 8). Cellular distributions of Smad1/5CKO observed and simulated were disorganized, due to the lack of signaling in the simulation of the Smad1/5CKO. Cellular distributions of WT observed and simulated were characterized by longitudinal clustering of cells due to intercellular signaling in the simulation. We then investigated the alignment of the nearest neighboring cells of any given cell from both empirical and simulated cell distributions. In particular, we plotted the distribution of the cell-to-cell angle relative to the longitudinal direction (Fig. 9a) between nearest neighbor cells. A delta distribution centered at θnn = 0° (i.e. the angle θnn = 0° has probability 1) corresponds to complete longitudinal alignment; whereas, a delta distribution at θnn = 90° (i.e. the angle θnn = 90° has probability 1) corresponds to medial-lateral alignment. A uniform distribution corresponds to complete disorder in cellular alignment (Fig. 9b). The Smad1/5CKO cells displayed approximately uniform alignment of nearest neighbors showing lack of preferential longitudinal orientation. Instead, the WT cells were strongly aligned in the longitudinal direction (Figs. 9c and 9d).
Figure 6.
Dynamic simulations of cell positioning after division. We show three steps of the dynamic simulation, when cell division produces a total of 80,120, 160 cell models for Smad1/5CKO and 60, 90 and 120 cell models for WT. The experimental data were used to represent cell eccentricity, ciliary length and azimuth angle θci,ce.
Figure 7.
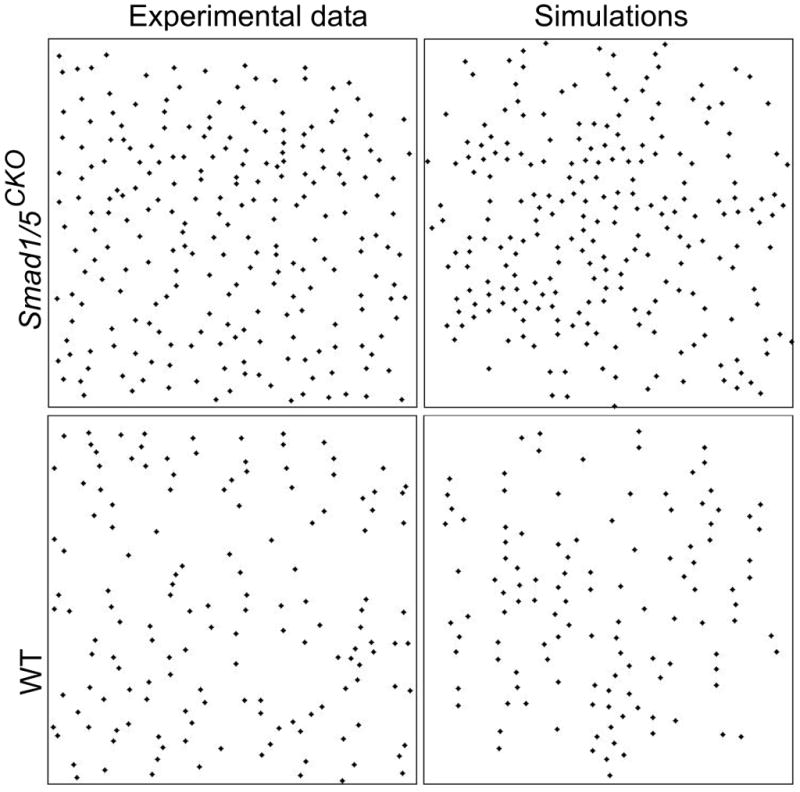
Distribution patterns of cell centers. Both the distributions obtained from the experimental data and from the results of the cell division simulation show a difference in center distribution between Smad1/5CKO and WT: isotropy vs. longitudinal anisotropy.
Figure 8.
Measure of anisotropy of chondrocytic distributions. (a) We measured the angle θnn between nearest neighbor cells relative to the longitudinal direction. (b) A delta distribution at θnn = 0° corresponds to complete longitudinal alignment, whereas at θnn = 90° corresponds to medial-lateral alignment. A uniform distribution corresponds to complete disorder in cellular alignment. (c) The Smad1/5CKO cells displayed approximately uniform alignment of nearest neighbors, showing lack of preferential longitudinal orientation. Instead, (d) the WT cells were strongly aligned in the longitudinal direction.
Figure 9.
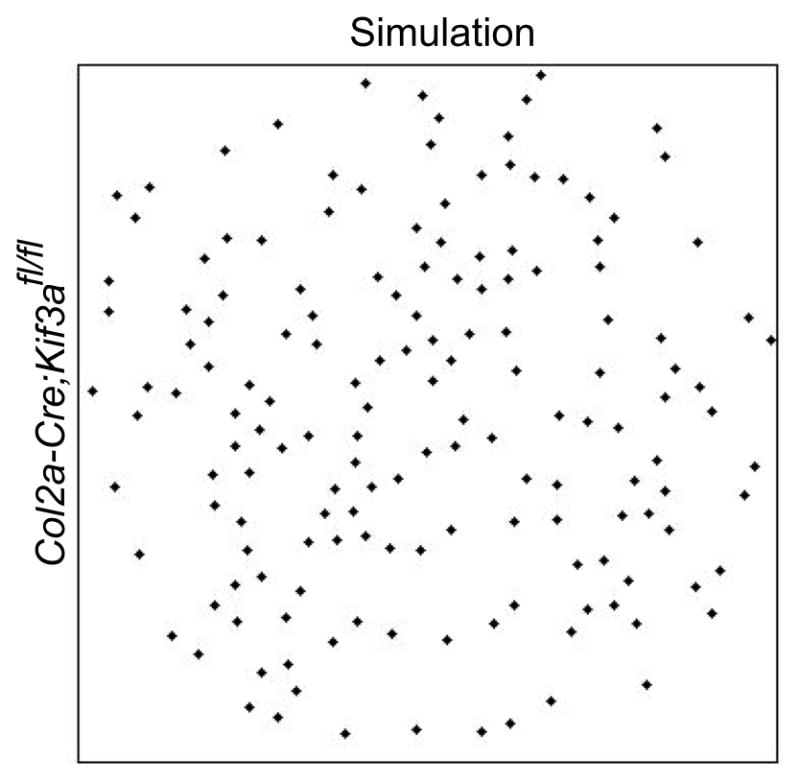
Our dynamic simulation applied to the Col2a-Cre;Kif3afl/fl mouse. By assuming only the few cilia present in the Col2a-Cre;Kif3afl/fl mouse, our dynamic model computes a weak cell-to-cell signal that impedes the “rotation” lacking in such mouse growth plate where chondrocytes do not align in columns (compare to figure 7c in 5).
Discussion
Our study probes the function of the primary cilium in the chondrocytic organization required for normal function in the growth plate. To such end, we investigated the three conceptually different characteristics that describe the primary cilium at the micro-structural level: localization of projection from the chondrocytic membrane, axonemal length, and orientation in 3D (Fig. 3). Our combination of new experimental data and novel mathematical dynamic model indicates that ciliary orientation can direct a global positioning system of chondrocytes in the growth plate.
The Indian Hedgehog pathway, whose physical and functional topography has been previously shown to be partially controlled by the primary cilium [47], was disrupted in the growth plate of the Smad1/5CKO mouse at E16.5 stage of development. Both localization of projection and zenith angle of ciliary axoneme with respect to the chondrocytic orientation are specified differently as between the Smad1/5CKO and the WT mouse. Because (1) specificity of both localization and orientation of axoneme are required for function of flagella and motile cilia [51]; (2) the location of axonemal projection has previously been indicated as linked to cellular orientation, plane of cell division and direction of cell migration [4,45]; and (3) a specific orientation of the ciliary axoneme is linked to the direction of cellular division [52–55], we explored the hypothesis that localization and orientation of the primary cilium participate in chondrocytic division and organization in the growth plate.
Because signal transduction in kidney tubule epithelial cells is initiated by passive bending of immotile axoneme, and the growth plate is a mechanically sensing environment [45], it is possible that signal transduction in growth plate chondrocytes is initiated by passive bending due to mechano-deformation of surrounding ECM of the chondrocytic cilium that also lacks the dynein arms to initiate movement [47,49]. Our results on definite ciliary localization, length and orientation are circumstantially consistent with other investigators’ prediction that the cilium functions as a mechano-sensor [44]. Indeed, each of localization, length and orientation affects position and exposure of cilium to the force acting on the growth plate and therefore the impact of the force on the cilium.
The localization of ciliary projection and chondrocyte shape differ and correlate to each other, for each of the Smad1/5CKO and the WT mouse. Ciliary projection depends on the location of the centriole and Golgi apparatus within the cell whose shape may reflect changes in inner chondrocytic organization. The axonemal length in 3D did not differ between Smad1/5CKO and WT mouse at E16.5. It has been previously noted that differences in length of motile cilia may reflect differences in signaling capabilities among cells [56]. If this is indeed the case, we can hypothesize that ciliary length and orientation control signaling mechanisms independently because (1) ciliary orientation differs significantly between Smad1/5CKO and WT mouse; and (2) our orientation-controlled mathematical model for cell-to-cell signaling shows a qualitative difference in orientation-controlled signaling capabilities.
The orientation of the primary cilium of the daughter cell influenced by a signal from the cell population, and not just the mother cell or the neighboring cells, places the cilium at the center of the cellular network. We present the first mathematical model of cell positioning, after cell division, for the chondrocytic population that includes the ciliary orientation in cell-to-cell signaling. Characteristics of primary ciIium and cell division are biologically linked. Because the engagement of the cilium with the associated centriole needs to be interrupted, i.e. deciliation must occur, for the centriole to accomplish its function during mitosis. i.e. to organize the spindle during mitosis (M phase of the cell cycle) [50], the cilium needs to be resorbed before the M phase commences. The presence of the primary cilium in the proliferative zone implies the occurrence of ciliary formation during the G1 phase. The greater stubbiness of the long bones of the Smad1/5CKO relative to those of the WT control suggest a cell division that results in medial-lateral relative positioning of cells in addition to the normal stacking direction. The appraisal of cell distribution (Fig. 9) shows a lack of preferential longitudinal direction in favor of a directional isotropy in the Smad1/5CKO mouse that is longitudinal and medial-lateral.
The lack of the rotation of chondrocytes after cell division necessary to form longitudinal columns observed in the Smad1/5CKO, was also observed in the case of ciliary deletion [5]. By assuming only the few cilia present in the Col2a-Cre;Kif3afl/fl mouse, our dynamic model computes a weak cell-to-cell signal that impedes the “rotation” lacking in such mouse growth plate where chondrocytes do not align in columns (Fig. 9). We therefore hypothesize that a strong alignment of chondrocytes in columns corresponds to a stronger cell-to-cell signal that occurs when most cilia show a zenith angle ϕci,ce between 0° and 45°.
Our mathematical model was based on the hypothesis that columnar formation in the growth plate arises from cell to cell signaling. The coefficients η and κ in equation (1) measure the effect of the input variables: η signifies the effect of value clustering at ϕci,ce =10° on the columnar organization in contrast to clustering at ϕci,ce =80° (Fig. 5) and κ is the overall adjustment on the effect of both the zenith angle ϕci,ce and the distance between cells. In equation 3, r is the minimum distance between centers of cells. Because the 0.06 value of r was normalized to a unit square (see Methods), the minimum distance between cell centers measures 24μm for a 400μm region in the growth plate (6% of 400). Such value was more closely approximated by the Smad1/5CKO mouse, whose chondrocytes are more closely located (Fig. 2) than the WT mouse. The ciliary zenith angle ϕci,ce was chosen as input of the simulation within the experimentally obtained distributions to provide simulations that qualitatively output the experimentally observed distribution of chondrocytes (Figs. 7, 8). The information on cell eccentricity, ciliary localization of projection, length and azimuth angle θci,ce were not included in equations (1) through (3), but rather independently added to the simulations from the distributions of the experimental values. The cause of variation of cellular eccentricity relates to biological and mechanical factors [45] and will be the subject of future simulation.
In conclusion, the mathematical simulations of the experimental data presented here suggest experiments to verify the possible involvement of the primary cilium in cell positioning after cell division.
Acknowledgments
We thank Cornelia Farnum at Cornell University for helpful discussions and suggestions. This project was supported by NSF Research Experience for Undergraduates grant DMS-0601395 to Andrea Bertozzi, University of California Leadership Excellence through Advanced Degrees, UCLA’s Orthopaedic Hospital Research Center #MA62252 to M.-G. Ascenzi, and NIH grant R01 AR044528 to K.M. Lyons.
Footnotes
Conflict of interest statement
The authors have no actual or potential conflict of interest to disclose.
Publisher's Disclaimer: This is a PDF file of an unedited manuscript that has been accepted for publication. As a service to our customers we are providing this early version of the manuscript. The manuscript will undergo copyediting, typesetting, and review of the resulting proof before it is published in its final citable form. Please note that during the production process errors may be discovered which could affect the content, and all legal disclaimers that apply to the journal pertain.
Contributor Information
Christian Blanco, Email: christianblanco@berkeley.edu.
Ian Drayer, Email: dinoian@yahoo.com.
Hannah Kim, Email: hannahjkim@ucla.edu.
Ryan Wilson, Email: rynovia@ucla.edu.
Kelsey N. Retting, Email: knretting@hotmail.com.
Karen M. Lyons, Email: klyons@mednet.ucla.edu.
George Mohler, Email: georgemohler@gmail.com.
References
- 1.Poole CA, Flint MH, Beaumont BW. Analysis of the morphology and function of primary cilia in connective tissues: a cellular cybernetic probe? Cell Motility. 1985;5:175–193. doi: 10.1002/cm.970050302. [DOI] [PubMed] [Google Scholar]
- 2.Rydholm S, Frisk T, Kowalewski JM, Andersson Svahn H, Stemme G, Brismar H. Microfluidic devices for studies of primary cilium mediated cellular response to dynamic flow conditions. Biomed Microdev. 2008;10:555–560. doi: 10.1007/s10544-008-9165-8. [DOI] [PubMed] [Google Scholar]
- 3.Christensen ST, Pedersen SF, Satir P, Veland IR, Schneider L. The primary cilium coordinates signaling pathways in cell cycle control and migration during development and tissue repair. Curr Top Dev Biol. 2008;85:261–301. doi: 10.1016/S0070-2153(08)00810-7. [DOI] [PubMed] [Google Scholar]
- 4.Haycraft CJ, Serra R. Cilia involvement in patterning and maintenance of the skeleton. Curr Top Dev Biol. 2008;85:303–332. doi: 10.1016/S0070-2153(08)00811-9. [DOI] [PMC free article] [PubMed] [Google Scholar]
- 5.Song B, Haycraft CJ, Seo H, Yoder BK, Serra R. Development of the post-natal growth plate requires intraflagellar transport proteins. Develop Biol. 2007;305:202–216. doi: 10.1016/j.ydbio.2007.02.003. [DOI] [PMC free article] [PubMed] [Google Scholar]
- 6.McGlashan SR, Knight M, Chowdhury T, Joshi P, Jensen CG, Kennedy S, Poole CA. Mechanical loading modulates chondrocyte primary cilia incidence and length. Cell Biol Int. 2010;34:441–446. doi: 10.1042/CBI20090094. [DOI] [PubMed] [Google Scholar]
- 7.Wilsman NJ, Farnum CE. Three dimensional orientation of chondrocytic cilia in adult articular cartilage. Proc Orthop Res Soc. 1986:486. [Google Scholar]
- 8.Hunziker EB. Mechanism of longitudinal bone growth and its regulation by growth plate chondrocytes. Micr Res Tech. 1994;28:505–519. doi: 10.1002/jemt.1070280606. [DOI] [PubMed] [Google Scholar]
- 9.Dodds GS. Row formation and other types of arrangement of cartilage cells in endochondral ossification. Anat Rec. 1930;46:385–399. [Google Scholar]
- 10.Hunziker EB, Schenk RK, Cruz-Orive LM. Quantification of chondrocyte performance in growth-plate cartilage during longitudinal bone growth. J Bone Joint Surg Am. 1987;69:162–173. [PubMed] [Google Scholar]
- 11.McGlashan SR, Haycraft CJ, Jensen CG, Yoder BK, Poole CA. Articular cartilage and growth plate defects are associated with chondrocyte cytoskeletal abnormalities in Tg737orpk mice lacking the primary cilia protein polaris. Matrix Biol. 2007;26:234–246. doi: 10.1016/j.matbio.2006.12.003. [DOI] [PubMed] [Google Scholar]
- 12.Ingham PW, McMahon AP. Hedgehog signaling in animal development: Paradigms and principles. Genes Develop. 2001;15:3059–3087. doi: 10.1101/gad.938601. [DOI] [PubMed] [Google Scholar]
- 13.Haycraft CJ, Banizs B, Aydin-Son Y, Zhang Q, Michaud EJ, Yoder BK. Gli2 and Gli3 localize to cilia and require the intraflagellar transport protein polaris for processing and function. PLoS Genetics. 2005;1:e53. doi: 10.1371/journal.pgen.0010053. [DOI] [PMC free article] [PubMed] [Google Scholar]
- 14.Haycraft CJ, Zhang Q, Song B, Jackson WS, Detloff PJ, Serra R, Yoder BK. Intraflagellar transport is essential for endochondral bone formation. Development. 2007;134:307–316. doi: 10.1242/dev.02732. [DOI] [PubMed] [Google Scholar]
- 15.Wheatley DN, Wang AM, Strugnell GE. Expression of primary cilia in mammalian cells. Cell Biol Int. 1996;20:73–81. doi: 10.1006/cbir.1996.0011. [DOI] [PubMed] [Google Scholar]
- 16.Praetorious HA, Spring KR. A physiological view of the primary cilium. Ann Rev Phys. 2005;67:515–529. doi: 10.1146/annurev.physiol.67.040403.101353. [DOI] [PubMed] [Google Scholar]
- 17.Olsen B. From the editor’s desk. Matrix Biol. 2005;24:449–450. doi: 10.1016/j.matbio.2005.06.004. [DOI] [PubMed] [Google Scholar]
- 18.Blacque OE, Perens EA, Boroevich KA, Inglis PN, Li C, Warner A, Khattra J, Holt RA, Ou G, Mah AK, McKay SJ, Huang P, Swoboda P, Jones SJM, Marra M, Baillie DL, Moerman DG, Shaham S, Leroux MR. Functional genomics of the cilium, a sensory organelle. Curr Biol. 2006;15:935–941. doi: 10.1016/j.cub.2005.04.059. [DOI] [PubMed] [Google Scholar]
- 19.Esteban MA, Harten SK, Tran MG, Maxwell PH. Formation of primary cilia in the renal epithelium is regulated by the von Hippel-Lindau tumor suppressor protein. J Amer Soc Neph. 2006;17:1801–1806. doi: 10.1681/ASN.2006020181. [DOI] [PubMed] [Google Scholar]
- 20.Fliegauf M, Omran H. Novel tools to unravel molecular mechanisms in cilia-related disorders. Trends Gen. 2006;22:241–245. doi: 10.1016/j.tig.2006.03.002. [DOI] [PubMed] [Google Scholar]
- 21.Follit JA, Tuft RA, Fogarty KE, Pazour GJ. The intraflagellar transport protein ift20 is associated with the golgi complex and is required for cilia assembly. Mol Biol Cell. 2006;17:3781–3792. doi: 10.1091/mbc.E06-02-0133. [DOI] [PMC free article] [PubMed] [Google Scholar]
- 22.Goncalves J, Nolasco S, Nascimento R, Lopez Fanarraga M, Zabala J, Soares H. Tbccd1, A new centrosomal protein is required for centrosome and golgi apparatus positioning. EMBO Rep. 2010;11:194–200. doi: 10.1038/embor.2010.5. [DOI] [PMC free article] [PubMed] [Google Scholar]
- 23.Feldman JL, Geimer S, Marshall WF. The mother centriole plays an instructive role in defining cell geometry. PLoS biology. 2007;5:e149. doi: 10.1371/journal.pbio.0050149. [DOI] [PMC free article] [PubMed] [Google Scholar]
- 24.Retting KN, Song B, Yoon BS, Lyons KM. BMP canonical Smad signaling through Smad1 and Smad5 is required for endochondral bone formation. Development. 2009;136:1093–1104. doi: 10.1242/dev.029926. [DOI] [PMC free article] [PubMed] [Google Scholar]
- 25.Huangfu D, Anderson KV. Cilia and Hedgehog responsiveness in the mouse. Proc Nat Acad Sc USA. 2005;102:11325–11330. doi: 10.1073/pnas.0505328102. [DOI] [PMC free article] [PubMed] [Google Scholar]
- 26.Kummer B, Lohscheidt K. Mathematical model of the longitudinal growth of long bones. Anat Anz. 1985;158:377–393. [PubMed] [Google Scholar]
- 27.McKenney D, Nickel JA. Mathematical model for cell division. Math Comp Model. 1997;25:49–52. [Google Scholar]
- 28.Novak B, Tyson JJ. Modeling the cell division cycle: m-phase trigger, oscillations, and size control. J Theor Biol. 1993;165:101–134. [Google Scholar]
- 29.Sible JC, Tyson J. Mathematical modeling as a tool for investigating cell cycle control networks. Methods. 2007;41:238–247. doi: 10.1016/j.ymeth.2006.08.003. [DOI] [PMC free article] [PubMed] [Google Scholar]
- 30.Ayati BP, Edwards CM, Webb GF, Wikswo JP. A Mathematical model of bone remodeling dynamics for normal bone cell populations and myeloma bone disease. Biology Direct. 2010;5:28–44. doi: 10.1186/1745-6150-5-28. [DOI] [PMC free article] [PubMed] [Google Scholar]
- 31.Huang S, Tang B, Usoskin D, Lechleider RJ, Jamin SP, Li C, Anzano MA, Ebendal T, Deng C, Roberts AB. Conditional knockout of the Smad1 gene. Genesis. 2002;32:76–79. doi: 10.1002/gene.10059. [DOI] [PubMed] [Google Scholar]
- 32.Umans L, Vermeire L, Francis A, Chang H, Huylebroeck D, Zwijsen A. Generation of a floxed allele of Smad5 for cre-mediated conditional knockout in the mouse. Genesis. 2003;37:5–11. doi: 10.1002/gene.10219. [DOI] [PubMed] [Google Scholar]
- 33.Ovchinnikov DA, Deng JM, Ogunrinu G, Behringer RR. Col2a1-directed expression of Cre recombinase in differentiating chondrocytes in transgenic mice. Genesis. 2000;26:145–146. [PubMed] [Google Scholar]
- 34.Ivkovic S, Yoon BS, Popoff SN, Safadi FF, Libuda DE, Stephenson RC, Daluiski A, Lyons KM. Connective tissue growth factor coordinates chondrogenesis and angiogenesis during skeletal development. Development. 2003;130:2779–2791. doi: 10.1242/dev.00505. [DOI] [PMC free article] [PubMed] [Google Scholar]
- 35.Kim SI, Suh TS. Imaging the future medicine; World Congress on Medical Physics and Biomedical Engineering; August 27 - September 1, 2006; COEX Seoul, Korea. Berlin: Springer; 2006. p. 488. [Google Scholar]
- 36.Pawley JB. Handbook of Biological Confocal Microscopy. 2. Plenum Press; New York: 1995. [Google Scholar]
- 37.Ascenzi MG, Lenox M, Farnum CE. Analysis of the orientation of primary cilia in growth plate cartilage: a mathematical method based on multiphoton microscopical images. J Struct Biol. 2007;158:293–306. doi: 10.1016/j.jsb.2006.11.004. [DOI] [PMC free article] [PubMed] [Google Scholar]
- 38.Lehmann EL, Romano JP. Testing Statistical Hypotheses. 1. Springer; New York: 2005. [Google Scholar]
- 39.Liggett TM. Interacting Particle Systems. 1. Springer; New York: 1985. [Google Scholar]
- 40.Wilsman NJ, Farnum CE, Green EM, Lieferman EM, Clayton MK. Cell cycle analysis of proliferative zone chondrocytes in growth plates elongating at different rates. J Orth Res. 1996;14:562–572. doi: 10.1002/jor.1100140410. [DOI] [PubMed] [Google Scholar]
- 41.Feldman JL, Geimer S, Marshall WF. The mother centriole plays an instructive role in defining cell geometry. PLoS Biol. 2007;5:e149. doi: 10.1371/journal.pbio.0050149. [DOI] [PMC free article] [PubMed] [Google Scholar]
- 42.Ahrens MJ, Li Y, Jiang H, Dudley AT. Convergent extension movement in growth plate chondrocytes require gpi-anchored cell surface proteins. Development. 2009;136:3463–3474. doi: 10.1242/dev.040592. [DOI] [PMC free article] [PubMed] [Google Scholar]
- 43.Li Y, Dudley A. Noncanonical frizzled signaling regulates cell polarity of growth plate chondrocytes. Development. 2009;136:1083–1092. doi: 10.1242/dev.023820. [DOI] [PMC free article] [PubMed] [Google Scholar]
- 44.Satir P, Christensen ST. Structure and function of mammalian cilia. Histoch Cell Biol. 2008;129:687–693. doi: 10.1007/s00418-008-0416-9. [DOI] [PMC free article] [PubMed] [Google Scholar]; Buxboim A. Matrix Elasticity, Cytoskeleton forces and physics of the nucleus: how deeply do cells ‘feel’ outside and in? J Cell Science. 2010;123:297–308. doi: 10.1242/jcs.041186. [DOI] [PMC free article] [PubMed] [Google Scholar]
- 45.Amini S, Veilleux D, Villemure I. Tissue and cellular morphological changes in growth plate explants under compression. J Biomech. 2010;43:2582–2588. doi: 10.1016/j.jbiomech.2010.05.010. [DOI] [PubMed] [Google Scholar]
- 46.Daley D, Vere-Jones D. An Introduction to the Theory of Point Processes. 2. Springer; New York: 2003. [Google Scholar]
- 47.Koyama E, Young B, Nagayama M, Shibukawa Y, Enomoto-Iwamoto M, Iwamoto M, Maeda Y, Lanske B, Song B, Serra R, Pacifici M. Conditional Kif3a ablation causes abnormal hedgehog signaling topography, growth plate dysfunction, and excessive bone and cartilage formation during mouse skeletogenesis. Development. 2007;134:2159–2169. doi: 10.1242/dev.001586. [DOI] [PMC free article] [PubMed] [Google Scholar]
- 48.Olbrich H, Häffner K, Kispert A, Völkel A, Volz A, Sasmaz G, Reinhardt R, Hennig S, Lehrach H, Konietzko N, Zariwala M, Noone PG, Knowles M, Mitchison HM, Meeks M, Chung EM, Hildebrandt F, Sudbrak R, Omran H. Mutations in DNAH5 cause primary ciliary dyskinesia and randomization of left-right asymmetry. Nat Genet. 2002;30:143–144. doi: 10.1038/ng817. [DOI] [PubMed] [Google Scholar]
- 49.Satir P, Christensen ST. Structure and function of mammalian cilia. Histochem Cell Biol. 2008;129:687–693. doi: 10.1007/s00418-008-0416-9. [DOI] [PMC free article] [PubMed] [Google Scholar]
- 50.Rieder CL, Jensen CG, Jensen LC. The resorption of primary cilia during mitosis in a vertebrate (PtK1) cell line. J Ultr Res. 1979;68:173–185. doi: 10.1016/s0022-5320(79)90152-7. [DOI] [PubMed] [Google Scholar]
- 51.Mitchell B, Jacobs R, Li J, Chien S, Kintner C. A positive feedback mechanism governs the polarity and motion of motile cilia. Nature. 2007;447:97–101. doi: 10.1038/nature05771. [DOI] [PubMed] [Google Scholar]
- 52.Goldstein B, Takeshita H, Mizumoto K, Sawa H. Wnt signals can function as positional cues in establishing cell polarity. Develop Cell. 2006;10:391–396. doi: 10.1016/j.devcel.2005.12.016. [DOI] [PMC free article] [PubMed] [Google Scholar]
- 53.Park TJ, Haigo SL, Wallingford JB. Ciliogenesis defects in embryos lacking inturned or fuzzy function are associated with failure of planar cell polarity and Hedgehog signaling. Nature Gen. 2006;38:303–311. doi: 10.1038/ng1753. [DOI] [PubMed] [Google Scholar]
- 54.Jonassen JA, San Agustin J, Follit JA, Pazour GJ. Deletion of IFT20 in the mouse kidney causes misorientation of the mitotic spindle and cystic kidney disease. J Cell Biol. 2008;183:377–384. doi: 10.1083/jcb.200808137. [DOI] [PMC free article] [PubMed] [Google Scholar]
- 55.Heydeck W, Zeng H, Liu A. Planar cell polarity effector gene Fuzzy regulates cilia formation and Hedgehog signal transduction in mouse. Developmental Dynamics. 2009;238:3035–3042. doi: 10.1002/dvdy.22130. [DOI] [PubMed] [Google Scholar]
- 56.Marshall WF. Size control in dynamic organelles. Trends Cell Biol. 2002;12:414–419. doi: 10.1016/s0962-8924(02)02341-3. [DOI] [PubMed] [Google Scholar]


