

Abstract
Eleven single-nucleotide polymorphisms (SNPs) spanning OPRD1 were examined in 1063 European Americans (EAs) (620 cases with substance dependence (SD), including 557 with alcohol dependence (AD), 225 with cocaine dependence (CD) and 111 with opioid dependence (OD), and 443 controls). Nominally significant associations (P < 0.05) of five SNPs with SD were observed; only the association of the non-synonymous variant G80T with OD remained significant after correction for multiple testing using SNPSpD. Haplotype analyses with six tag SNPs indicated that a specific haplotype GCAACT, which harbors G80T G-allele and C921T C-allele, was significantly associated with AD (χ2 = 14.82, degrees of freedom (d.f.) = 1, P < 0.001), CD (χ2 = 9.19, d.f. = 1, P=0.002) and OD (χ2 = 20.68, d.f. = 1, P < 0.001). Logistic regression analyses, with sex and age being considered, demonstrated that this haplotype had a risk effect on AD (P = 0.03, β = 1.86, odds ratio (OR) = 6.43) and especially on OD (P< 0.001, β = 3.92, OR= 50.57). Moreover, seven SNPs covering OPRK1 were examined in the majority of the above subjects (390 cases, including 327 AD, 177 CD and 97 OD subjects, and 358 controls). Although no significant differences in allele, genotype or haplotype frequency distributions were seen between cases and controls, a specific OPRK1 haplotype, GGCTTCT, was significantly associated with AD (χ2 = 8.12, d.f. = 1, P=0.004). Logistic regression analyses also revealed its risk effect on AD (P = 0.009, β = 1.06, OR= 2.90). Population stratification artifact was not observed in the sample. Taken together, our findings supported a positive association between OPRD1 variants and SD, and a positive haplotypic association between OPRK1 and AD in EAs.
Keywords: opioid receptor genes, single nucleotide polymorphism, alcohol or drug dependence, association study, haplotype trend regression, logistic regression
Introduction
Adoption and twin studies have provided evidence that heritable factors play important roles in the etiology of alcohol dependence (AD)1,2 and drug (cocaine and opioids) dependence (DD),3,4 although the influence of environmental factors (for example, psychological and socio-cultural ones) on AD and DD is also substantial. A rational etiological model for AD and DD is that they result from the interaction of multiple genes and environmental factors. Identification of genetic risk factors for AD and DD should increase our understanding of the etiology of these disorders, and help in the identification of individuals who may benefit from preventive efforts, as well as new treatments for individuals who have developed a disorder. Genes that code for proteins known to be involved in the pathophysiology of AD and/or DD are good candidates in genetic association studies of these disorders. For opioid dependence (OD) especially, but also other forms of substance dependence (SD), genes encoding opioid receptors (OPRM1, OPRD1 and OPRK1, which encode the μ-, δ-and κ-receptor, respectively) are among the most obvious such candidates.
Exogenous opioids (for example, morphine and heroin), as well as endogenous opioid peptides (for example, β-endorphin, enkaphelin and dynorphin), are believed to exert their pharmacological and physiological functions by binding to μ-, δ-, and κ-opioid receptors. These three receptors are mainly expressed in the central and peripheral nervous systems. They are highly homologous and belong to the superfamily of G-protein-coupled receptors. Mounting evidence has shown that these three opioid receptors mediate the analgesic action and addictive properties of opioid drugs. Among these three receptors, the μ-receptor has been considered the primary target for opioid addiction.5 It possesses the highest affinity for morphine and its stimulation leads to pain relief and euphoria.6 Although not as well studied as the μ-receptor, the δ-receptor has been shown to mediate antinociception at both the spinal and supraspinal levels.7 Moreover, animal studies have demonstrated that the δ-receptor is involved in addictive processes. Knockout of the δ-receptor results in a loss of morphine tolerance in mice.8,9 δ-receptor agonists have been found to have analgesic properties, but induce weaker physical dependence. 10,11 In the central nervous system, δ-receptor agonists have been shown to modulate μ-receptor-mediated analgesia, suggesting cross-talk between these two kinds of receptors.12 In addition, the δ-receptor participates in the regulation of emotional responses. Mice with the δ-receptor disruption showed consistent anxiogenic- and depressive-like behaviors.13 Therefore, the δ-receptor is a promising target for treatment of both drug addiction and mood-related disorders. In contrast to the μ- and δ-receptor, the function of the κ-receptor in opioid analgesia and dependence is less clear. However, opposing interactions between the κ-receptor and the μ- and δ-receptor have been reported. Activation of the κ-receptor suppresses the development of analgesic tolerance to μ-receptor agonists and physical dependence on μ-receptor agonists.14 Furthermore, several putative κ-receptor agonists inhibit μ- and δ-receptor-dependent pharmacological actions, such as dopamine-related hyperlocomotion.15 Of interest, the κ-receptor seems to mediate psychotomimetic effects. Agonists of the κ-receptor have been shown to elicit dysphoric sensations.16
The three opioid receptors also play important roles in the reinforcing properties of non-opioid drugs (for example, cocaine) and alcohol. Cocaine is thought to act primarily at the dopamine transporter, blocking the normal presynaptic reuptake of dopamine and yielding excess dopamine signal transmission to postsynaptic neurons. As a consequence, analgesia and euphoria are induced. The dopamine system is intimately interconnected with the endogenous opioid systems. Dopaminergic neurons of the substantia nigra and the ventral tegmental area have projections that release dopamine in the caudate putamen, the nucleus accumbens, amygdala, anterior cingulate, and related regions where both opioid peptides and receptors are expressed. Cocaine intake may thus alter the function of the endogenous opioid system and reinforced behaviors of individuals. Repeated administration of cocaine evokes a down-regulation of δ-receptor density in the nucleus accumbens, and to a lesser extent in the striatum; long-term alcohol drinking results in loss of the μ-receptor in both structures of the rat brain.17 Moreover, Kim et al.18 found that a single cocaine exposure enhanced both μ-receptor reward and κ-receptor aversion through a circuit involving the ventral tegmental area, in which dopamine neurons are abundant. The rewarding effects of cocaine and alcohol are thought to be mediated by the mesolimbic dopamine pathway and to be modulated by the endogenous opioid system. μ- and δ-receptor agonists sensitize animals to the rewarding effect of cocaine and alcohol, whereas κ-receptor agonists inhibit it.19 Interestingly, these opposing effects are paralleled by an increase (produced by μ- and δ-receptor agonists) and a decrease (produced by κ-receptor agonists) in dopamine release in the nucleus accumbens.8 Furthermore, antagonists for these receptors produce effects that are opposite to one another. Pharmacological blockage of the endogenous opioid system by μ- and δ-receptor antagonists prevents ethanol from activating the dopamine system and reduces ethanol craving and consumption.20–22 Thus, μ- and δ-receptor antagonists can be useful in the treatment of AD. Naltrexone, one of only three approved pharmacotherapies for AD and OD, is thought to exert its actions primarily by blocking the μ-receptor.23,24 In contrast, κ-receptor antagonists have been shown to increase ethanol self-administration.19 In addition, agonists or antagonists for these three opioid receptors modulate the rewarding properties of cocaine in a similar way. For example, naltrindole, a selective antagonist for the δ-receptor, decreases sensitization to the rewarding effects of cocaine.25,26 Taken together, these data indicate that the rewarding properties of non-opioid drugs and alcohol are also regulated by the activity of the three opioid receptors.
Among the three opioid receptor genes, OPRM1 (located at 6q24–q25), which encodes the human μ-receptor, is the most intensively studied. A number of studies have reported positive association between OPRM1 functional variant A118G and OD,27–30 cocaine dependence (CD)31 or AD.31–34 Moreover, three studies adopting haplotype-based approaches also demonstrated the association between OPRM1 variants and DD or AD.35–37 However, a meta-analysis showed no consistent evidence of an association of the A118G polymorphism with SD.38 OPRD1, located at 1p36.1-p34.3, and OPRK1, located at 8q11.2, have not been well studied. OPRD1, the first of the human opioid receptor genes to be cloned,39 has a relatively conserved coding sequence. Only two coding sequence polymorphisms, a silent T921C (Gly307Gly) in exon 3 and the non-synonymous transversion G80T (Cys27Phe) in exon 1,40,41 have been identified. Mayer et al.40 reported a positive association between OPRD1 T921C and heroin dependence in a German population. They found that both the C-allele and the C/C homozygote were significantly more frequent in a sample of 103 German Caucasian heroin addicts than in 115 control subjects. However, Franke et al.42 used both case–control (233 heroin addicts and 173 controls) and family-based designs (90 heroin addicts and their parents, and 262 alcohol-dependent subjects and their parents) in another German population, but found no evidence for association or linkage disequilibrium (LD) of OPRD1 T921C with heroin or AD. Additionally, Xu et al.,43 who tested this variant in 450 Han Chinese heroin addicts and 304 controls, and Loh et al.,44 who tested this variant in 158 Han Chinese alcohol-dependent patients and 149 controls, found no association with either phenotype. To date, there are no published studies of the association of OPRD1 G80T with SD. With regard to OPRK1, Vadasz et al.45 found that OPRK1 variants might contribute to genetic predisposition to voluntary alcohol-drinking behavior in mice. In addition, a study by Yuferov et al.46 showed a possible haplotypic association of OPRK1 with OD in a small Hispanic group (n = 60). However, because Hispanic subjects recruited in the United States are heterogeneous with respect to their continental ancestry (see, for example, Gelernter et al.47), case–control studies focused on this population must be interpreted with great caution owing to stratification artifact risk. Most recently, Xuei et al.48 examined 13 single-nucleotide polymorphisms (SNPs) throughout OPRK1 in a group of 1860 European American (EA) individuals from 210 multiplex alcohol-dependent families and found that OPRK1 variants were associated with increased risk for AD.
In two previous studies, we found association between OPRM1 variants and SD by haplotype analyses.36,37 The purpose of this study was to examine whether variants of the other two opioid receptor genes (OPRD1 and OPRK1) affect the susceptibility to AD or DD.
Materials and methods
Subjects
A total of 1063 unrelated EA subjects were recruited in this study, as described previously.37 Two sets of samples were included in this study. The first set (390 cases including 327 AD, 177 CD and 97 OD subjects, and 358 controls) (‘Set A’) was included in our previous study.37 The second set (‘Set B’) (230 cases, all of whom had AD, with 48 also having CD and four having OD, and 85 controls) was newly collected. In brief, individuals who met the DSM-III-R (American Psychiatric Association, 1987) or DSM-IV (American Psychiatric Association, 1994) diagnostic criteria for AD and/or DD (cocaine or opioid) were recruited as cases (n = 620, 73.2% were males). Among them were 557 with AD, 225 with CD and 111 with OD. Controls were EA subjects who were screened to exclude major Axis I disorders, including substance use disorders, psychotic disorders (including schizophrenia or schizophrenia-like disorders), mood disorders and anxiety disorders (n = 443, 38.6% were males). The mean age for cases was 41.5±9.9 years (mean±s.d.; range, 18–78), and that for controls was 27.8±7.8 years (mean±s.d.; range, 18–56). No age information was available for one case and five control subjects.
The EA case and control subjects were recruited at either the University of Connecticut Health Center or the VA Connecticut Healthcare System-West Haven campus, where the study protocol was approved by the respective institutional review boards. All subjects gave written informed consent before participating in this study.
Marker selection and genotyping
Eleven SNPs at OPRD1 and seven SNPs at OPRK1 were selected from the dbSNP database (http://www.ncbi.nlm.nih.gov/SNP/) of the National Center for Biotechnology Information (NCBI; designated by rs#) or from the Applied Biosystems SNP database (http://www.appliedbiosystems.com/). SNP selection was based on published data, information content, minor allele frequency, functional potential, LD structure and validation evidence. The average distance between OPRD1 SNPs was 5370 bp and the average distance between OPRK1 SNPs was 4844 bp. Detailed information about these markers is presented in Table 1.
Table 1.
Information and genotyping methods for OPRD1 and OPRK1 SNPs
| SNP ID (this study) | SNP ID (NCBI rs#) | Gene | Variation | Location | Amino acid | Chromosome position (bp) (NCBI Build 36.1) | Genotyping method |
|---|---|---|---|---|---|---|---|
| OPRD1^1 | rs569356 | OPRD1 | C/T | Upstream | Chr01: 29009273 | PCR-RFLP | |
| OPRD1^2 | rs1042114 | OPRD1 | G80T | Exon 1 | Cys27Phe | Chr01: 29011562 | PCR-RFLP |
| OPRD1^3 | rs678849 | OPRD1 | C/T | Intron 1 | Chr01: 29017775 | PCR-RFLP | |
| OPRD1^4 | rs2236857 | OPRD1 | A/G | Intron 1 | Chr01: 29034196 | TaqMan | |
| OPRD1^5 | rs2236855 | OPRD1 | G/T | Intron 1 | Chr01: 29034586 | TaqMan | |
| OPRD1^6 | rs2298896 | OPRD1 | A/C | Intron 1 | Chr01: 29038725 | TaqMan | |
| OPRD1^7 | rs421300 | OPRD1 | C/T | Intron 1 | Chr01: 29042180 | TaqMan | |
| OPRD1^8 | rs529520 | OPRD1 | G/T | Intron 1 | Chr01: 29047533 | TaqMan | |
| OPRD1^9 | rs12749204 | OPRD1 | A/G | Intron 1 | Chr01: 29048800 | TaqMan | |
| OPRD1^10 | rs2234918 | OPRD1 | C921T | Exon 3 | Gly307Gly | Chr01: 29062184 | PCR-RFLP |
| OPRD1^11 | rs204076 | OPRD1 | A/T | Downstream | Chr01: 29062977 | TaqMan | |
| OPRK1^1 | rs12675595 | OPRK1 | A/G | Upstream | Chr08: 54330478 | TaqMan | |
| OPRK1^2 | rs1051660 | OPRK1 | G36T | Exon 1 | Pro12Pro | Chr08: 54326115 | TaqMan |
| OPRK1^3 | rs6985606 | OPRK1 | C/T | Intron 1 | Chr08: 54323669 | TaqMan | |
| OPRK1^4 | rs997917 | OPRK1 | C/T | Intron 1 | Chr08: 54314931 | TaqMan | |
| OPRK1^5 | rs702764 | OPRK1 | C843T | Exon 3 | Ala281Ala | Chr08: 54304710 | TaqMan |
| OPRK1^6 | rs963549 | OPRK1 | C/T | Exon 3 (UTR) | Chr08: 54304377 | PCR-RFLP | |
| OPRK1^7 | rs7820807 | OPRK1 | C/T | Downstream | Chr08: 54301414 | TaqMan |
Abbreviations: RFLP, restriction fragment length polymorphism; SNP, single nucleotide polymorphism; UTR, untranslated region.
Four OPRD1 SNPs (OPRD1^1, -^2, -^3 and -^10) and one OPRK1 SNP (OPRK1^6) were genotyped by the PCR-restriction fragment length polymorphism (PCR-RFLP) technique. The genotyping methods for OPRD1^2 (G80T or Cys27Phe) and OPRD1^10 (G921T or Gly307Gly) were described previously.41 Primer pairs, PCR conditions and enzyme digestions for OPRD1^1, OPRD1^3 and OPRK1^6 are presented in Supplementary Table S1 in Supplementary Materials. Approximately 8% of samples were re-genotyped by PCR-RFLP as a quality check, with complete concordance. Among the five SNPs, three had already been genotyped in some subjects using PCR-RFLP before the 5′ nuclease assay method, that is, the TaqMan technique,49 was available to us; so genotyping for these markers was completed by this method. Because two other SNPs (OPRD1^1 and OPRD1^2) have a low frequency (< 2%) of the homozygote for the minor allele, the TaqMan assay could not cluster the three groups of genotypes (minor allele homozygote, heterozygote, and major allele homozygote) clearly, so the PCR-RFLP method was used to genotype them. All other SNPs (seven OPRD1 SNPs and six OPRK1 SNPs) were genotyped with the TaqMan technique. PCR conditions were as described in our previous study.37 Genotyping was performed in duplicate and compared to ensure validity of the data. The genotype discordant (that is, non-matching) rate was < 0.5% for both case and control samples. Initially, OPRD1 and OPRK1 SNPs were genotyped in the first set of samples. If significant differences in allele or genotype frequency distributions between cases and controls were observed, markers were also genotyped in the newly collected subjects (‘Set B’).
To examine whether population structure existed in our sample, 38 ancestry informative markers (AIMs) described previously50,51 were genotyped in all subjects. They included two sets of short tandem repeat (STR) markers (15 loci used for forensic purposes: TPOX, D2S1338, D3S1358, FGA, D5S818, CSF1PO, D7S820, D8S1179, TH01, vWA, D13S317, D16S539, D21S11, D18S51 and D19S443; 22 markers known to have high δ-values (or highly different ancestry informative contents) between EAs and African Americans (AAs): D1S2628, D1S196, D2S319, D2S162, D5S407, D5S410, D6S1610, D7S2469, D7S657, D7S640, D8S1827, D8S272, D9S175, D10S197, D10S1786, D11S935, D12S352, D14S68, D15S1002, D16S3017, D17S799 and D22S274) and one SNP marker rs2814778 (the Duffy antigen gene (FY) marker, in which the FY null allele is almost absent in Europeans, but its frequency is between 75 and 85% in AAs52). The STR markers were analyzed on an ABI PRISM 3100 semi-automated capillary fluorescence sequencer and the SNP marker FY was genotyped by PCR-RFLP or as a TaqMan assay.
Statistical analysis
Population structure analysis
We used the program STRUCTURE 2.153,54 to infer ancestry proportions for all of our EA subjects. To facilitate ancestry proportion calculation for our EA cases and controls, genotype data from the 38 AIMs obtained from 214 AAs (as references, including 164 substance-dependent cases and 50 controls, described previously by Luo et al.55) were also integrated in the analysis. The length of burn-in and the number of Markov Chain Monte Carlo (MCMC) repetitions after burn-in were both set at 100 000. The proposed number of populations was set at 2 (K= 2). Subsequently, we employed the program STRAT56 to determine whether population structure is a concern in our case–control sample. STRAT produces χ2-values and simulated P-values under the assumption of no population structure. If the EA case and control samples were mismatched (or population structure is a problem), structured association (SA) analyses can be conducted via this program by incorporating the genotype data of the markers of the candidate genes. In the absence of a mismatch, it is unnecessary to perform the SA analysis.
LD analysis
The level of LD between SNPs at OPRD1 and OPRK1 was analyzed in cases and controls separately and in all samples combined using the Haploview program, version 3.2.57 Standardized LD coefficients (D′) for all SNP pairs were calculated and visualized. Haplotype blocks were defined according to the criteria of Gabriel et al.58
Hardy–Weinberg equilibrium test
Hardy–Weinberg equilibrium (HWE) was tested in both cases and controls using the HWSIM program (described in Cubells et al.59). P-values (two-tailed) were estimated empirically through the use of Monte Carlo simulations (10 000 iterations) based on observed genotype frequency. Significance levels were determined as the proportion of times the simulated distribution reached or exceeded the observed deviation from HWE. In addition, if Hardy-Weinberg disequilibrium (HWD) was present in cases or controls or both samples, the program developed in Mathematica (version 5.2)60 was applied to analyze whether the observed departure was due to genotyping error or to underlying biology. A goodness-of-fit test was used to identify the genetic disease model with the best fit to the genotypic proportions observed in cases and controls. If the ‘best-fit’ model is a poor fit to the observed data, as assessed by a χ2 test with 2 degrees of freedom (d.f.) for a restrictive (dominant, recessive, additive or multiplicative) model and with 1 d.f. for a general model, then it is unlikely that the underlying genetic disease model has generated the observed HWD. Thus, alternative explanations for the HWD, including chance, genotyping error and/or violations of the requisite assumptions of HWE, must be considered.
Allelic association analysis
Allele and genotype frequencies of OPRD1 and OPRK1 markers were compared between cases and controls through the single-locus case–control test function in the program PowerMarker 3.0.61 The SNPSpD method,62 which considers marker LD information and generates an experiment-wide significance threshold required to keep the type I error rate at 5%, was used to correct for multiple testing.
Haplotype association analysis
Haplotype analysis can be more powerful than single-marker analysis in detecting disease association if a combination of polymorphisms acts in concert to affect gene function.63 Haplotypes were reconstructed and their frequencies were estimated using the expectation– maximization (EM) algorithm (which assumes HWE) implemented in the HelixTree Genetics Analysis software (Golden Helix, Bozeman, MT, USA). Two algorithms in HelixTree, either the EM algorithm (which assumes HWE) or the composite haplotype method (which considers departure from HWE), can be used to reconstruct haplotypes. Because only two of the 18 SNPs of OPRD1 and OPRK1 showed deviation from HWE and the significance did not withstand correction for multiple comparisons, we used the EM algorithm to calculate both haplotype frequencies and haplotype probabilities. The effects of haplotypes were estimated using haplotype trend regression (HTR) in HelixTree.64 Initially, we performed haplotype analyses through the three-locus moving window approach; then, to examine the possible effect of haplotypes harboring alleles of SNPs distributed in the whole OPRD1 region, six tag SNPs were selected from the 11 OPRD1 SNPs with the Tagger program incorporated in Haploview 3.257 for haplotype analyses. This is because (i) a small fraction of SNPs (or tag SNPs) can capture most of the haplotype structure of a gene, and (ii) if all 11 OPRD1 SNPs were included, a large number of haplotypes would have been generated, thereby decreasing the power of haplotype analysis. For OPRK1, besides using the three-locus moving window method, we also employed all seven OPRK1 SNPs in haplotype analyses. Additionally, based on the genotype data of all OPRD1 and OPRK1 SNP markers in both cases and controls, HTR as implemented in HelixTree can compute probabilities of haplotypes in each subject and forms a tree regression on the trait using the haplotype probabilities as the regression matrix. This method is similar to a multiple regression, where covariates are the probability of the presence of each haplotype. Then a significance test for the effect of individual haplotypes on the trait is applied.
Logistic regression analysis
Because age and sex, which were asymmetrically distributed in our cases and controls, could confound the case–control study results, they were controlled for in the analysis. A backward stepwise logistic regression analysis, implemented in SPSS 13.0 (SPSS Inc, Chicago, IL, USA), was applied to test the association between OPRD1 and OPRK1 markers and SD. In the regression model, the phenotype served as the dependent variable and the covariates included sex, age and probabilities of alleles, genotypes and haplotypes. The estimated probability of a specific haplotype in each subject was obtained using HTR. Detailed regression analysis methods were described previously. 37,65 Only those factors (sex, age, alleles or haplotypes), which contribute most to the difference between cases and controls, would be retained in the final regression step.
Results
Bayesian clustering implemented in the program STRUCTURE revealed that both self-reported EA cases (n = 620) and controls (n = 443) were ‘genetic’ EAs. The average EA ancestry proportions for cases and controls were 0.977 (s.d. = 0.047) and 0.979 (s.d. = 0.046), respectively. In contrast, the mean EA ancestry proportion for the 214 AA reference subjects was 0.048 (s.d = 0.103). Moreover, the program STRAT revealed no significant difference in ancestry proportions between EA cases and controls (Σχ2 = 291.99, d.f. = 292, P = NS). Therefore, population admixture in our sample can be neglected, and additional SA analyses are unnecessary.
LD analysis results are shown in Figure 1. The majority of OPRD1 SNPs (OPRD1^1–OPRD1^9) were distributed in a single haplotype block. The two remaining SNPs (OPRD1^10 and OPRD1^11), located 793 bp apart in the 3′ region, are in another haplotype block. Two pairs of SNPs were in high LD (OPRD1^1 and OPRD1^2: D′ = 0.95, r2 = 0.833; OPRD1^5 and OPRD1^6: D′ = 0.97, r2 = 0.656). Among seven OPRK1 SNPs, five (OPRK1^3–OPRK1^7) were in one haplotype block. However, OPRK1^1 showed LD with both OPRK1^3 and OPRK1^4, and OPRK1^2 also showed LD with both OPRK1^3 and OPRK1^4. In addition, OPRK1^5 and OPRK1^6 were in close LD (D′ = 0.97, r2 = 0.663).
Figure 1.
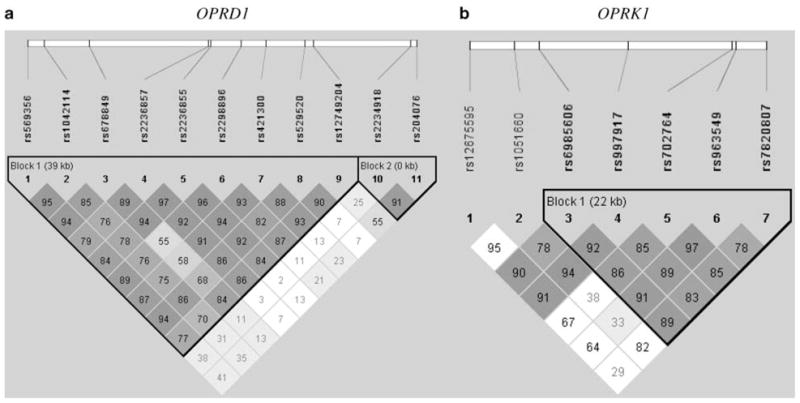
Linkage disequilibrium (LD) analysis of OPRD1 and OPRK1 markers in European Americans (EAs) (cases and controls together) ((a) 11 OPRD1 SNPs; (b) 7 OPRK1 SNPs). The numbers in the squares are D′ ×100.
No significant deviations from HWE were detected in controls for any OPRD1 SNPs, nor were there deviations from HWE in cases or controls for any OPRK1 SNPs. However, two OPRD1 SNPs showed departure from HWE in AD subjects (OPRD1^6, P = 0.01; OPRD1^9, P = 0.02) or in CD subjects (OPRD1^6, P = 0.02). None of these were significant after correction for multiple comparisons. In addition, the genotype distributions for these two SNPs were consistent with genetic models that best fit these data. The OPRD1^6 genotype data fit either an additive model for AD (χ2 = 1.43, d.f. = 2, P = 0.489) and DD (CD and/or OD) (χ2 = 0.56, d.f. = 2, P = 0.755) or a recessive model for DD (χ2 = 2.91, d.f. = 2, P = 0.234). The OPRD1^9 genotype data fit an additive model for both AD (χ2 = 4.55, d.f. = 2, P = 0.103) and DD (χ2 = 2.27, d.f. = 2, P = 0.322). In other words, the deviation from HWE of genotype distributions for OPRD1^6 and -^9 may reflect either random effects (particularly a problem with multiple testing of many SNPs) or a real disease association of these two markers. Additionally, the OPRD1 SNP, rs419335 (not listed in Table 1), which is located between OPRD1^3 and OPRD1^4 (6656 bp from OPRD1^3 and 9765 bp from OPRD1^4), was also genotyped by the TaqMan technique in all our case and control subjects. However, its genotype distribution was neither in HWE nor did it fit any of the disease models. Rechecking the allelic discrimination plot for this marker revealed that the three clusters of genotypes of this marker were not well separated, leading to the conclusion that the deviation was attributable to genotyping error, so it was excluded from analyses.
As shown in Table 2, nominally significant associations (P < 0.05) were obtained with allelic and genotypic association analyses: OPRD1^1 (in the 5′ region) and OD (allelic); OPRD1^2 (or G80T in exon 1) and OD (both allelic and genotypic); OPRD1^6 (in intron 1) and AD (genotypic), CD (genotypic) and OD (allelic); OPRD1^7 (in intron 1) and AD (genotypic) and CD (genotypic); and OPRD1^11 with OD (genotypic). OPRD1^2 (or G80T) showed a strong association with OD (allelic, P = 0.005; genotypic, P = 0.008). Its minor (G) allele was significantly more frequent in OD subjects (21.0%) than in controls (13.2%). In addition, the G80T heterozygote (C/T) showed a significantly higher frequency in OD subjects (32.4%) than in controls (24.2%) (Supplementary Table S2 in Supplementary Materials). To correct for multiple testing, we calculated the effective number of independent markers and the experiment-wide significance threshold required to keep the Type I error rate at 5%. The effective numbers of independent markers were 8.67, 8.71 and 8.74, respectively, for AD, CD and OD association analyses. Correspondingly, the threshold significance levels were 5.78×10⁻³, 5.74×10⁻³ and 5.72×10⁻³. Only the association between G80T and OD remained significant after correcting for multiple comparisons
Table 2.
P-values for comparisons of genotype and allele frequency distributions between cases and controls
| SNPs |
AD vs Con |
DD vs Con |
CD vs Con |
OD vs Con |
Pcorrection | ||||
|---|---|---|---|---|---|---|---|---|---|
| Pgene | Pallele | Pgene | Pallele | Pgene | Pallele | Pgene | Pallele | ||
| OPRD1^1 (rs569356) | 0.49 | 0.31 | 0.44 | 0.26 | 0.94 | 0.93 | 0.05 | 0.02 | NS |
| OPRD1^2 (rs1042114) | 0.10 | 0.33 | 0.11 | 0.16 | 0.45 | 0.63 | 0.008 | 0.005 | SIG |
| OPRD1^3 (rs678849) | 0.98 | 0.90 | 0.41 | 0.80 | 0.69 | 0.80 | 0.65 | 0.85 | NS |
| OPRD1^4 (rs2236857) | 0.18 | 0.24 | 0.30 | 0.56 | 0.20 | 0.49 | 0.36 | 0.15 | NS |
| OPRD1^5 (rs2236855) | 0.82 | 0.63 | 0.97 | 0.81 | 0.86 | 0.69 | 0.51 | 0.32 | NS |
| OPRD1^6 (rs2298896) | 0.02 | 0.16 | 0.07 | 0.40 | 0.04 | 0.60 | 0.09 | 0.04 | NS |
| OPRD1^7 (rs421300) | 0.02 | 0.09 | 0.04 | 0.21 | 0.02 | 0.27 | 0.11 | 0.06 | NS |
| OPRD1^8 (rs529520) | 0.76 | 0.76 | 0.72 | 0.75 | 0.89 | 0.95 | 0.71 | 0.66 | NS |
| OPRD1^9 (rs12749204) | 0.10 | 0.43 | 0.11 | 0.61 | 0.12 | 0.54 | 0.19 | 0.07 | NS |
| OPRD1^10 (rs2234918) | 0.91 | 0.65 | 0.83 | 0.70 | 0.80 | 0.56 | 0.93 | 0.74 | NS |
| OPRD1^11 (rs204076) | 0.13 | 0.72 | 0.04 | 0.17 | 0.16 | 0.63 | 0.03 | 0.17 | NS |
| OPRK1^1 (rs12675595) | 0.16 | 0.29 | 0.35 | 0.15 | 0.55 | 0.43 | 0.25 | 0.35 | NS |
| OPRK1^2 (rs1051660) | 0.06 | 0.13 | 0.61 | 0.85 | 0.15 | 0.86 | 0.30 | 0.43 | NS |
| OPRK1^3 (rs6985606) | 0.38 | 0.33 | 1.00 | 0.95 | 0.41 | 0.30 | 0.69 | 0.62 | NS |
| OPRK1^4 (rs997917) | 0.38 | 0.24 | 0.70 | 0.39 | 0.87 | 0.63 | 0.76 | 0.52 | NS |
| OPRK1^5 (rs702764) | 0.42 | 0.18 | 0.44 | 0.81 | 0.97 | 0.79 | 0.98 | 0.87 | NS |
| OPRK1^6 (rs963549) | 0.27 | 0.25 | 0.93 | 0.92 | 0.48 | 0.55 | 0.52 | 0.31 | NS |
| OPRK1^7 (rs7820807) | 0.56 | 0.26 | 0.84 | 0.62 | 0.80 | 0.49 | 0.95 | 0.74 | NS |
Abbreviations: AD, cases with alcohol dependence; CD, cases with cocaine dependence; Con, normal controls; DD, cases with drug (cocaine and/or opioid) dependence; OD, cases with opioid dependence.
Pgene, P-values for genotype frequency comparisons between cases and controls.
Pallele, P-values for allele frequency comparisons between cases and controls.
Pcorrection, significance of P-values after applying SNPSpD correction (NS = not significant; SIG = significant).
Note: Statistically significant P-values are in bold.
Using a moving window analysis of three SNPs, an association of a haplotype of alleles of SNPs OPRD1^3, -^4, and -^5 and OD was detected (global P-value after adjustment for multiple comparison or aP = 0.03). Moreover, moving window analyses indicated that two OPRK1 haplotypes were associated with AD (haplotype OPRK1^2-^3-^4: aP = 0.02; haplotype OPRK1^3-^4-^5: aP = 0.004). To analyze the possible association of OPRD1 and OPRK1 variants and SD using a different approach, six OPRD1 tag SNPs (selected by Tagger in Haploview) and all seven OPRK1 SNPs were included in haplotype analyses, results of which are summarized in Table 3. A significant difference in haplotype frequency distributions was found between OD subjects and controls (aP = 0.005). This global P-value might be attributable to rare haplotypes, because the global P-value computed from the haplotypes abundant enough to be listed (frequency > 2%) did not reach statistical significance (OD vs Con: χ2 = 0.38, P= 0.53). However, the frequency in cases of a specific OPRD1 haplotype GCAACT, which harbors the G-allele of G80T (in exon 1) and the C-allele of C921T (in exon 3), was more than double in controls (AD, 9.3%; CD, 9.1%; OD, 13.4%; controls, 4.7%). For OPRK1, no significant difference in haplotype frequencies was observed between cases and controls. Nevertheless, one specific OPRK1 haplotype GGCTTCT occurred significantly more frequently in AD subjects (25.4%) than in controls (18.6%) (χ2 = 8.12, d.f. = 1, P = 0.004). Furthermore, the positive results obtained from these two specific haplotypes (OPRD1 GCAACT and OPRK1 GGCTTCT) were confirmed by HTR analyses. As shown in Supplementary Table S3 in Supplementary Materials, GCAACT was the deleterious OPRD1 haplotype for AD (P < 0.005, β = 2.68, odds ratio (OR) = 14.55), CD (P = 0.01, β = 3.25, OR= 25.90) and OD (P < 0.001, β = 4.98, OR= 145.37), and GGCTTCT was the OPRK1 risk haplotype for AD only (P = 0.02, β = 0.52, OR= 1.68).
Table 3.
Comparison of haplotype frequency distributions between cases and controls
| Haplotypes | Controls | AD | DD | CD | OD |
|---|---|---|---|---|---|
| 6 OPRD1 Tag SNPsa (2-3-6-9-10-11) | n = 429 | n = 541 | n = 245 | n = 213 | n = 103 |
| TTAATA | 0.243 | 0.255 | 0.252 | 0.254 | 0.294 |
| TTAACT | 0.133 | 0.115 | 0.120 | 0.119 | 0.119 |
| TCCGTA | 0.122 | 0.118 | 0.117 | 0.118 | 0.093 |
| TCCACT | 0.059 | 0.051 | 0.060 | 0.047 | 0.068 |
| TTCATA | 0.056 | 0.056 | 0.047 | 0.055 | 0.033 |
| TTAACA | 0.048 | 0.046 | 0.032 | 0.039 | 0.015 |
| GCAACTb | 0.047 | 0.093 | 0.106 | 0.091 | 0.134 |
| TCAATA | 0.043 | 0.041 | 0.036 | 0.034 | 0.039 |
| GCAATA | 0.043 | 0.033 | 0.031 | 0.030 | 0.032 |
| TCCGCT | 0.038 | 0.020 | 0.022 | 0.023 | 0.012 |
| TCCATA | 0.035 | 0.028 | 0.031 | 0.036 | 0.027 |
| TCAACT | 0.028 | 0.033 | 0.028 | 0.035 | 0.019 |
| TCCGCA | 0.024 | 0.030 | 0.028 | 0.031 | 0.024 |
| aP (by EM)c | 0.10 | 0.18 | 0.49 | 0.005 | |
| All 7 OPRK1 SNPs (1-2-3-4-5-6-7) | n = 329 | n = 310 | n = 190 | n = 163 | n = 89 |
| GGTTTCT | 0.448 | 0.402 | 0.399 | 0.391 | 0.411 |
| GGCTTCTd | 0.186 | 0.254 | 0.231 | 0.243 | 0.235 |
| GGCCCTC | 0.099 | 0.065 | 0.081 | 0.088 | 0.088 |
| AGCCTCT | 0.077 | 0.071 | 0.065 | 0.064 | 0.054 |
| GGCCTCT | 0.060 | 0.067 | 0.067 | 0.064 | 0.047 |
| GTCCTCT | 0.051 | 0.043 | 0.043 | 0.049 | 0.033 |
| GTCCTTT | 0.030 | 0.022 | 0.027 | 0.026 | 0.049 |
| aP (by EM)c | 0.33 | 0.82 | 0.78 | 0.61 |
Abbreviations: AD, alcohol dependence; CD, cocaine dependence; Con, normal controls; DD, drug dependence; EM, expectation–maximization; OD, opioid dependence; SNP, single nucleotide polymorphism.
Six OPRD1 Tag SNPs were selected by Tagger in Haploview from 11 OPRD1 SNPs.
OPRD1 haplotye GCAACT was significantly more frequent in AD (χ2 = 14.82, d.f. = 1, P < 0.001), CD (χ2 = 9.19, d.f. = 1, P = 0.002) and OD (χ2 = 20.68, d.f. = 1, P < 0.001) subjects than in controls.
Global adjusted P-values were obtained by the EM algorithm.
OPRK1 haplotype GGCTTCT was significant more frequent in AD subjects than in controls (χ2 = 8.12, d.f. = 1, P = 0.004). n, number of subjects (those without genotype data for more than three OPRD1 tag SNPs were not included in OPRD1 haplotype analyses; those without genotype data for more than four OPRK1 SNPs were not included in OPRK1 haplotype analyses).
Note: Rare haplotypes (frequency < 2%) of OPRD1 and OPRK1 are not listed in the table. Statistically significant P-values are in bold.
There were significantly more males among cases (P < 0.01) and cases were significantly older than control subjects (P < 0.01) (Tables 4 and 5). When potential confounding effects of sex and age were considered in backward logistic regression analyses in three genetic models (additive, dominant and recessive), four OPRD1 markers (OPRD1^2, -^4, -^7 and -^9) showed association with SD (Table 4). Specifically, the minor (G) allele of OPRD1^2 (or G80T), which was significantly more frequent in OD subjects than in controls, was a risk factor for OD and it exerted its effect on susceptibility to OD via an additive mode of action (P = 0.04, β = 1.27, OR= 3.56). In contrast, the minor (C) allele of OPRD1^7 was a protective allele for AD, consistent with a dominant mode of action (P = 0.04, β =−0.83, OR= 0.44). Moreover, logistic regression analyses with the recessive model demonstrated that the minor allele (the G-allele) of OPRD1^4 might play a protective role for CD (P = 0.04, β = −1.80, OR= 0.16), whereas the minor allele (the G-allele) of OPRD1^9 might exert a risk effect on CD (P = 0.03, β = 2.17, OR= 8.79). Additionally, haplotype logistic regression analyses, which also took sex and age into consideration, confirmed the haplotype association results, that is, the OPRD1 haplotype GCAACT might have a risk effect on AD (P = 0.03, β = 1.86, OR= 6.43) and has a significant risk effect on OD (P < 0.001, β = 3.92, OR= 50.57). The logistic regression analysis results for OPRK1 are summarized in Table 5. Three OPRK1 SNPs (OPRK1^2, OPRK1^3 and OPRK1^4) were shown to be associated with AD or CD. The minor (T) allele of OPRK1^3 showed a protective effect on CD through an additive mode of action (P = 0.02, β =−1.07, OR= 0.34); the minor (T) allele of OPRK1^2 might exert a risk effect on CD (P = 0.03, β = 2.61, OR= 13.65), and the minor (C) allele of OPRK1^4 might play a protective role for AD (P = 0.005, β =−1.08, OR= 0.33) and CD (P = 0.02, β =−1.00, OR= 0.37), both consistent with a recessive mode of action. Furthermore, OPRK1 haplotype GGCTTCT might contribute to risk for AD (P = 0.009, β = 1.06, OR= 2.90) and possibly for CD (P = 0.03, β = 1.02, OR= 2.76) (Tables 4 and 5).
Table 4.
Backward stepwise logistic regression (LR) analysis of OPRD1 SNPs in cases and controls
| Variables |
AD vs Con |
DD vs Con |
CD vs Con |
OD vs Con |
||||||||
|---|---|---|---|---|---|---|---|---|---|---|---|---|
| P | β | OR | P | β | OR | P | β | OR | P | β | OR | |
| Genotype LR additive | ||||||||||||
| Male | < 0.001 | −1.78 | 0.17 | < 0.001 | 1.74 | 5.73 | < 0.001 | 1.95 | 7.00 | 0.009 | 0.89 | 2.43 |
| Age | < 0.001 | 0.17 | 1.19 | < 0.001 | 0.14 | 1.15 | < 0.001 | 0.15 | 1.16 | < 0.001 | 0.12 | 1.12 |
| OPRD1^2^G | — | — | — | — | — | — | — | — | — | 0.04 | 1.27 | 3.56 |
| Genotype LR dominant | ||||||||||||
| Male | < 0.001 | 1.81 | 6.12 | < 0.001 | 1.76 | 5.79 | < 0.001 | 1.96 | 7.13 | 0.009 | 0.88 | 2.40 |
| Age | < 0.001 | 0.18 | 1.19 | < 0.001 | 0.14 | 1.15 | < 0.001 | 0.15 | 1.16 | < 0.001 | 0.12 | 1.12 |
| OPRD1^5^T | 0.06 | 0.75 | 2.12 | 0.09 | 0.77 | 2.16 | 0.09 | 0.83 | 2.28 | — | — | — |
| OPRD1^7^C | 0.04 | −0.83 | 0.44 | 0.08 | −0.82 | 0.44 | 0.07 | −0.88 | 0.41 | — | — | — |
| Genotype LR recessive | ||||||||||||
| Male | < 0.001 | 1.82 | 6.18 | < 0.001 | 1.79 | 6.02 | < 0.001 | 1.94 | 6.94 | 0.003 | 1.02 | 2.78 |
| Age | < 0.001 | 0.18 | 1.19 | < 0.001 | 0.14 | 1.15 | < 0.001 | 0.15 | 1.16 | < 0.001 | 0.12 | 1.13 |
| OPRD1^2^G | — | — | — | 0.05 | 2.03 | 7.63 | — | — | — | — | — | — |
| OPRD1^4^G | 0.07 | −0.72 | 0.49 | 0.03 | −1.70 | 0.18 | 0.04 | −1.80 | 0.16 | 0.09 | −1.22 | 0.29 |
| OPRD1^9^G | — | — | — | 0.02 | 2.12 | 8.32 | 0.03 | 2.17 | 8.79 | — | — | — |
| Haplotype LR | ||||||||||||
| Male | < 0.001 | 1.48 | 4.38 | < 0.001 | 1.46 | 4.31 | < 0.001 | 1.54 | 4.67 | < 0.001 | 0.94 | 2.55 |
| Age | < 0.001 | 0.16 | 1.17 | < 0.001 | 0.13 | 1.13 | < 0.001 | 0.13 | 1.14 | < 0.001 | 0.11 | 1.12 |
| OPRD1^GCAACT | 0.03 | 1.86 | 6.43 | 0.01 | 2.32 | 10.18 | — | — | — | < 0.001 | 3.92 | 50.57 |
Abbreviations: AD, cases with alcohol dependence; CD, cases with cocaine dependence; Con, normal controls; DD, cases with drug (cocaine and/or opioid) dependence; OD, cases with opioid dependence.
Note: Only the covariates that were retained in the final regression step are listed. Statistically significant P-values are in bold.
Table 5.
Backward stepwise logistic regression (LR) analysis of OPRK1 SNPs in cases and controls
| Variables |
AD vs Con |
DD vs Con |
CD vs Con |
OD vs Con |
||||||||
|---|---|---|---|---|---|---|---|---|---|---|---|---|
| P | β | OR | P | β | OR | P | β | OR | P | β | OR | |
| Genotype LR additive | ||||||||||||
| Male | < 0.001 | 1.47 | 4.36 | < 0.001 | 1.25 | 3.51 | < 0.001 | 1.33 | 3.78 | 0.02 | 0.67 | 1.96 |
| Age | < 0.001 | 0.15 | 1.17 | < 0.001 | 0.12 | 1.13 | < 0.001 | 0.12 | 1.13 | < 0.001 | 0.12 | 1.12 |
| OPRK1^3^T | — | — | — | 0.05 | −0.82 | 0.44 | 0.02 | −1.07 | 0.34 | — | — | — |
| Genotype LR dominant | ||||||||||||
| Male | < 0.001 | 1.47 | 4.36 | < 0.001 | 1.22 | 3.38 | < 0.001 | 1.29 | 3.63 | 0.02 | 0.69 | 2.00 |
| Age | < 0.001 | 0.15 | 1.17 | < 0.001 | 0.11 | 1.12 | < 0.001 | 0.12 | 1.13 | < 0.001 | 0.11 | 1.12 |
| OPRK1^1^A | — | — | — | — | — | — | — | — | — | 0.07 | −0.79 | 0.45 |
| Genotype LR recessive | ||||||||||||
| Male | < 0.001 | 1.52 | 4.56 | < 0.001 | 1.27 | 3.58 | < 0.001 | 1.36 | 3.90 | 0.02 | 0.68 | 1.98 |
| Age | < 0.001 | 0.16 | 1.18 | < 0.001 | 0.12 | 1.13 | < 0.001 | 0.13 | 1.14 | < 0.001 | 0.12 | 1.12 |
| OPRK1^2^T | 0.06 | 2.30 | 9.93 | 0.04 | 2.47 | 11.80 | 0.03 | 2.61 | 13.65 | — | — | — |
| OPRK1^3^T | 0.05 | −0.59 | 0.55 | — | — | — | 0.07 | −0.60 | 0.55 | — | — | — |
| OPRK1^4^C | 0.005 | −1.08 | 0.33 | 0.02 | −0.89 | 0.41 | 0.02 | −1.00 | 0.37 | 0.07 | −0.92 | 0.40 |
| Haplotype LR | ||||||||||||
| Male | < 0.001 | 1.47 | 4.33 | < 0.001 | 1.24 | 3.45 | < 0.001 | 1.30 | 3.66 | 0.007 | 0.74 | 2.10 |
| Age | < 0.001 | 0.15 | 1.16 | < 0.001 | 0.12 | 1.13 | < 0.001 | 0.12 | 1.13 | < 0.001 | 0.12 | 1.12 |
| OPRK1^GGCTTCT | 0.009 | 1.06 | 2.90 | 0.05 | 0.86 | 2.36 | 0.03 | 1.02 | 2.76 | — | — | — |
Abbreviations: AD, cases with alcohol dependence; CD, cases with cocaine dependence; Con, normal controls; DD, cases with drug (cocaine and/or opioid) dependence; OD, cases with opioid dependence; OR, odds ratio.
Note: Only the covariates that were retained in the final regression step are listed. Statistically significant P-values are in bold.
Discussion
The three major opioid receptors (μ, δ and κ) are members of the family of transmembrane-spanning G-protein-coupled receptors. Although they differ in their affinity for various opioid ligands and in their cellular distribution, they are structurally and functionally related. The analgesic, rewarding and adverse effects (for example, respiratory depression, constipation, tolerance and addiction) of opioids are mediated mainly through the μ-opioid receptor. However, agonists or antagonists of two other receptors (especially the δ-receptor) may mediate the pharmacological effects of μ-agonists. Several biochemical and pharmacological studies using μ- and δ-receptor ligands have shown an interaction to exist between μ- and δ-receptor.12,66,67 In contrast to the δ-receptor, the κ-receptor has been shown to be countermodulatory in interacting with μ- and δ-receptor, including modulating and reducing dopaminergic tone.14,15 Several published studies, including two of our previous studies (discussed in Zhang et al.37), have demonstrated an association between μ-receptor gene (OPRM1) variants and AD and/or DD. Meta-analysis showed no association of one polymorphism, A118G, and SD.38 Owing to the close relationship among these three opioid receptors, we examined the possible association of the two other opioid receptor genes, OPRD1 and OPRK1, which encode the δ- and κ-receptor, respectively, with SD (alcohol or drug). In comparison to the positive association results of OPRD1 and OPRK1 from earlier studies,40,46,48 the present study not only confirmed some previous findings but also provided new evidence of the association of these two receptor genes with SD.
First, OPRD1 variant G80T in exon 1 may be associated with OD in EAs. We found that the 80G-allele was significantly more frequent in OD cases (21.0%) than in normal controls (13.2%). The high frequency of this allele in OD cases demonstrates that it might be a genetic risk factor for the disorder. Considering the importance of marker allele frequency in controls for genetic association analyses, we compared G80T allele frequencies obtained in this study and in previous reports. The 80G-allele had a frequency of 17.2% (which was higher than we reported for our controls) in Caucasians,68 but only 9.0% (which is lower than we reported for controls in the present study) in 152 EA control subjects (they were actually included in our ‘Set A’ control samples).41 Also, allele frequencies of this non-synonymous substitution (Cys27Phe) vary substantially by population. The frequency of the 80G-allele (or Cys27) was reported to be 0.09 in EAs and Ashkenazi Jews and 0.03 in AAs, but was absent in Chinese and Japanese.41,43,44 The rarity of this allele in the Chinese population might explain the negative association to phenotype of G80T in studies by Xu et al.43 and Loh et al.44 In addition, marker OPRD1^1, which is located in the 5′ region and is 2289 bp distant to G80T, also showed an association with OD. Similarly, the minor (C) allele of OPRD1^1 had a significantly higher frequency in OD cases (19.0%) than in normal controls (12.4%). Because these two SNPs were in high LD (in the same haplotype block), it is unclear whether either or both, or some other variants in the same haplotype block, are involved in determining risk for OD. SNP OPRD1^1 is in the putative regulatory region, and may therefore affect the transcription level of the gene. SNP G80T is in exon 1; it directly changes the amino-acid sequence and may alter the protein structure and therefore possibly the function of the δ-receptor. Therefore, to address the issue of whether these two SNPs are both disease variants, further pharmacological and functional studies are warranted.
Second, we found no association between another OPRD1 exonic variant, G921T (Gly307Gly or OPRD1^10), and AD or DD by individual marker analyses. Because the initial report by Mayer et al.40 that G921T was associated with heroin dependence (that is, a significantly higher frequency of the C-allele and the C/C genotype in heroin addicts (53.0%) than in controls (39.0%) in a German population, at least three follow-up studies have failed to confirm the findings. Of these, Franke et al.42 used both case– control and family-based association designs also in a German population, but were unable to replicate the association. Furthermore, two other studies did not detect significant association between this variant and heroin dependence42,43 or AD42,44 in two Chinese Han Populations (one from Taiwan and another from Southwestern China). Franke et al.42 noted that the results by Mayer et al.40 could be due to several reasons, such as a chance finding, population stratification, or strong LD of this marker with an unknown functional polymorphism in OPRD1. Xu et al.43 even presumed the existence of LD between G921T and G80T. In this study, we did not detect LD between G921T and nine of 11 OPRD1 SNPs (including G80T), although there was high LD between G921T and OPRD1^11 (a marker situated in the downstream region of OPRD1, only 793 bp from G921T). As discussed below, no population stratification was shown in our case or control samples. Taken together, even though we cannot completely exclude an association, it seems unlikely that G921T plays an important role in SD.
Third, we present evidence that a specific OPRD1 haplotype GCAACT, consisting of alleles of six OPRD1 tag SNPs (note: the first allele G is from G80T and the fifth allele C is from C921T), may be a risk factor for SD (alcohol and drug) in EAs. In comparison to individual marker association analyses, haplotype analyses are believed to provide higher resolution and potentially greater power for identifying modest etiological effects of genes.68 Complex traits, including SD, are usually caused by the interaction of a group of genetic and non-genetic factors. Even if a susceptibility gene for a complex trait is identified, the association is not necessarily due to a single variant of the gene. An individual variant may not directly affect gene expression or protein function because the effect of this variant is likely to be regulated or modulated by other (possible cis-acting) variants in the gene. Taking the OPRD1 SNP C921T as an example, when it was considered individually, no association was found between this variant and SD. However, when it was investigated against the background of a series of OPRD1 markers, its risk effect on SD was exposed. We assume that part of the reason that three previous studies42–44 did not detect a risk effect of the C-allele of OPRD1 C921T on SD is that this variant was not studied together with other OPRD1 variants. Studies of cis-acting variation in gene expression suggest that cis-acting genetic variants are one of the main sources of variability in human phenotype, including susceptibility to diseases. 69,70 Thus, it is possible that either the functional OPRD1 variant G80T in exon 1 serves as a functional cis-acting modifier variant for SNP C921T, or that an unknown functional cis-acting polymorphism exists in close LD with SNP C921T, and it is harbored in the haplotype region covering the six OPRD1 tag SNPs.
Fourth, OPRK1 haplotype analyses provide another good example of this kind of observation. Although none of the seven OPRK1 SNPs showed an association with SD individually (by genetic association analysis), when they were considered jointly, a strong association was shown for haplotype GGCTTCT with AD (a weak association with CD was also observed). Similarly, in a previous study by Yuferov et al.,46 the association between OPRK1 and opiate addiction was observed in a Hispanic population only by the haplotype approach. Considering our research results in the context of the findings from others, it seems that OPRK1 variants show an additive interaction effect on susceptibility to SD. The expression level of OPRK1 in SD subjects may either be significantly decreased or increased due to the interaction of its gene variants. However, this speculation needs to be verified by haplotype functional studies.
Fifth, population structure analyses excluded population stratification artifact in our EA subjects. To solve the problem of sample stratification in studying the association of OPRD1 with SD, two previous studies used either a family-based approach42 or genotype data of genomic control loci.43 We addressed the issue by using genotype data for 38 ancestry informative markers, which can efficiently differentiate EAs and AAs, the two major populations in the United States. By population structure analyses, we excluded the possibility that our allelic and haplotype association results were due to population stratification (as represented by differing AA admixture within the EAs we studied).
In summary, this study provides evidence of association between OPRD1 and SD (that is, AD and/or CD and/or OD), and between OPRK1 and AD (and possibly CD). In contrast to the study of OPRD1 by Mayer et al.,40 we did not observe an association between the synonymous variant C921T and OD (though a specific haplotype harboring its C-allele was associated with AD, CD, and especially with OD); instead, a significant association between the non-synonymous variant G80T (or Cys27Phe) and OD was observed. Moreover, our results are consistent with the findings from a recent study by Xuei et al.48 that OPRK1 variants are associated with risk for AD. They found that five SNP variants in OPRK1 intron 2 were associated with AD. In this study, no variants in intron 2 were analyzed; however, an OPRK1 haplotype consisting of alleles of seven OPRK1 SNPs located in other regions of the gene showed a risk effect on AD. All in all, the findings from this study and previous studies suggest that the δ- and κ-receptor play an important role in AD or DD, either alone or through interaction among the three receptors (μ, δ and κ). Future studies of the functional effects of variants of these three receptor genes will facilitate further understanding of the mechanism of their association with SD.
Supplementary Material
Acknowledgments
We appreciate excellent technical assistance from Ann Marie Lacobelle, Greg Kay and Yakov D Lozovatsky. This work was supported in part by funds from the National Institute on Drug Abuse (R01DA12849, R01DA12690 and K24DA15105), the National Institute on Alcohol Abuse and Alcoholism (R01AA11330, P50AA12870, K08AA13732 and K24AA13736) and the National Center for Research Resources (M01RR06192; University of Connecticut General Clinical Research Center); and the US Department of Veterans Affairs (the National Center for PTSD Research, the VA Medical Research Program and the VA Connecticut-Massachusetts Mental Illness Research, Education and Clinical Center (MIRECC), and VA Research Enhancement Award Program (REAP), and MERIT program).
Footnotes
Supplementary Information accompanies the paper on the Molecular Psychiatry website (http://www.nature.com/mp)
References
- 1.Prescott CA, Kendler KS. Genetic and environmental contributions to alcohol abuse and dependence in a population-based sample of male twins. Am J Psychiatry. 1999;156:34–40. doi: 10.1176/ajp.156.1.34. [DOI] [PubMed] [Google Scholar]
- 2.Walters GD. The heritability of alcohol abuse and dependence: a meta-analysis of behavior genetic research. Am J Drug Alcohol Abuse. 2002;28:557–584. doi: 10.1081/ada-120006742. [DOI] [PubMed] [Google Scholar]
- 3.Tsuang MT, Lyons MJ, Eisen SA, Goldberg J, True W, Lin N, et al. Genetic influences on DSM-III-R drug abuse and dependence: a study of 3,372 twin pairs. Am J Med Genet. 1996;67:473–477. doi: 10.1002/(SICI)1096-8628(19960920)67:5<473::AID-AJMG6>3.0.CO;2-L. [DOI] [PubMed] [Google Scholar]
- 4.Tsuang MT, Lyons MJ, Meyer JM, Doyle T, Eisen SA, Goldberg J, et al. Co-occurrence of abuse of different drugs in men: the role of drug-specific and shared vulnerabilities. Arch Gen Psychiatry. 1998;55:967–972. doi: 10.1001/archpsyc.55.11.967. [DOI] [PubMed] [Google Scholar]
- 5.Matthes HW, Maldonado R, Simonin F, Valverde O, Slowe S, Kitchen I, et al. Loss of morphine-induced analgesia, reward effect and withdrawal symptoms in mice lacking the mu-opioid-receptor gene. Nature. 1996;383:819–823. doi: 10.1038/383819a0. [DOI] [PubMed] [Google Scholar]
- 6.Di CG, North RA. Neurobiology of opiate abuse. Trends Pharmacol Sci. 1992;13:185–193. doi: 10.1016/0165-6147(92)90062-b. [DOI] [PubMed] [Google Scholar]
- 7.Heyman JS, Vaught JL, Raffa RB, Porreca F. Can supraspinal delta-opioid receptors mediate antinociception? Trends Pharmacol Sci. 1988;9:134–138. doi: 10.1016/0165-6147(88)90195-2. [DOI] [PubMed] [Google Scholar]
- 8.Herz A. Endogenous opioid systems and alcohol addiction. Psychopharmacology Berl. 1997;129:99–111. doi: 10.1007/s002130050169. [DOI] [PubMed] [Google Scholar]
- 9.Zhu Y, King MA, Schuller AG, Nitsche JF, Reidl M, Elde RP, et al. Retention of supraspinal delta-like analgesia and loss of morphine tolerance in delta opioid receptor knockout mice. Neuron. 1999;24:243–252. doi: 10.1016/s0896-6273(00)80836-3. [DOI] [PubMed] [Google Scholar]
- 10.Cowan A, Zhu XZ, Mosberg HI, Omnaas JR, Porreca F. Direct dependence studies in rats with agents selective for different types of opioid receptor. J Pharmacol Exp Ther. 1988;246:950–955. [PubMed] [Google Scholar]
- 11.Maldonado R, Negus S, Koob GF. Precipitation of morphine withdrawal syndrome in rats by administration of mu-, delta- and kappa-selective opioid antagonists. Neuropharmacology. 1992;31:1231–1241. doi: 10.1016/0028-3908(92)90051-p. [DOI] [PubMed] [Google Scholar]
- 12.Traynor JR, Elliott J. delta-Opioid receptor subtypes and cross-talk with mu-receptors. Trends Pharmacol Sci. 1993;14:84–86. doi: 10.1016/0165-6147(93)90068-u. [DOI] [PubMed] [Google Scholar]
- 13.Filliol D, Ghozland S, Chluba J, Martin M, Matthes HW, Simonin F, et al. Mice deficient for delta- and mu-opioid receptors exhibit opposing alterations of emotional responses. Nat Genet. 2000;25:195–200. doi: 10.1038/76061. [DOI] [PubMed] [Google Scholar]
- 14.Suzuki T, Narita M, Takahashi Y, Misawa M, Nagase H. Effects of nor-binaltorphimine on the development of analgesic tolerance to and physical dependence on morphine. Eur J Pharmacol. 1992;213:91–97. doi: 10.1016/0014-2999(92)90237-x. [DOI] [PubMed] [Google Scholar]
- 15.Narita M, Takahashi Y, Takamori K, Funada M, Suzuki T, Misawa M, et al. Effects of kappa-agonist on the antinociception and locomotor enhancing action induced by morphine in mice. Jpn J Pharmacol. 1993;62:15–24. doi: 10.1254/jjp.62.15. [DOI] [PubMed] [Google Scholar]
- 16.Pfeiffer A, Brantl V, Herz A, Emrich HM. Psychotomimesis mediated by kappa opiate receptors. Science. 1986;233:774–776. doi: 10.1126/science.3016896. [DOI] [PubMed] [Google Scholar]
- 17.Turchan J, Przewlocka B, Toth G, Lason W, Borsodi A, Przewlocki R. The effect of repeated administration of morphine, cocaine and ethanol on mu and delta opioid receptor density in the nucleus accumbens and striatum of the rat. Neuroscience. 1999;91:971–977. doi: 10.1016/s0306-4522(98)00637-x. [DOI] [PubMed] [Google Scholar]
- 18.Kim JA, Pollak KA, Hjelmstad GO, Fields HL. A single cocaine exposure enhances both opioid reward and aversion through a ventral tegmental area-dependent mechanism. Proc Natl Acad Sci USA. 2004;101:5664–5669. doi: 10.1073/pnas.0401373101. [DOI] [PMC free article] [PubMed] [Google Scholar]
- 19.Mitchell JM, Liang MT, Fields HL. A single injection of the kappa opioid antagonist norbinaltorphimine increases ethanol consumption in rats. Psychopharmacology Berl. 2005;182:384–392. doi: 10.1007/s00213-005-0067-7. [DOI] [PubMed] [Google Scholar]
- 20.Froehlich JC, Zweifel M, Harts J, Lumeng L, Li TK. Importance of delta opioid receptors in maintaining high alcohol drinking. Psychopharmacology Berl. 1991;103:467–472. doi: 10.1007/BF02244246. [DOI] [PubMed] [Google Scholar]
- 21.Di CG, Acquas E, Tanda G. Ethanol as a neurochemical surrogate of conventional reinforcers: the dopamine-opioid link. Alcohol. 1996;13:13–17. doi: 10.1016/0741-8329(95)02034-9. [DOI] [PubMed] [Google Scholar]
- 22.Ciccocioppo R, Martin-Fardon R, Weiss F. Effect of selective blockade of mu1 or delta opioid receptors on reinstatement of alcohol-seeking behavior by drug-associated stimuli in rats. Neuropsychopharmacology. 2002;27:391–399. doi: 10.1016/S0893-133X(02)00302-0. [DOI] [PubMed] [Google Scholar]
- 23.O’Malley SS, Jaffe AJ, Chang G, Schottenfeld RS, Meyer RE, Rounsaville B. Naltrexone and coping skills therapy for alcohol dependence. A controlled study. Arch Gen Psychiatry. 1992;49:881–887. doi: 10.1001/archpsyc.1992.01820110045007. [DOI] [PubMed] [Google Scholar]
- 24.Volpicelli JR, Alterman AI, Hayashida M, O’brien CP. Naltrexone in the treatment of alcohol dependence. Arch Gen Psychiatry. 1992;49:876–880. doi: 10.1001/archpsyc.1992.01820110040006. [DOI] [PubMed] [Google Scholar]
- 25.Heidbreder C, Goldberg SR, Shippenberg TS. Inhibition of cocaine-induced sensitization by the delta-opioid receptor antagonist naltrindole. Eur J Pharmacol. 1993;243:123–127. doi: 10.1016/0014-2999(93)90370-w. [DOI] [PubMed] [Google Scholar]
- 26.Shippenberg TS, Heidbreder C. The delta-opioid receptor antagonist naltrindole prevents sensitization to the conditioned rewarding effects of cocaine. Eur J Pharmacol. 1995;280:55–61. doi: 10.1016/0014-2999(95)00185-n. [DOI] [PubMed] [Google Scholar]
- 27.Bond C, LaForge KS, Tian M, Melia D, Zhang S, Borg L, et al. Single-nucleotide polymorphism in the human mu opioid receptor gene alters beta-endorphin binding and activity: possible implications for opiate addiction. Proc Natl Acad Sci USA. 1998;95:9608–9613. doi: 10.1073/pnas.95.16.9608. [DOI] [PMC free article] [PubMed] [Google Scholar]
- 28.Szeto CY, Tang NL, Lee DT, Stadlin A. Association between mu opioid receptor gene polymorphisms and Chinese heroin addicts. Neuroreport. 2001;12:1103–1106. doi: 10.1097/00001756-200105080-00011. [DOI] [PubMed] [Google Scholar]
- 29.Tan EC, Tan CH, Karupathivan U, Yap EP. Mu opioid receptor gene polymorphisms and heroin dependence in Asian populations. Neuroreport. 2003;14:569–572. doi: 10.1097/00001756-200303240-00008. [DOI] [PubMed] [Google Scholar]
- 30.Bart G, Heilig M, LaForge KS, Pollak L, Leal SM, Ott J, et al. Substantial attributable risk related to a functional mu-opioid receptor gene polymorphism in association with heroin addiction in central Sweden. Mol Psychiatry. 2004;9:547–549. doi: 10.1038/sj.mp.4001504. [DOI] [PMC free article] [PubMed] [Google Scholar]
- 31.Schinka JA, Town T, Abdullah L, Crawford FC, Ordorica PI, Francis E, et al. A functional polymorphism within the mu-opioid receptor gene and risk for abuse of alcohol and other substances. Mol Psychiatry. 2002;7:224–228. doi: 10.1038/sj.mp.4000951. [DOI] [PubMed] [Google Scholar]
- 32.Town T, Abdullah L, Crawford F, Schinka J, Ordorica PI, Francis E, et al. Association of a functional mu-opioid receptor allele +118A with alcohol dependency. Am J Med Genet. 1999;88:458–461. [PubMed] [Google Scholar]
- 33.Kim SG, Kim CM, Kang DH, Kim YJ, Byun WT, Kim SY, et al. Association of functional opioid receptor genotypes with alcohol dependence in Koreans. Alcohol Clin Exp Res. 2004;28:986–990. doi: 10.1097/01.alc.0000130803.62768.ab. [DOI] [PubMed] [Google Scholar]
- 34.Bart G, Kreek MJ, Ott J, LaForge KS, Proudnikov D, Pollak L, et al. Increased attributable risk related to a functional mu-opioid receptor gene polymorphism in association with alcohol dependence in central Sweden. Neuropsychopharmacology. 2005;30:417–422. doi: 10.1038/sj.npp.1300598. [DOI] [PubMed] [Google Scholar]
- 35.Hoehe MR, Kopke K, Wendel B, Rohde K, Flachmeier C, Kidd KK, et al. Sequence variability and candidate gene analysis in complex disease: association of mu opioid receptor gene variation with substance dependence. Hum Mol Genet. 2000;9:2895–2908. doi: 10.1093/hmg/9.19.2895. [DOI] [PubMed] [Google Scholar]
- 36.Luo X, Kranzler HR, Zhao H, Gelernter J. Haplotypes at the OPRM1 locus are associated with susceptibility to substance dependence in European-Americans. Am J Med Genet B Neuropsychiatr Genet. 2003;120:97–108. doi: 10.1002/ajmg.b.20034. [DOI] [PubMed] [Google Scholar]
- 37.Zhang H, Luo X, Kranzler HR, Lappalainen J, Yang BZ, Krupitsky E, et al. Association between two {micro}-opioid receptor gene OPRM1 haplotype blocks and drug or alcohol dependence. Hum Mol Genet. 2006;15:807–819. doi: 10.1093/hmg/ddl024. [DOI] [PMC free article] [PubMed] [Google Scholar]
- 38.Arias A, Feinn R, Kranzler HR. Association of an Asn40Asp A118G polymorphism in the mu-opioid receptor gene with substance dependence: a meta-analysis. Drug Alcohol Depend. 2006;83:262–268. doi: 10.1016/j.drugalcdep.2005.11.024. [DOI] [PubMed] [Google Scholar]
- 39.Uhl GR, Childers S, Pasternak G. An opiate-receptor gene family reunion. Trends Neurosci. 1994;17:89–93. doi: 10.1016/0166-2236(94)90110-4. [DOI] [PubMed] [Google Scholar]
- 40.Mayer P, Rochlitz H, Rauch E, Rommelspacher H, Hasse HE, Schmidt S, et al. Association between a delta opioid receptor gene polymorphism and heroin dependence in man. Neuroreport. 1997;8:2547–2550. doi: 10.1097/00001756-199707280-00025. [DOI] [PubMed] [Google Scholar]
- 41.Gelernter J, Kranzler HR. Variant detection at the delta opioid receptor OPRD1 locus and population genetics of a novel variant affecting protein sequence. Hum Genet. 2000;107:86–88. doi: 10.1007/s004390000340. [DOI] [PubMed] [Google Scholar]
- 42.Franke P, Nothen MM, Wang T, Neidt H, Knapp M, Lichtermann D, et al. Human delta-opioid receptor gene and susceptibility to heroin and alcohol dependence. Am J Med Genet. 1999;88:462–464. doi: 10.1002/(sici)1096-8628(19991015)88:5<462::aid-ajmg4>3.0.co;2-s. [DOI] [PubMed] [Google Scholar]
- 43.Xu K, Liu XH, Nagarajan S, Gu XY, Goldman D. Relationship of the delta-opioid receptor gene to heroin abuse in a large Chinese case/control sample. Am J Med Genet. 2002;110:45–50. doi: 10.1002/ajmg.10374. [DOI] [PubMed] [Google Scholar]
- 44.Loh EW, Fann CS, Chang YT, Chang CJ, Cheng AT. Endogenous opioid receptor genes and alcohol dependence among Taiwanese Han. Alcohol Clin Exp Res. 2004;28:15–19. doi: 10.1097/01.ALC.0000106303.41755.B8. [DOI] [PubMed] [Google Scholar]
- 45.Vadasz C, Saito M, Gyetvai B, Mikics E, Vadasz C. Scanning of five chromosomes for alcohol consumption loci. Alcohol. 2000;22:25–34. doi: 10.1016/s0741-8329(00)00098-7. [DOI] [PubMed] [Google Scholar]
- 46.Yuferov V, Fussell D, LaForge KS, Nielsen DA, Gordon D, Ho A, et al. Redefinition of the human kappa opioid receptor gene OPRK1 structure and association of haplotypes with opiate addiction. Pharmacogenetics. 2004;14:793–804. doi: 10.1097/00008571-200412000-00002. [DOI] [PMC free article] [PubMed] [Google Scholar]
- 47.Gelernter J, Panhuysen C, Weiss R, Brady K, Hesselbrock V, Rounsaville B, et al. Genomewide linkage scan for cocaine dependence and related traits: significant linkages for a cocaine-related trait and cocaine-induced paranoia. Am J Med Genet B Neuropsychiatr Genet. 2005;136:45–52. doi: 10.1002/ajmg.b.30189. [DOI] [PubMed] [Google Scholar]
- 48.Xuei X, Dick D, Flury-Wetherill L, Tian HJ, Agrawal A, Bierut L, et al. Association of the kappa-opioid system with alcohol dependence. Mol Psychiatry. 2006;11:1016–1024. doi: 10.1038/sj.mp.4001882. [DOI] [PubMed] [Google Scholar]
- 49.Shi MM, Myrand SP, Bleavins MR, de la Iglesia FA. High throughput genotyping for the detection of a single nucleotide polymorphism in NADPH quinone oxidoreductase DT diaphorase using TaqMan probes. Mol Pathol. 1999;52:295–299. doi: 10.1136/mp.52.5.295. [DOI] [PMC free article] [PubMed] [Google Scholar]
- 50.Stein MB, Schork NJ, Gelernter J. A polymorphism of the beta1- adrenergic receptor is associated with low extraversion. Biol Psychiatry. 2004;56:217–224. doi: 10.1016/j.biopsych.2004.05.020. [DOI] [PubMed] [Google Scholar]
- 51.Yang BZ, Zhao H, Kranzler HR, Gelernter J. Practical population group assignment with selected informative markers: characteristics and properties of Bayesian clustering via STRUCTURE. Genet Epidemiol. 2005;28:302–312. doi: 10.1002/gepi.20070. [DOI] [PubMed] [Google Scholar]
- 52.Parra EJ, Marcini A, Akey J, Martinson J, Batzer MA, Cooper R, et al. Estimating African American admixture proportions by use of population-specific alleles. Am J Hum Genet. 1998;63:1839–1851. doi: 10.1086/302148. [DOI] [PMC free article] [PubMed] [Google Scholar]
- 53.Pritchard JK, Rosenberg NA. Use of unlinked genetic markers to detect population stratification in association studies. Am J Hum Genet. 1999;65:220–228. doi: 10.1086/302449. [DOI] [PMC free article] [PubMed] [Google Scholar]
- 54.Falush D, Stephens M, Pritchard JK. Inference of population structure using multilocus genotype data: linked loci and correlated allele frequencies. Genetics. 2003;164:1567–1587. doi: 10.1093/genetics/164.4.1567. [DOI] [PMC free article] [PubMed] [Google Scholar]
- 55.Luo X, Kranzler HR, Zuo L, Yang BZ, Lappalainen J, Gelernter J. ADH4 gene variation is associated with alcohol and drug dependence: results from family controlled and population-structured association studies. Pharmacogenet Genomics. 2005;15:755–768. doi: 10.1097/01.fpc.0000180141.77036.dc. [DOI] [PubMed] [Google Scholar]
- 56.Pritchard JK, Stephens M, Donnelly P. Inference of population structure using multilocus genotype data. Genetics. 2000;155:945–959. doi: 10.1093/genetics/155.2.945. [DOI] [PMC free article] [PubMed] [Google Scholar]
- 57.Barrett JC, Fry B, Maller J, Daly MJ. Haploview: analysis and visualization of LD and haplotype maps. Bioinformatics. 2005;21:263–265. doi: 10.1093/bioinformatics/bth457. [DOI] [PubMed] [Google Scholar]
- 58.Gabriel SB, Schaffner SF, Nguyen H, Moore JM, Roy J, Blumenstiel B, et al. The structure of haplotype blocks in the human genome. Science. 2002;296:2225–2229. doi: 10.1126/science.1069424. [DOI] [PubMed] [Google Scholar]
- 59.Cubells JF, Kobayashi K, Nagatsu T, Kidd KK, Kidd JR, Calafell F, et al. Population genetics of a functional variant of the dopamine beta-hydroxylase gene DBH. Am J Med Genet. 1997;74:374–379. doi: 10.1002/(sici)1096-8628(19970725)74:4<374::aid-ajmg7>3.0.co;2-p. [DOI] [PubMed] [Google Scholar]
- 60.Wittke-Thompson JK, Pluzhnikov A, Cox NJ. Rational inferences about departures from Hardy-Weinberg equilibrium. Am J Hum Genet. 2005;76:967–986. doi: 10.1086/430507. [DOI] [PMC free article] [PubMed] [Google Scholar]
- 61.Liu K, Muse SV. PowerMarker: an integrated analysis environment for genetic marker analysis. Bioinformatics. 2005;21:2128–2129. doi: 10.1093/bioinformatics/bti282. [DOI] [PubMed] [Google Scholar]
- 62.Nyholt DR. A simple correction for multiple testing for single-nucleotide polymorphisms in linkage disequilibrium with each other. Am J Hum Genet. 2004;74:765–769. doi: 10.1086/383251. [DOI] [PMC free article] [PubMed] [Google Scholar]
- 63.Terry CF, Loukaci V, Green FR. Cooperative influence of genetic polymorphisms on interleukin 6 transcriptional regulation. J Biol Chem. 2000;275:18138–18144. doi: 10.1074/jbc.M000379200. [DOI] [PubMed] [Google Scholar]
- 64.Zaykin DV, Westfall PH, Young SS, Karnoub MA, Wagner MJ, Ehm MG. Testing association of statistically inferred haplotypes with discrete and continuous traits in samples of unrelated individuals. Hum Hered. 2002;53:79–91. doi: 10.1159/000057986. [DOI] [PubMed] [Google Scholar]
- 65.Luo X, Kranzler HR, Zuo L, Wang S, Blumberg HP, Gelernter J. CHRM2 gene predisposes to alcohol dependence, drug dependence and affective disorders: results from an extended case-control structured association study. Hum Mol Genet. 2005;14:2421–2434. doi: 10.1093/hmg/ddi244. [DOI] [PubMed] [Google Scholar]
- 66.Jordan BA, Cvejic S, Devi LA. Opioids and their complicated receptor complexes. Neuropsychopharmacology. 2000;23:S5–S18. doi: 10.1016/S0893-133X(00)00143-3. [DOI] [PubMed] [Google Scholar]
- 67.Ananthan S. Opioid ligands with mixed mu/delta opioid receptor interactions: an emerging approach to novel analgesics. AAPS J. 2006;8:E118–E125. doi: 10.1208/aapsj080114. [DOI] [PMC free article] [PubMed] [Google Scholar]
- 68.The International HapMap Consortium. The International Hap- Map Project. Nature. 2003;426:789–796. doi: 10.1038/nature02168. [DOI] [PubMed] [Google Scholar]
- 69.Bray NJ, Buckland PR, Owen MJ, O’Donovan MC. Cis-acting variation in the expression of a high proportion of genes in human brain. Hum Genet. 2003;113:149–153. doi: 10.1007/s00439-003-0956-y. [DOI] [PubMed] [Google Scholar]
- 70.Pastinen T, Hudson TJ. Cis-acting regulatory variation in the human genome. Science. 2004;306:647–650. doi: 10.1126/science.1101659. [DOI] [PubMed] [Google Scholar]
Associated Data
This section collects any data citations, data availability statements, or supplementary materials included in this article.