

Abstract
To understand the molecular basis of sequential N-dealkylation by cytochrome P450 2B enzymes, the binding of amidopyrine (AP) as well as the metabolites of this reaction, desmethylamidopyrine (DMAP) and aminoantipyrine (AAP), were studied using the X-ray crystal structure of rabbit P450 2B4 and two nuclear magnetic resonance (NMR) techniques: saturation transfer difference (STD) spectroscopy and longitudinal (T1) relaxation NMR. STD NMR of AP and its metabolites bound to P450 2B4 were similar, suggesting that they occupy similar niches within the enzyme’s active site. The model-dependent relaxation rates (RM) determined from T1 relaxation NMR of AP and DMAP suggest that the N-linked methyl is closest to the heme. To determine the orientation(s) of AP and its metabolites within the P450 2B4 active site, distances calculated from the relaxation rates were used to constrain the metabolites to the X-ray crystal structure of P450 2B4. Simulated annealing of the complex revealed that the metabolites do indeed occupy similar hydrophobic pockets within the active site, while the N-linked methyl(s) are free to rotate between two binding modes. From these bound structures, a model of N-demethylation was developed, where the N-linked methyl functional groups rotate between catalytic and non-catalytic positions. This study is the first to provide a structural model of a drug and its metabolites complexed to a cytochrome P450 based on NMR and to provide a structural mechanism for how a drug can undergo sequential oxidations without unbinding. The rotation of the amide functional group might represent a common structural mechanism for N-dealkylation reactions for other drugs such as the local anesthetic lidocaine.
Keywords: N-dealkylation, sequential metabolism, paramagnetic relaxation enhancement, cytochrome P450 2B enzymes, nuclear magnetic resonance (NMR), saturation transfer difference (STD)
The mammalian cytochrome P450 (P450) 2B enzymes are responsible for the detoxification and elimination of a wide range of drugs from coumarins to amphetamines (1). P450 catalyzed N-dealkylation is one of the main reaction pathways of these enzymes and occurs through a single electron oxidation or hydrogen abstraction mechanism (2–4). Drugs such as the antidepressant sertraline and the anorectic drug benzphetamine are N-dealkylated in a single step (4, 5), while the local anesthetic lidocaine is sequentially N-dealkylated in a multi-step process (6). The later pathway leads to complicated metabolic profiles and distorted kinetics that often stymies predictions of in vitro and in vivo metabolism (7, 8).
Studies of sequential P450-mediated N-dealkylation reactions have successfully identified and characterized intermediates within a number of metabolic pathways (9). Kinetic isotope effects (2), redox potential (10) and radical probes (3, 11) have highlighted possible reaction mechanisms for the individual steps. X-ray crystal structures of P450 2B4 (1) and P450 2B6 (12) have helped to explain the broad substrate specificity of these enzymes and have also shown that these enzymes have considerable plasticity. Unfortunately, these X-ray crystal studies were limited to tight binding ligands, so the relationship between the X-ray crystal structures and weakly-bound N-dealkylated P450 2B substrates remains less clear.
Therefore, the non-steroidal anti-inflammatory drug (NSAID) amidopyrine (AP) was analyzed by NMR and used as a model compound for the N-dealkylation reactions. This drug was selected because it has been studied extensively in a variety of P450 2B enzymes and because the products and N-dealkylated intermediates can be easily obtained or synthesized (13–16). The products and N-dealkylated intermediates may also be easily obtained or synthesized. Additionally, AP and its metabolites have low affinities for the enzyme (17–19), and are therefore likely to be in fast exchange with the P450 2B active site, which was a requirement for the NMR experiments.
Scheme 1 illustrates the N-demethylation reactions of AP by P450 2B enzymes (13). AP (Scheme 1A) is demethylated oxidatively to DMAP, which is shown in Scheme 1B. Because of weak binding, DMAP can either be released from the enzyme (20), or undergo a second demethylation resulting in aminoantipyrine (AAP, Scheme 1C). After release from the P450 active site, AAP is acetylated by the cytosolic arylamine N-acetyltransferase (NAT2) to form acetylaminoantipyrine (21) and eliminated.
Scheme 1. Metabolism of amidopyrine.

A) Amidopyrine (AP), B) desmethylamidopyrine (DMAP) and C) aminoantipyrine (AAP) are shown. The International Union of Pure and Applied Chemistry (IUPAC) numbering of the pyrazolone and the phenyl ring are shown in B).
The interactions of AP, DMAP and AAP, which will be referred to as AP and its metabolites, were examined with the rabbit P450 2B4 isoform for the following reasons. To begin with, the P450 2B4 enzyme has been the focus of a number of biochemical and biophysical studies (e.g. 22). Of the mammalian P450s, the most ligand-bound X-ray crystal structures have been solved for this enzyme (e.g. 23). Unlike the truncated constructs, which are available for most other mammalian P450s, the truncated variant of P450 2B4 (24) used in this study is monomeric and soluble, making it more amenable to NMR analysis.
The interaction of AP and its metabolites with P450 2B4 was investigated using two NMR techniques: saturation transfer difference (STD) and longitudinal (T1) relaxation. Distances calculated from the T1 relaxation were used to constrain molecules within the active site of P450 2B4. A simulated annealing simulation of the complex was performed to ascertain the time-dependent positions of the metabolites. This combination of results provided, for the first time, the basis of a structural model of P450 2B-catalyzed N-dealkylation reactions.
Materials and Methods
Materials
Unless otherwise specified, all the chemicals were purchased from Sigma-Aldrich (St. Louis, MO). 4-Aminoantipyrine hydrochloride was purchased from Acros Organic (Geel, Belgium). The materials used for the protein purification were the same as described previously (12, 23).
Synthesis of Desmethylamidopyrine (DMAP)
The synthesis of DMAP is shown in Scheme S1 in the Supporting Information. The products of the reactions were analyzed by 1H and 13C NMR using a JEOL 500 MHz (JEOL Ltd., Tokyo, Japan) NMR spectrometer and a 100 MHz Varian NMR spectrometer (Varian, Inc., Palo Alto, CA), respectively. First, the compound 4-aminoantipyrine hydrochloride (1.916 g, 8 mmol, 1) was dissolved in 80 mL of CH3Cl and diisopropyl ethylamine (1.8 mL, 8 mmol) was added dropwise. When the starting material was completely dissolved (3 min), acetic anhydride (1.51 mL, 16 mmol) and NiCl2 (0.056 g, 0.24 mmol) were added. The reaction progress was monitored by thin-layer chromatography (TLC) with a mobile phase comprised of a 9:1 mixture of ethyl acetate and methanol mixture for 10 min. After the reaction was completed, the product was dried under vacuum. The acetylated product 2 was purified by flash-chromatography, using a CombiFlash Companion System (Teledyne Isco, Inc., Lincoln, NE) on silica gel with ethyl acetate and methanol gradient. The yield of the resulting white powder was 1.916 g (98.5%): 1H NMR (500 MHZ, CDCl3) δ (s, 1H), 7.48–7.43 (m, 2H), 7.36 (dd, J = 1.1, 8.4 Hz, 2H), 7.30 (dt, J = 1.1, 8.5 Hz, 1H), 3.08 (s, 3H), 2.21 (s, 3H) and 2.07 (s, 3H) ppm; 13C NMR (100 MHz, CDCl3) δ 170.86, 161.16, 152.19, 134.68, 129.08, 126.61, 123.97, 113.21, 35.35, 21.04, 13.89.
Compound 2 (0.98 g, 4 mmol) and NaH (60% oil by wt., 0.288 g, 4.8 mmol) were placed in a two-neck round bottom flask under nitrogen and dry THF was added. The reaction mixture was cooled to 0°C and methyliodide (0.3 ml, 4.8 mmol) was added. The reaction was brought to ambient temperature overnight. Solvent was removed under vacuum and the methylated product 3 was purified by flash-chromatography using a CombiFlash Companion System on silica gel with a ethyl acetate and methanol gradient. The yield of 3, which was a yellow oil, was 0.89 g (86%): 1H NMR (100 MHz, DMSO-d6) δ 7.53–7.94 (m, 2H), 7.37–7.75 (m, 3H), 3.13 (s, 3H), 2.96 (s, 3H), 2.22 (s, 3H), 1.83 (s, 3H); 13C NMR (400 MHz, DMSO-d6) δ 170.86, 161.16, 152.59, 134.68, 128.08, 126.61, 123.97, 113.21, 135.35, 121.04, 13.99, 10.08.
Compound 3 (0.89 g, 3.4 mmol) was refluxed in 30 mL of water containing 0.57 mL (6.8 mmol) of HCl overnight. The solution was neutralized with NaHCO3 and lyophilized. DMAP (4) was purified by flash-chromatography using CombiFlash Companion System on C-18 column with H2O and methanol gradient. The yield of 4 was 0.63 g (85%) and the purity of the resulting yellow oil was >95% by NMR: 1H NMR (500 MHz, CDCl3) δ 7.49–7.40 (m, 4 H), 7.24 (ddd, J = 1.4, 2.9, 7.5 Hz, 1H), 2.86 (s, 3H), 2.82 (s, 3H), 2.25 (s, 3H).
Protein Expression and Purification
The N-terminal truncated P450 2B4 with an H226Y mutation to prevent dimerization (25) was expressed in Escherichia coli TOPP3 cells as described previously (23). Protein purification was carried out essentially as in (12). The P450 concentration was measured using reduced P450 with CO (CO-reduced) difference spectra and a molar extinction coefficient of 91 mM−1 cm−1 (26). The purity of the enzyme judged from sodium dodecyl sulfate polyacrylamide gel electrophoresis (SDS-PAGE) and A417/A280 ratios was >95%.
Binding Titrations of AP, DMAP and AAP to P450 2B4
The UV-visible spectra of P450 2B4 in the presence of AP and its metabolites were measured with a S2000 single channel charged-coupled device (CCD) rapid scanning spectrometer (Ocean Optics, Inc., Dunedin, FL.) with L7893 deuterium and halogen light source with fiber optic cable (Hamamatsu, Inc., Bridgewater, NJ) (27). All titrations were performed in 500 mM potassium phosphate buffer (KPi), pH 7.4. Because of interference in the absorbance spectra from DMAP, titrations with the metabolite were performed at concentrations of P450 2B4 of 20 μM or greater in 0.5 or 0.1 cm path length cuvettes. The concentration-dependent titration curves were fit with the scientific analysis package Igor 6.1 (Wavemetrics, Inc., Lake Oswego, Oregon) to the equation for the equilibrium of bimolecular association (28):
| (1) |
where A is the absorbance amplitude in units of molar extinction coefficient (μM−1 cm−1), Amax is the maximum absorbance amplitude in units of molar extinction coefficient (μM−1 cm−1), E is the enzyme concentration, L is the ligand concentration, KD is the dissociation constant and an Offset is a constant that compensates for small errors in the absorbance measurement, but was always close to 0. In addition to fitting the titrations, the absolute absorbance spectrum of P450 2B4 with saturating concentrations of the AP and its metabolites were fit by least squares method using software written in the Python programming language (Version 2.6) to a linear combination of low spin (LS), LS with imidazole (LSimidazole), high spin (HS) and ferric P420 (P420) heme spectral standards as described previously (29, 30). The LSimidazole spectral standard represents the model heme spectrum for a nitrogenous ligand coordinated to the heme.
Longitudinal (T1) Relaxation and Saturation Transfer Difference (STD) NMR of AP and its Metabolites Bound to P450 2B4
NMR experiments were performed on a 600 MHz Bruker Avance III (Bruker Daltonics Inc., Billerica, MA, USA) with a three-channel (1H,13C,15N) cryoprobe at 25°C. A relaxation delay of 15 and 30 s was used for the oxidized and reduced anaerobic samples, respectively.
T1 relaxation measurements were employed to orient metabolites of AP in the active site of P450 2B4 as described previously (e.g. 31, 32). It was measured using a 180° inversion recovery pulse followed by WATER suppression by GrAdient Tailored Excitation (WATERGATE) (33) or excitation sculpting (12). Details of the inversion recovery experiment are described in (34). The inversion recovery pulse program and parameters were obtained from Dr. Gerhard Wagner’s pulse sequence library at http://gwagner.med.harvard.edu/intranet/nmr/wwwpslib/GW_pulse_relax.html. For these experiments, P450 2B4 was dialyzed once against 500 mM KPi at pH 7.4 and then twice against deuterated 500 mM KPi, pH 7.4. NMR samples had 1.0 mM of each of the molecules and 40 μM of the dialyzed P450 2B4 in 500 KPi at pH 7.4 with 99% D2O as the lock solvent. Paramagnetic samples with the P450 2B4 heme in the Fe3+ state were prepared by purging the sample under a flow of argon in a sealed 5 mm NMR tube for 2 h. Diamagnetic samples with the P450 2B4 heme in the Fe2+ state were obtained by gently bubbling the sample under CO for ~2 min and then reducing it with dithionite prior to purging with argon for 2 h. For both paramagnetic and diamagnetic samples, a BD anaerobic indicator strip (BD Biosciences, San Jose, CA, USA) was used to ensure an anaerobic environment of the samples. Samples that became aerobic during the experiment, as judged by the anaerobic indicator strip, were excluded from the analysis. Shifts in the NMR peaks of AP and its metabolites in the presence of oxidized and reduced P450 2B4 showed that the binding of these ligands was in fast exchange (see the Results and Figure S2 of the Supporting Information).
STD NMR has previously been used to probe the interactions of ligands to proteins by selective excitation of the protein that is transferred to the ligand (35, 36). In this study, the technique was used to map the interactions of AP and its metabolites to P450 2B4. A saturation transfer pulse sequence was used (35) with a WATERGATE or excitation sculpting (33, 37) pulse sequence following the train of 50 ms saturation pulses. Details of the pulse sequence and parameters can be found in (35). Diamagnetic samples were prepared as described above, except that the samples contained 500 mM KPi, pH 7.4 with 10% D2O. The percent of STD (%STD) transfer was calculated by dividing the amplitude of the STD NMR peaks against the analogous peaks in the WATERGATE NMR spectrum under the same conditions. The %STD was monitored over time and fit to a single exponential function in Igor Pro 6.1.
Processing, Background Subtraction, and Deconvoluting NMR Spectra
NMR data were processed using the NMR processing software package iNMR (http://www.inmr.net). NMR peaks of AP and its metabolites were initially assigned using the 1H proton NMR spectrum of AP in CDCl3 from the Spectral DataBase System for organic compounds (SDBS) and using NMR Predictor (38). The final NMR peak assignments were determined using the NMR peak positions, the integrated intensities of the NMR peaks and the splitting of the NMR peaks. The NMR spectra were then translated into ASCII text format and imported into the scientific analysis package Igor Pro 6.1. The background and baseline were subtracted from the NMR spectra using software written in the Python programming language and integrated into Igor Pro 6.1. The NMR spectra were then fit to a linear combination of gaussian, lorentzian or voigt line shapes (39–42) using the multiple peak fitting package of Igor Pro 6.1 and a least-squares fitting program written in Python using the numpy Python module. These fitted curves were used as standards for the singular value decomposition (SVD) analysis.
Singular Value Decomposition (SVD) Analysis for the T1 Relaxation and STD NMR experiments
SVD analysis with standards was used to measure the amplitudes of the NMR peaks from the T1 relaxation and STD NMR experiments (43–46). The SVD algorithm was written in Python using the numpy Python module and integrated into Igor Pro 6.1. This method gauged the peak amplitude more accurately than measuring the peak amplitude directly or integrating the peak. The SVD-derived amplitudes for the T1 relaxation and STD experiments were fit to a single exponential function in Igor Pro 6.1. The derived fitting parameters provided the %STDMAX for the STD experiments and the relaxation rates for the T1 relaxation experiments.
Calculating the Apparent Distances (rapp) from the T1 Paramagnetic Relaxation Rates (RP)
The T1 paramagnetic relaxation rate (RP) was experimentally determined by measuring the differences between the NMR longitudinal relaxation rate between oxidized P450, where the heme was in the Fe3+ state, and reduced P450, where the heme was in the Fe2+ state. This relationship can be represented mathematically by RP = RFe3+ − RCO-Fe2+, where RP is the paramagnetic relaxation rate, RFe3+ is the relaxation rate of the oxidized P450 and RCO-Fe2+ is the relaxation rate of CO-reduced P450. The model-dependent relaxation rate (RM) is dependent on the fraction of ligand bound to the protein and can be expressed mathematically as RP=αRM, where α is the fraction of ligand bound with respect to total ligand concentration ([L]) and RM is the model-dependent relaxation rate. For a single ligand binding model, α is equal to ([E]/(KD+[L]), assuming a single ligand binding model. The paramagnetic relaxation rate is related to distance by the Solomon-Bloembergen equation (SI Units) (34, 47–50):
| (2) |
where μ0 is the magnetic permeability of free space, γN is the nuclear gyromagnetic ratio, ge is the electronic g-factor, μB is the Bohr magneton, rapp is the apparent time-averaged electron-nuclear distance, τC is the correlation time for the nuclear-electron interaction vector, which is dominated by the electron spin relaxation rates, S is the electronic spin quantum number, and ωN and ωE are the radial frequencies of the nucleus and electron, respectively. The S(S+1) term accounts for the fractional spin state of the P450. For mixed spin state systems (51), S(S+1) is equal to 8.75fHS+0.75fLS, where fHS and fLS are the fraction of high spin (HS) and low spin (LS) (52, 53).
Eq 2 neglects chemical equivalence of the protons with the implicit assumption that all protons associated with an NMR peak are exactly the same distance from the heme. Chemical equivalence has been treated previously for parallel and perpendicular orientations of P450-bound aromatic functional groups (51, 54), but never generalized for P450s. The relationship between the rapp and the distances of the individual protons are shown below with n and rn representing the number and the distances of those chemically-equivalent protons, respectively.
| (3) |
The rmin is the minimum distance of a proton from group of chemically-equivalent protons. In eq 3, the rmin−6 is approximately equal to the sum of rn−6, since longer distances have a negligible contribution to the sum. The relationship between RP and RM is simply:
| (4) |
The Effect of Ligand Dynamics on RP, rapp and ravg
Because of ligand dynamics and the fast exchange requirement for these measurements, the distances calculated from this analysis are not likely to represent absolute distances, but time-averaged distances weighted toward the shortest distance. In this study, the time averaging of distances of mobile nuclei and paramagnetic species was accomplished using the ensemble approach (46, 55, 56). The time-dependent ensemble averaging equations of the RP, RM and rapp are shown in eq 5, where Δtn is the fraction of time, t is the total time and ft is the fraction of time at an individual distance. The left part of eq 5 shows that RP is linearly related to the individual relaxation rates, whereas the rapp has r6 dependence in the right part. This will skew rapp toward the shortest distance, whereas the RP and RM will remain linear. For a molecule that fluctuates, the average distance (ravg, eq 6) is quite different than rapp, which is shown below. Like RP and RM, the ravg is linear with respect to the individual distances (rn) in contrast to rapp. To demonstrate the effect of time averaging on rapp, a simulation of rapp, ravg and RP is presented in the Supporting Information.
| (5) |
| (6) |
Molecular Docking using Distance-Restrained Simulated Annealing of AP and its Metabolites to P450 2B4
Distance-restrained simulated annealing, which is a type of molecular dynamics (MD) simulation, is a tool commonly employed in the refinement of NMR structures and complexes (57, 58). The technique was used here to determine the preferred orientations of the molecules in the active site of the X-ray crystal structure P450 2B4 (PDB ID: 1SUO, (59)) using the distances calculated from the RPs as described for other systems (60–62). Residues that were missing from the X-ray crystal structure were added using the homology modeling program Modeller (63) and the amino acid sequence of the truncated construct of P450 2B4 (59). AP and its metabolites were each then manually docked into the X-ray crystal structure of P450 2B4 without ligands using the PyMOL Molecular Graphics System, Version 1.2r2 (Schrödinger, LLC.). Distance-restrained simulated annealing and energy minimization of P450 2B4 and the substrates was performed with the software package Groningen MAchine for Chemical Simulation (GROMACS) Version 4.07 (64). The complexes of the AP and its metabolites and P450 2B4 were simulated with the GROMOS 96 53a6 force field (65). A derivation of the force field parameters and charges of the heme with a spherical iron in the GROMOS 53a6 forced field are described in (66). The particle-mesh Ewald (67) method was used for electrostatics with position restraints placed on the α-carbon backbone during the simulated annealing. The molecules were restrained to P450 2B4 using the NMR calculated distances from Table 1. A time constant of 50 ps was applied to the distance restraint to allow the molecule to move in the active site during the simulation, since the calculated distances reflect multiple orientations of the substrates in the P450 2B4 active site. Prior to the simulation, the molecule was energy minimized using the steepest descent method to eliminate Van der Waals contact. The system was then heated to 800 K and cooled to 300 K in 150 ps and allowed to equilibrate for 100 ps at 300 K. Snapshots of the molecules bound to P450 2B4 were taken during the last 50 ps of the MD simulation and used to show the binding modes of the molecules.
Table 1.
Paramagnetic relaxation rates and the calculated distances.
| 1.0 mM Amidopyrine and 40 μM P450 2B4
| ||||||
|---|---|---|---|---|---|---|
| Peak | RFe3+ (sec−1) | RFe2+-CO (sec−1) | RP (sec−1) | RM (sec−1)a,b | rappb (Å) | rminb,c (Å) |
| 2′/6′ | 0.633 ±0.004 | 0.379±0.004 | 0.254±0.006 | 38.11±1.55 | 10.88±0.07 | 9.69±0.07 |
| 3′/5′ | 0.901±0.008 | 0.415±0.007 | 0.486±0.011 | 72.89±2.91 | 9.76±0.06 | 8.70±0.06 |
| 4′ | 0.826±0.014 | 0.392±0.011 | 0.434±0.017 | 32.57±1.70 | 9.95±0.09 | 9.95±0.09 |
| 1-CH3 | 0.758±0.011 | 0.654±0.013 | 0.104±0.017 | 23.40±3.95 | 12.62±0.36 | 10.51±0.30 |
| 4-CH3 | 1.205±0.015 | 0.971±0.009 | 0.234±0.017 | 105.28±8.54 | 11.02±0.15 | 8.18±0.11 |
| 5-CH3 | 0.893±0.016 | 0.758±0.017 | 0.135±0.023 | 30.43±5.37 | 12.08±0.36 | 10.06±0.30 |
|
| ||||||
| 1.0 mM Desmethylamidopyrine and 40 μM P450 2B4
| ||||||
| 2′/6′ | 0.507±0.003 | 0.360±0.003 | 0.147±0.005 | 30.81±4.51 | 11.96±0.29 | 10.65±0.26 |
| 3′/5′ | 0.675±0.004 | 0.390±0.002 | 0.285±0.005 | 59.83±8.60 | 10.71±0.26 | 9.54±0.23 |
| 4′ | 0.606±0.008 | 0.351±0.004 | 0.255±0.009 | 26.78±3.95 | 10.91±0.27 | 10.91±0.27 |
| 1-CH3 | 0.699±0.007 | 0.623±0.010 | 0.075±0.012 | 23.74±5.12 | 13.36±0.48 | 11.13±0.40 |
| 4-CH3 | 0.832±0.004 | 0.581±0.005 | 0.251±0.007 | 79.14±11.49 | 10.93±0.26 | 9.10±0.22 |
| 5-CH3 | 0.904±0.011 | 0.710±0.015 | 0.194±0.019 | 61.09±10.51 | 11.42±0.33 | 9.51±0.27 |
|
| ||||||
| 1.0 mM Aminoantipyrine and 40 μM P450 2B4
| ||||||
| 2′/6′ | 0.687±0.004 | 0.400±0.004 | 0.286±0.006 | 87.43±7.39 | 9.31±0.13 | 8.29±0.12 |
| 3′/5′ | 0.899±0.006 | 0.417±0.004 | 0.483±0.007 | 147.19±12.28 | 8.53±0.12 | 7.60±0.11 |
| 4′ | 0.737±0.009 | 0.406±0.006 | 0.331±0.011 | 50.51±4.48 | 9.09±0.13 | 9.09±0.13 |
| 1-CH3 | 0.701±0.003 | 0.572±0.015 | 0.130±0.015 | 59.25±8.53 | 10.63±0.25 | 8.85±0.22 |
| 5-CH3 | 0.943±0.005 | 0.652±0.012 | 0.290±0.013 | 132.76±12.50 | 9.29±0.15 | 7.74±0.12 |
RM was calculated using eq 4.
The KDs were obtained from the UV-visible absorbance in Figure 2 and the spin-state was determined by least squares fitting in Figure 1. The average and the standard deviation were from three independent experiments.
The minimum distance calculated based on the chemical equivalence. Abbreviations: RFe3+, paramagnetic relaxation rate (sec−1) of oxidized 2B4; RFe2+-CO, paramagnetic relaxation rate (sec−1) of reduced 2B4 with CO; RP, paramagnetic relaxation rate (i.e. RP=RFe3+-RFe2+-CO). The distances were calculated with a τC of 3 × 10⁻¹⁰ sec, which is the average value of P450s under variety of conditions (31, 49).
Results and Discussion
UV-visible Spectroscopy of P450 2B4 in the Presence of AP and its Metabolites
The P450 heme absorbance spectrum is sensitive to ligand binding and solution conditions and is composed of overlapping spectra of the HS (+5/2) and LS (+1/2) states of the heme. The fraction of LS and HS was estimated using heme absorbance standards as described in the Materials and Methods (29, 30). The binding affinity was determined directly by monitoring ligand-induced heme absorbance changes with absorbance difference spectra (26, 68) or indirectly by analyzing competition with benzphetamine (BP) (69).
Figure 1 shows the absolute absorbance spectra of P450 2B4 with fits to absorbance standards in the presence of saturating AP, DMAP, AAP or BP. In all cases, the correlation coefficient was >0.997, indicating very accurate fits. The concentration of P420 by fitting was < 20% in all the samples. In the absence of ligands, the %LS and %HS determined from the absolute absorbance spectrum in Figure 1A were 77% and 23%, respectively. In the presence of saturating BP (Figure 1B), HS increased by 20% to 43%. The increases in HS generally indicate displacement of the heme-bound water (70). In contrast, AP induces very little change in the spin state of the P450 2B4 heme. The %LS increased less than 2% to 79%. It is unclear from the analysis whether the small increase in %LS is due to stabilization of a heme-bound water, weak interaction with AP or merely an artifact of fitting. The effects of saturating DMAP on the P450 2B4 heme absorbance were more dramatic. The fit of the absolute absorbance spectrum revealed an increase of 11% in the HS state to 34%, indicating displacement of heme-bound water. The best fits of the absolute absorbance spectrum of P450 2B4 in the presence of the product AAP were obtained with LS, LSimidazole and HS standards. Because of similarities between the LSimidazole and P420 spectral standards, [P420] could not be accurately measured in this case. Therefore, the %LS should be considered approximate. The %LS and %LSimidazole was approximately 41% each, indicating an incomplete shift to 82% LS by weak interaction of the ligand (71) or stabilization of the heme-bound water complex (72).
Figure 1. Least-Squares Fitting of the Absolute Absorbance Spectra of P450 2B4 with AP, DMAP, AAP and BP.

The spectra (gray lines), fits (thick black lines) and standards (dotted lines) are shown with A) no ligands, B) 256 μM BP, C) 15 mM AP, D) 24 mM DMAP and E) 15 mM AAP. The P450 2B4 concentration was 74 μM for the spectra with DMAP and 5 μM for the rest of the samples. The high spin (HS), low spin (LS), ferric P420 (P420) and LS with imidazole (LSimidazole) UV-visible heme absorbance standards are labeled.
Figure 2 shows the UV-visible analysis of P450 2B4 in the presence of the AP, DMAP, AAP or the probe substrate BP. BP caused an increase at 386 nm and decrease at 421 nm in the difference spectra (Figure 2A) that was characteristic of a type-I absorbance difference spectra (68). The resulting binding curve was fit to eq 1 with a KD of 34 μM ± 10 μM and a ΔAmax of 0.014 ± 0.003 μM−1cm−1, which is in line with previously estimated KDs for BP of 40–121 μM (4, 22, 73).
Figure 2. Analysis of UV-visible Absorbance Changes of P450 2B4 in the Presence of A) BP, B) AP, C) DMAP and D) AAP.

Difference spectra and binding curves of the P450 2B4 heme with BP, DMAP and AAP are shown in the left and right panels, respectively. Panel B shows the effect of AP on the KD of BP (squares) with an extrapolated line used to estimate the KD. The concentration of P450 2B4 was 5 μM in the presence of AP and AAP. Because of interference from the DMAP absorbance, the UV-visible spectra were measured at 20 μM P450 2B4 and 74 μM P450 at <24 mM and 24 mM DMAP, respectively. The binding curves in the right panels were made by monitoring the maximum heme absorbance change as a function of ligand concentration.
In contrast, the absorbance changes of P450 2B4 in the presence of AP were quite minute (Figure 1C), so the binding of AP was analyzed indirectly using BP as a probe substrate. Figure 2B shows the affect of AP on the KD of BP. Increasing the [AP] causes a linear increase in KD of BP to 1.7 mM ± 0.2 mM at 64 mM AP. By linearly extrapolating through the points, a KD of 2.0 ± 0.1 mM was estimated, which correlates well with KM values obtained from AP kinetics of ~2 mM (17, 18).
The absorbance difference spectra of P450 2B4 in the presence of DMAP are shown in the left panel of Figure 2C. DMAP induced a type I absorbance change with increases and decreases at 383 nm and 419 nm, respectively (68). Fitting the binding curve to eq 1 gives a KD and ΔAmax of 3.2 ± 0.6 mM and 0.015 ± 0.008 μM−1cm−1, respectively and is very similar to values determined previously (19).
The difference spectra of P450 2B4 in the presence of AAP showed a decrease at 411 nm and an increase at 434 nm that was characteristic of type II absorbance difference spectra (68). A KD of 2.6 ± 0.4 mM and ΔAmax of 0.0080 ± 0.0002 μM−1cm−1 were estimated from fitting the binding curve.
NMR Assignment of AP and Its Metabolites
Figure 3 shows the 1D 1H NMR spectrum of DMAP showing seven well-defined NMR peaks. Three NMR peaks, two triplets and one doublet, in the aromatic region of the spectrum between 7 and 8 ppm were assigned to the phenyl ring of DMAP. One triplet was centered at 7.60 ppm (J = 7.4 Hz), while the other triplet was centered at 7.55 ppm (J = 7.3 Hz) with half the peak area of the first triplet. From the splitting and the relative area of the NMR peak centered at 7.6 ppm, it was assigned to the protons at positions 3′ and 5′ on the phenyl ring. This triplet is most likely a doublet of doublets, since in equivalent nuclei flank the protons at these positions. By process of elimination, the peak at 7.55 ppm was assigned to the proton at position 4′. The remaining protons at 2′ and 6′ of the phenyl ring were then assigned to the doublet centered at 7.39 ppm (J =7.4 Hz). In contrast, the methyl groups of the pyrazolone ring formed singlets in the NMR spectrum. The peak areas of these singlets were virtually identical. No additional peaks reflecting contamination from the amidopyrine metabolites were observed. From the NMR spectrum of AP in the SBDS database, the methyl groups at positions 1 and 5 were assigned to 3.14 and 2.30 ppm, respectively. The remaining methyl at position 4, which is metabolized by P450 2B4, was assigned to the NMR peak centered at 2.64 ppm and is upfield of the analogous peak in the AP NMR spectrum that was centered at 2.68 ppm in this study (data not shown) and at 2.784 ppm in the SDBS database. The amide proton of the desmethylamido group was absent from the NMR spectrum because of exchange broadening. NMR spectra of AP and AAP were virtually identical with small deviations in the peak positions, so they were given the same relative assignments (data not shown).
Figure 3. 1D 1H NMR Spectrum of 1.0 mM DMAP in 99% D2O.

The peaks are labeled according to Scheme 1B.
Saturation Transfer Difference (STD) NMR to Probe the Interaction of AP and its metabolites and Diamagnetic P450 2B4
Saturation transfer difference (STD) NMR has been used to probe ligand-protein interaction for drug screening, epitope mapping and fragment-based drug design for ligands with KDs in the 10s of nM to mM range (35, 74, 75). The efficiency and the degree of saturation transfer depends on the orientation and position of the ligand with respect to the protein. In this study, STD NMR was used to probe the interaction of the molecules with CO-reduced P450 2B4 and was complementary to the T1 relaxation measurements.
Figure 4 shows the analysis of the AP, DMAP and AAP by STD NMR. The STD NMR spectrum of DMAP with 2 seconds saturation is shown in Figure 4A. The STD NMR spectrum looked distinctly different from the 1H proton NMR spectrum shown in Figure 3. These differences indicated specific interactions between DMAP and P450 2B4. Most noticeably, the methyl NMR peaks numbered 1, 4 and 5 were no longer of equal amplitude. The N-linked methyl at position 1 had the strongest STD signal over the other two peaks. To determine the maximum amount of saturation, %STD was monitored as a function of time. Figure 4B shows %STD for the NMR peak of the N-linked methyl at position 4. Because the maximum %STD (%STDMAX) was not achieved with 2 s of saturation and longer saturation could potentially damage the cryoprobe, the %STDMAX was estimated by fitting to a single exponential function. The function fits to the curve with a saturation transfer rate of ~0.5 sec−1 and a STDMAX of 6.3%±0.3%.
Figure 4. Saturation Transfer Difference (STD) of AP, DMAP and AAP with P450 2B4.
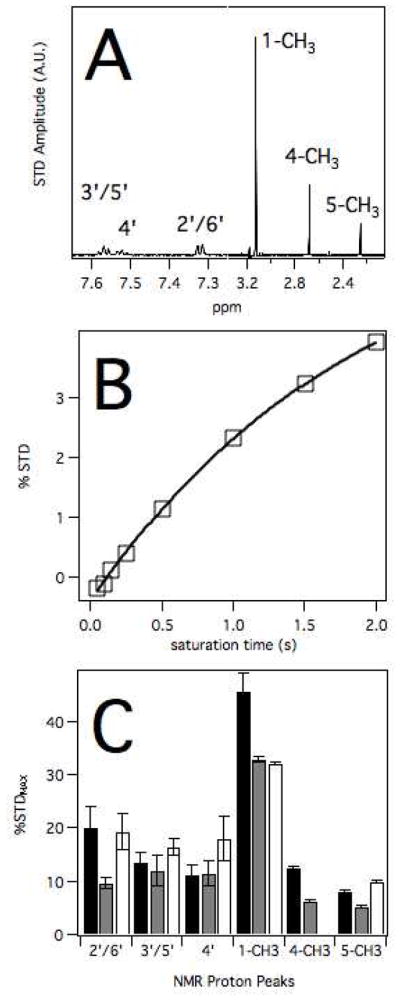
A) STD NMR spectrum of 2B4 with AP. B) %STD transfer of peak e as a function of saturation time. C) %STDMAX versus proton peaks for AP (black), DMAP (gray) and AAP (white).
Figure 4C shows the %STDMAX for the NMR peaks of AP, DMAP and AAP. The relative amplitudes of %STDMAX were similar for all the ligands, suggesting that they occupy similar niches within the P450 2B4 active site. The %STDMAX was highest for the N-linked methyl at position 1 on the pyrazolone ring for all the molecules with values between 30 and 40%. In contrast, the other methyls had the weakest interaction with %STDMAX under 12.6%. The saturation transfer between the phenyl ring protons and P450 2B4 was intermediate with %STDMAX between 12–20%.
T1 Relaxation NMR was used to Estimate the Orientation of AP and its Metabolites in the P450 2B4 Active Site
A waterfall representation of individual 1D proton NMR spectra that comprise the T1 relaxation NMR experiment (Figure 5) shows that at short inversion recovery times the peaks are positive, but decrease as the inversion recovery time is increased. At long inversion recovery times, the absolute amplitude is similar to that at short inversion recovery times, but in the opposite direction. In Figure 5B, the 1D proton NMR spectrum and at an inversion recovery time of 10 s were fit by the least squares method to NMR peak standards (e.g. 76). In all cases, the residuals from the data and the fit were minute with the correlation coefficients were 0.98 or greater. Using the simulated peaks and the NMR spectra, the inversion recovery time was analyzed using the SVD method and fit to a single exponential function in Figure 5C with a χ2 of 6.4 × 10⁻⁴.
Figure 5. NMR relaxation of 1 mM DMAP in the presence of 40 μM reduced P450 2B4.

A) Waterfall graph of the 1D proton NMR spectra at various inversion recovery times with the background and baseline subtracted. B) 1D proton NMR spectra at inversion recovery time of 10 s (10 s) with least squares fit (fit) and residual (res). C) SVD analysis of the N-linked methyl peak at position 4 as a function of inversion recovery time.
Table 1 shows the relaxation rates and calculated distances that were determined from the SVD analysis. The first three columns show the RFe3+, RFe2+-CO and the difference, which is the RP. Because of chemical equivalence, RM values in column 4 were calculated from the RP using eq 4. The rates varied as much as 5 fold between protons. Using the Solomon-Bloembergen equation (eq 2) and treatment described in Materials and Methods, rapp and rmin were calculated and shown in the last two columns. Taken together, the distances can vary as much as 4 Å depending on the orientation of the ligands in the active site. Because of the r6 distance dependence, chemical equivalence and time averaging, the rapp from the relaxation will be less dispersed and less sensitive to orientation than RM.
Because of higher sensitivity of RM with respect to orientation and position of AP and its metabolites, the RM of these molecules was analyzed in Figure 6 with respect to the 4′ proton of the phenyl ring. Positive and negative values indicate that the proton is closer and farther from the heme than the 4′ proton, respectively. Large differences in %ΔRM for some of the protons on the phenyl and pyrazolone rings suggest that at least one axis of each of these groups was perpendicular to the heme. Consistent with metabolism of the N-linked methyls of AP and DMAP, this functional group was closest to the heme with relaxation rates that were 50–200% greater than RM of protons on the phenyl ring. For these molecules, the %ΔRM of the 2′/6′ protons and methyl at position 1 were also similar, indicating that they were relatively parallel to the 4′ proton. In contrast, the %ΔRM of the 3′/5′ proton and the methyl at position 5 of DMAP was parallel like AAP, while the methyl at position 5 was farther away from the heme for AP. Unfortunately, because of chemical equivalence and time averaging, this analysis provided no information on how these molecules are specifically sequestered in the P450 2B4 active site or its relationship to the STD NMR.
Figure 6.

Relative % differences in the RM (ΔRM%) of AP (black), DMAP (gray) and AAP (white). The ΔRM% was calculated with respect to the 4′ proton of the phenyl ring.
Models of AP and its metabolites bound to P450 2B4
To determine the orientation of AP and its metabolites within the active site, the molecules were restrained in the active site of P450 2B4 using the distances calculated from the RPs. Simulated annealing of the complex was used to identify binding site(s) of these molecules.
The MD snapshots of the last 50 ps at 300K are shown in Figure 7 for AP, DMAP and AAP. In all cases, they occupy similar niches within the P450 2B4 active site, which correlates well with the similarities of the ligands’ STD NMR spectra. The phenyl group fits into a crevasse formed by seven hydrophobic residues: V104, F108, I114, F115, L238, F297 and V367. The phenyl group of chlorophenyl imidazole inhibitors in the X-ray crystal structures of P450 2B4 and 2B6 interact with similar residues, but lies perpendicular to the orientation of the phenyl group in the AP and its metabolites (12, 59, 77). Mutating V367 causes significant changes in the binding affinity and metabolic profiles of testosterone and BP (22, 78). The methyl at position-1 on the pyrazolone ring binds in a hydrophobic pocket formed by I101, V104, I209 and V477. This is the same pocket occupied by chlorines of the chlorophenyl imidazole inhibitor bound X-ray crystal structures (12, 59, 77). The methyl at position 5 interacts with a wider hydrophobic pocket formed by residues F206, I209, V477 and G478. The V477F mutant has strong effects on the regioselectivity of the enzyme toward testosterone (78). The oxygen at position 3 of the pyrazolone does not directly interact with any residues, but forms a hydrogen bond with water in the active site for all three ligands.
Figure 7. Distance-restrained model of A) AP, B) DMAP and C) AAP to P450 2B4.

The left column shows the MD snapshots of these molecules. To differentiate the protein residues from the ligand, the carbons are colored green and orange, respectively. The heme is colored red. For clarity, only one of the MD snapshots of P450 2B4 is shown and residues I101, V477 and G478 are hidden from view. On the right column are cartoon representations of the figures that are shown on the left. The heme is labeled and shown as a circle and a line. Hydrogen bonds are represented by dotted lines.
The most significant differences in the interactions of these molecules with P450 2B4 were at the site of metabolism. In the AP-bound model (Figure 7A), the dimethylamido group at position 4 on the pyrazolone ring rotates in the MD simulation. During the rotation, one of the methyls interacts with three residues (i.e. A298, I363 and the methyl of T302) that are near the heme. The I363 residue is the least conserved of these residues. The I363A mutation, which is found in rat P450 2B2 (79), increased metabolism of the enzyme toward testosterone and altered its stereo- and regio-selectivity toward the ligand (78). On the other hand, mutating T302 to an alanine inhibited dealkylation of BP and 7-ethoxy-4-trifluoromethyl coumarin (22, 78). The other methyl interacts with F206 and the hydrophobic section of the side chain of E301 with the carboxylic acid functional group facing away from molecule. These methyls form a diagonal with respect to the heme plane, where the amidomethyl bond is positioned within ~7Å.
The methyl of the desmethylamido group of DMAP also rotates freely in the MD simulation (Figure 7B). Like AP, the methyl interacted with A298, T302 and I363. In this orientation, the amide of DMAP formed hydrogen bonds with the carbonyl backbone of F297 and the hydroxyl of T302. The 4-CPI molecule in the P450 2B6 X-ray crystal structure has similar interactions with residues within the P450 active site (12). The imidazole functional group of 4-CPI in the X-ray crystal structure of P450 2B6 is hydrogen bonded to the carbonyl backbone of A297 and the hydroxyl of T302 (12).
The amide functional group of AAP remains relatively fixed during the MD simulation (Figure 7C). The group forms a hydrogen bond with the oxygen on the pyrazolone functional group. AAP either interacted weakly with the heme or form hydrogen bonds with a heme-bound water, which was consistent with the ligand-induced shift of the P450 2B4 heme to LS (see Figures 1E and 2C).
The Mechanism of AP Metabolism
Based on the distance-restrained models presented in Figure 7, a mechanism for AP metabolism is proposed in Scheme 2. AP and its metabolites occupy very similar hydrophobic niches within the P450 2B4 active site. The N-linked methyls of dimethylamido group rotates freely in AP in Scheme 2A between non-catalytic and catalytic positions. The methyl in the noncatalytic position interacts with F206 and E301, while the other methyl binds to hydrophobic pocket formed by A298, I363 and T302 into a catalytic position, where it is demethylated to DMAP. Because DMAP binds weakly, the molecule can migrate out of the active site. If the molecule remains bound or rebinds, DMAP can assume a catalytically inactive orientation with the N-linked methyl of DMAP in Scheme 2B interacting with F206 and E301. Rather than unbinding and rebinding into a catalytically active orientation, which is energetically unfavored and inefficient, the methyl rotates, until it binds to the hydrophobic pocket near to the heme in Scheme 2C. To stabilize the molecule, the amide of DMAP forms hydrogen bonds with backbone of F297 and a hydroxyl of T302 and the molecule is demethylated again to form AAP in Scheme 2D. The amide of AAP is stabilized by a hydrogen bond to the oxygen of the pyrazolone ring. Both the hydrogen and the oxygen interact weakly with either the heme or an intervening heme-bound water. AP or the intermediate DMAP exchanges with AAP and the process is repeated. This model may also explain the sequential metabolism of tighter binding ligands such as lidocaine (6) by allowing the rotation and metabolism of the N-linked alkyl groups without unbinding.
Scheme 2.

Cartoon model of AP metabolism. The diagram shows A) AP, B) DMAP in a catalytically-inactive position, C) DMAP in a catalytically-active position and the product AAP. The thick lines denote hydrophobic crevasses and pockets of P450 2B4, while dashed lines are hydrogen bonds between residues of P450 2B4 and DMAP. The catalytic and non-catalytic positions of the methyl are labeled in A). The heme is labeled and is shown as a circle and a line.
Supplementary Material
Acknowledgments
We thank Jill L. Hartmann for editing the manuscript.
ABBREVIATIONS
- AAP
aminoantipyrine
- AP
amidopyrine
- BP
benzphetamine
- P450
cytochrome P450
- P450 2B4
cytochrome P450 2B4
- P450 2B6
cytochrome P450 2B6
- CCD
charged-coupled device
- DMAP
desmethylamidopyrine
- HIV
human immunodeficiency virus
- HS
high spin
- IUPAC
International Union of Pure and Applied Chemistry
- KPi
potassium phosphate
- LS
low spin
- NAT2
arylamine N-acetyltransferase
- NMR
nuclear magnetic resonance
- NSAID
non-steroidal anti-inflammatory drug
- P420
ferric P420
- RM
model-dependent relaxation rate
- RP
paramagnetic relaxation rate
- SDBS
Spectral DataBase System for organic compounds
- STD
saturation transfer difference
- T1 relaxation
longitudinal T1 relaxation
- TLC
thin-layer chromatography
- WATERGATE
WATER suppression by GrAdient Tailored Excitation
Footnotes
This study was supported by National Institute of Health (NIH) grant ES003619.
SUPPORTING INFORMATION STATEMENT: Figure S1 shows the results of a simulation of ravg, rapp and RP of a dynamic phenyl molecule near to a heme. Figure S2 was used to determine fast exchange conditions and shows the difference in NMR peak positions of DMAP in the presence of oxidized and reduced P450 2B4. Details of the simulation and analysis of Figure S2 are in the results of the Supporting Information. Table S1 of the Supporting Information are additional force field parameters that were used for the MD simulations and the energy minimization to ligate the C436 to the heme. Scheme S1 shows the organic synthesis scheme of DMAP. This material is available free of charge via the Internet at http://pubs.acs.org.
References
- 1.Zhao Y, Halpert JR. Structure-function analysis of cytochromes P450 2B. Biochim Biophys Acta. 2007;1770:402–412. doi: 10.1016/j.bbagen.2006.07.006. [DOI] [PubMed] [Google Scholar]
- 2.Guengerich FP, Yun CH, Macdonald TL. Evidence for a 1-electron oxidation mechanism in N-dealkylation of N,N-dialkylanilines by cytochrome P450 2B1. Kinetic hydrogen isotope effects, linear free energy relationships, comparisons with horseradish peroxidase, and studies with oxygen surrogates. J Biol Chem. 1996;271:27321–27329. doi: 10.1074/jbc.271.44.27321. [DOI] [PubMed] [Google Scholar]
- 3.Bhakta M, Hollenberg PF, Wimalasena K. Evidence for a hydrogen abstraction mechanism in P450-catalyzed N-dealkylations. Chem Commun (Camb) 2005:265–267. doi: 10.1039/b412221f. [DOI] [PubMed] [Google Scholar]
- 4.Schwarze W, Blanck J, Ristau O, Janig GR, Pommerening K, Rein H, Ruckpaul K. Spin state control of cytochrome P-450 reduction and catalytic activity in a reconstituted P-450 LM2 system as induced by a series of benzphetamine analogues. Chem Biol Interact. 1985;54:127–141. doi: 10.1016/s0009-2797(85)80158-7. [DOI] [PubMed] [Google Scholar]
- 5.Kobayashi K, Ishizuka T, Shimada N, Yoshimura Y, Kamijima K, Chiba K. Sertraline N-demethylation is catalyzed by multiple isoforms of human cytochrome P-450 in vitro. Drug Metab Dispos. 1999;27:763–766. [PubMed] [Google Scholar]
- 6.Hanna IH, Roberts ES, Hollenberg PF. Molecular basis for the differences in lidocaine binding and regioselectivity of oxidation by cytochromes P450 2B1 and 2B2. Biochemistry. 1998;37:311–318. doi: 10.1021/bi971528s. [DOI] [PubMed] [Google Scholar]
- 7.Houston JB, Kenworthy KE. In vitro-in vivo scaling of CYP kinetic data not consistent with the classical Michaelis-Menten model. Drug Metab Dispos. 2000;28:246–254. [PubMed] [Google Scholar]
- 8.Ito K, Iwatsubo T, Kanamitsu S, Nakajima Y, Sugiyama Y. Quantitative prediction of in vivo drug clearance and drug interactions from in vitro data on metabolism, together with binding and transport. Annu Rev Pharmacol Toxicol. 1998;38:461–499. doi: 10.1146/annurev.pharmtox.38.1.461. [DOI] [PubMed] [Google Scholar]
- 9.Crewe HK, Notley LM, Wunsch RM, Lennard MS, Gillam EM. Metabolism of tamoxifen by recombinant human cytochrome P450 enzymes: formation of the 4-hydroxy, 4′-hydroxy and N-desmethyl metabolites and isomerization of trans-4-hydroxytamoxifen. Drug Metab Dispos. 2002;30:869–874. doi: 10.1124/dmd.30.8.869. [DOI] [PubMed] [Google Scholar]
- 10.Macdonald TL, Gutheim WG, Martin RB, Guengerich FP. Oxidation of substituted N,N-dimethylanilines by cytochrome P-450: estimation of the effective oxidation-reduction potential of cytochrome P-450. Biochemistry. 1989;28:2071–2077. doi: 10.1021/bi00431a016. [DOI] [PubMed] [Google Scholar]
- 11.Bhakta MN, Wimalasena K. Microsomal P450-catalyzed N-dealkylation of N,N-dialkylanilines: evidence for a Cα-H abstraction mechanism. J Am Chem Soc. 2002;124:1844–1845. doi: 10.1021/ja011041d. [DOI] [PubMed] [Google Scholar]
- 12.Gay SC, Shah MB, Talakad JC, Maekawa K, Roberts AG, Wilderman PR, Sun L, Yang JY, Huelga SC, Hong WX, Zhang Q, Stout CD, Halpert JR. Crystal structure of a cytochrome P450 2B6 genetic variant in complex with the inhibitor 4-(4-chlorophenyl)imidazole at 2.0-Å resolution. Mol Pharmacol. 2010;77:529–538. doi: 10.1124/mol.109.062570. [DOI] [PMC free article] [PubMed] [Google Scholar]
- 13.Agundez JA, Martinez C, Benitez J. Metabolism of aminopyrine and derivatives in man: in vivo study of monomorphic and polymorphic metabolic pathways. Xenobiotica. 1995;25:417–427. doi: 10.3109/00498259509061862. [DOI] [PubMed] [Google Scholar]
- 14.Geisslinger G, Bocker R, Levy M. High-performance liquid chromatographic analysis of dipyrone metabolites to study their formation in human liver microsomes. Pharm Res. 1996;13:1272–1275. doi: 10.1023/a:1016088925786. [DOI] [PubMed] [Google Scholar]
- 15.Vlahov V, Badian M, Verho M, Bacracheva N. Pharmacokinetics of metamizol metabolites in healthy subjects after a single oral dose of metamizol sodium. Eur J Clin Pharmacol. 1990;38:61–65. doi: 10.1007/BF00314805. [DOI] [PubMed] [Google Scholar]
- 16.Levy M, Zylber-Katz E, Rosenkranz B. Clinical pharmacokinetics of dipyrone and its metabolites. Clin Pharmacokinet. 1995;28:216–234. doi: 10.2165/00003088-199528030-00004. [DOI] [PubMed] [Google Scholar]
- 17.Kanaeva IP, Nikityuk OV, Davydov DR, Dedinskii IR, Koen YM, Kuznetsova GP, Skotselyas ED, Bachmanova GI, Archakov AI. Comparative study of monomeric reconstituted and membrane microsomal monooxygenase systems of the rabbit liver. II. Kinetic parameters of reductase and monooxygenase reactions. Arch Biochem Biophys. 1992;298:403–412. doi: 10.1016/0003-9861(92)90428-y. [DOI] [PubMed] [Google Scholar]
- 18.Gram TE, Wilson JT, Fouts JR. Some characteristics of hepatic microsomal systems which metabolize aminopyrine in the rat and rabbit. J Pharmacol Exp Ther. 1968;159:172–181. [PubMed] [Google Scholar]
- 19.Bast A, Noordhoek J. Inhibition of aminopyrine demethylation and binding to cytochrome P-450 by its main metabolites in rat liver microsomes. Br J Pharmacol. 1980;68:121P–122P. [PMC free article] [PubMed] [Google Scholar]
- 20.Noda A, Tsubone N, Mihara M, Goromaru T, Iguchi S. Formation of 4-formylaminoantipyrine as a new metabolite of aminopyrine. II. Enzymatic demethylation and oxidation of aminopyrine and 4-monomethylaminoantipyrine. Chem Pharm Bull (Tokyo) 1976;24:3229–3231. doi: 10.1248/cpb.24.3229. [DOI] [PubMed] [Google Scholar]
- 21.Agundez JA, Carrillo JA, Martinez C, Benitez J. Aminopyrine metabolism in man: the acetylation of aminoantipyrine cosegregates with acetylation of caffeine. Ther Drug Monit. 1995;17:1–5. [PubMed] [Google Scholar]
- 22.Muralidhara BK, Sun L, Negi S, Halpert JR. Thermodynamic fidelity of the mammalian cytochrome P450 2B4 active site in binding substrates and inhibitors. J Mol Biol. 2008;377:232–245. doi: 10.1016/j.jmb.2007.12.068. [DOI] [PubMed] [Google Scholar]
- 23.Gay SC, Sun L, Maekawa K, Halpert JR, Stout CD. Crystal structures of cytochrome P450 2B4 in complex with the inhibitor 1-biphenyl-4-methyl-1H-imidazole: ligand-induced structural response through α-helical repositioning. Biochemistry. 2009;48:4762–4771. doi: 10.1021/bi9003765. [DOI] [PMC free article] [PubMed] [Google Scholar]
- 24.Scott EE, Spatzenegger M, Halpert JR. A truncation of 2B subfamily cytochromes P450 yields increased expression levels, increased solubility, and decreased aggregation while retaining function. Arch Biochem Biophys. 2001;395:57–68. doi: 10.1006/abbi.2001.2574. [DOI] [PubMed] [Google Scholar]
- 25.Scott EE, He YA, Wester MR, White MA, Chin CC, Halpert JR, Johnson EF, Stout CD. An open conformation of mammalian cytochrome P450 2B4 at 1.6-Å resolution. Proc Natl Acad Sci U S A. 2003;100:13196–13201. doi: 10.1073/pnas.2133986100. [DOI] [PMC free article] [PubMed] [Google Scholar]
- 26.Omura T, Sato R. The carbon monoxide-binding pigment of liver microsomes. II. solubilization, purification, and properties. J Biol Chem. 1964;239:2379–2385. [PubMed] [Google Scholar]
- 27.Fernando H, Halpert JR, Davydov DR. Resolution of multiple substrate binding sites in cytochrome P450 3A4: The stoichiometry of the enzyme-substrate complexes probed by FRET and Job’s titration. Biochemistry. 2006;45:4199–4209. doi: 10.1021/bi052491b. [DOI] [PMC free article] [PubMed] [Google Scholar]
- 28.Morrison JF. Kinetics of the reversible inhibition of enzyme-catalysed reactions by tight-binding inhibitors. Biochim Biophys Acta. 1969;185:269–286. doi: 10.1016/0005-2744(69)90420-3. [DOI] [PubMed] [Google Scholar]
- 29.Davydov DR, Deprez E, Hoa GH, Knyushko TV, Kuznetsova GP, Koen YM, Archakov AI. High-pressure-induced transitions in microsomal cytochrome P450 2B4 in solution: evidence for conformational inhomogeneity in the oligomers. Arch Biochem Biophys. 1995;320:330–344. doi: 10.1016/0003-9861(95)90017-9. [DOI] [PubMed] [Google Scholar]
- 30.Renaud JP, Davydov DR, Heirwegh KP, Mansuy D, Hui Bon Hoa GH. Thermodynamic studies of substrate binding and spin transitions in human cytochrome P-450 3A4 expressed in yeast microsomes. Biochem J. 1996;319(Pt 3):675–681. doi: 10.1042/bj3190675. [DOI] [PMC free article] [PubMed] [Google Scholar]
- 31.Regal KA, Nelson SD. Orientation of caffeine within the active site of human cytochrome P450 1A2 based on NMR longitudinal (T1) relaxation measurements. Arch Biochem Biophys. 2000;384:47–58. doi: 10.1006/abbi.2000.2073. [DOI] [PubMed] [Google Scholar]
- 32.Hummel MA, Gannett PM, Aguilar JS, Tracy TS. Effector-mediated alteration of substrate orientation in cytochrome P450 2C9. Biochemistry. 2004;43:7207–7214. doi: 10.1021/bi036158o. [DOI] [PubMed] [Google Scholar]
- 33.Piotto M, Saudek V, Sklenar V. Gradient-tailored excitation for single-quantum NMR spectroscopy of aqueous solutions. J Biomol NMR. 1992;2:661–665. doi: 10.1007/BF02192855. [DOI] [PubMed] [Google Scholar]
- 34.Kowalewski J, Mäler L. Nuclear spin relaxation in liquids: theory, experiments, and applications. Taylor & Francis; New York: 2006. [Google Scholar]
- 35.Mayer M, Meyer B. Group epitope mapping by saturation transfer difference NMR to identify segments of a ligand in direct contact with a protein receptor. J Am Chem Soc. 2001;123:6108–6117. doi: 10.1021/ja0100120. [DOI] [PubMed] [Google Scholar]
- 36.Meyer B, Peters T. NMR spectroscopy techniques for screening and identifying ligand binding to protein receptors. Angew Chem. 2003;42:864–890. doi: 10.1002/anie.200390233. [DOI] [PubMed] [Google Scholar]
- 37.Parella T, Adell P, Sánchez-Ferrando F, Virgili A. Effective multiple-solvent suppression scheme using the excitation sculpting principle. Magn Reson Chem. 1998;36:245–249. [Google Scholar]
- 38.Aires-de-Sousa J, Hemmer MC, Gasteiger J. Prediction of 1H NMR chemical shifts using neural networks. Anal Chem. 2002;74:80–90. doi: 10.1021/ac010737m. [DOI] [PubMed] [Google Scholar]
- 39.Bruce SD, Higinbotham J, Marshall I, Beswick PH. An analytical derivation of a popular approximation of the Voigt function for quantification of NMR spectra. J Magn Reson. 2000;142:57–63. doi: 10.1006/jmre.1999.1911. [DOI] [PubMed] [Google Scholar]
- 40.Kielkopf JF. New approximation to the Voigt function with applications to spectral-line profile analysis. J Opt Soc Am. 1973;63:987–995. [Google Scholar]
- 41.Marshall I, Bruce SD, Higinbotham J, MacLullich A, Wardlaw JM, Ferguson KJ, Seckl J. Choice of spectroscopic lineshape model affects metabolite peak areas and area ratios. Magn Reson Med. 2000;44:646–649. doi: 10.1002/1522-2594(200010)44:4<646::aid-mrm20>3.0.co;2-0. [DOI] [PubMed] [Google Scholar]
- 42.Marshall I, Higinbotham J, Bruce S, Freise A. Use of Voigt lineshape for quantification of in vivo 1H spectra. Magn Reson Med. 1997;37:651–657. doi: 10.1002/mrm.1910370504. [DOI] [PubMed] [Google Scholar]
- 43.Stoica P, Selen Y, Sandgren N, Van Huffel S. Using prior knowledge in SVD-based parameter estimation for magnetic resonance spectroscopy--the ATP example. IEEE Trans Biomed Eng. 2004;51:1568–1578. doi: 10.1109/TBME.2004.828031. [DOI] [PubMed] [Google Scholar]
- 44.Chen H, Van Huffel S, van Ormondt D, de Beer R. Parameter estimation with prior knowledge of known signal poles for the quantification of NMR spectroscopy data in the time domain. Journal of Magnetic Resonance, Series A. 1996;119:225–234. [Google Scholar]
- 45.Viereck N, Nørgaard L, Bro R, Engelsen SB. Chemometric Analysis of NMR Data. In: Webb GA, editor. Modern Magnetic Resonance. Springer; Netherlands, Netherlands: 2006. pp. 1833–1843. [Google Scholar]
- 46.Gay SC, Roberts AG, Maekawa K, Talakad JC, Hong WX, Zhang Q, Stout CD, Halpert JR. Structures of cytochrome P450 2B4 complexed with the antiplatelet drugs ticlopidine and clopidogrel. Biochemistry. 2010;49:8709–8720. doi: 10.1021/bi100914z. [DOI] [PMC free article] [PubMed] [Google Scholar]
- 47.Villafranca JJ. Paramagnetic probes of macromolecules. Methods Enzymol. 1989;177:403–413. doi: 10.1016/0076-6879(89)77023-3. [DOI] [PubMed] [Google Scholar]
- 48.Solomon I. Relaxation processes in a system of two spins. Physical Review. 1955;99:559–565. [Google Scholar]
- 49.Modi S, Primrose WU, Boyle JM, Gibson CF, Lian LY, Roberts GC. NMR studies of substrate binding to cytochrome P450 BM3: comparisons to cytochrome P450 cam. Biochemistry. 1995;34:8982–8988. doi: 10.1021/bi00028a006. [DOI] [PubMed] [Google Scholar]
- 50.Dwek RA. Nuclear Magnetic Resonance (NMR) in Biochemistry: Applications to Enzyme Systems. Oxford University Press; 1973. [Google Scholar]
- 51.Cameron MD, Wen B, Roberts AG, Atkins WM, Campbell AP, Nelson SD. Cooperative binding of acetaminophen and caffeine within the P450 3A4 active site. Chem Res Toxicol. 2007;20:1434–1441. doi: 10.1021/tx7000702. [DOI] [PubMed] [Google Scholar]
- 52.Tsalkova TN, Davydova NY, Halpert JR, Davydov DR. Mechanism of interactions of α-naphthoflavone with cytochrome P450 3A4 explored with an engineered enzyme bearing a fluorescent probe. Biochemistry. 2007;46:106–119. doi: 10.1021/bi061944p. [DOI] [PMC free article] [PubMed] [Google Scholar]
- 53.Davydov DR, Fernando H, Halpert JR. Variable path length and counter-flow continuous variation methods for the study of the formation of high-affinity complexes by absorbance spectroscopy. An application to the studies of substrate binding in cytochrome P450. Biophys Chem. 2006;123:95–101. doi: 10.1016/j.bpc.2006.04.007. [DOI] [PubMed] [Google Scholar]
- 54.Hummel MA, Gannett PM, Aguilar J, Tracy TS. Substrate proton to heme distances in CYP2C9 allelic variants and alterations by the heterotropic activator, dapsone. Arch Biochem Biophys. 2008;475:175–183. doi: 10.1016/j.abb.2008.04.034. [DOI] [PMC free article] [PubMed] [Google Scholar]
- 55.Clore GM, Iwahara J. Theory, practice, and applications of paramagnetic relaxation enhancement for the characterization of transient low-population states of biological macromolecules and their complexes. Chem Rev. 2009;109:4108–4139. doi: 10.1021/cr900033p. [DOI] [PMC free article] [PubMed] [Google Scholar]
- 56.Iwahara J, Schwieters CD, Clore GM. Ensemble approach for NMR structure refinement against 1H paramagnetic relaxation enhancement data arising from a flexible paramagnetic group attached to a macromolecule. J Am Chem Soc. 2004;126:5879–5896. doi: 10.1021/ja031580d. [DOI] [PubMed] [Google Scholar]
- 57.Brunger AT, Adams PD, Rice LM. New applications of simulated annealing in X-ray crystallography and solution NMR. Structure. 1997;5:325–336. doi: 10.1016/s0969-2126(97)00190-1. [DOI] [PubMed] [Google Scholar]
- 58.Clore GM, Schwieters CD. Theoretical and computational advances in biomolecular NMR spectroscopy. Curr Opin Struct Biol. 2002;12:146–153. doi: 10.1016/s0959-440x(02)00302-0. [DOI] [PubMed] [Google Scholar]
- 59.Scott EE, White MA, He YA, Johnson EF, Stout CD, Halpert JR. Structure of mammalian cytochrome P450 2B4 complexed with 4-(4-chlorophenyl)imidazole at 1.9 Å resolution: Insight into the range of P450 conformations and coordination of redox partner binding. J Biol Chem. 2004;279:27294–27301. doi: 10.1074/jbc.M403349200. [DOI] [PubMed] [Google Scholar]
- 60.Knight JL, Mekler V, Mukhopadhyay J, Ebright RH, Levy RM. Distance-restrained docking of rifampicin and rifamycin SV to RNA polymerase using systematic FRET measurements: developing benchmarks of model quality and reliability. Biophys J. 2005;88:925–938. doi: 10.1529/biophysj.104.050187. [DOI] [PMC free article] [PubMed] [Google Scholar]
- 61.Yue SY. Distance-constrained molecular docking by simulated annealing. Protein Eng. 1990;4:177–184. doi: 10.1093/protein/4.2.177. [DOI] [PubMed] [Google Scholar]
- 62.Constantine KL. Evaluation of site-directed spin labeling for characterizing protein-ligand complexes using simulated restraints. Biophys J. 2001;81:1275–1284. doi: 10.1016/S0006-3495(01)75785-2. [DOI] [PMC free article] [PubMed] [Google Scholar]
- 63.Eswar N, Eramian D, Webb B, Shen MY, Sali A. Protein structure modeling with MODELLER. Methods Mol Biol. 2008;426:145–159. doi: 10.1007/978-1-60327-058-8_8. [DOI] [PubMed] [Google Scholar]
- 64.Van Der Spoel D, Lindahl E, Hess B, Groenhof G, Mark AE, Berendsen HJ. GROMACS: Fast, flexible, and free. J Comput Chem. 2005;26:1701–1718. doi: 10.1002/jcc.20291. [DOI] [PubMed] [Google Scholar]
- 65.Oostenbrink C, Soares TA, van der Vegt NF, van Gunsteren WF. Validation of the 53A6 GROMOS force field. Eur Biophys J. 2005;34:273–284. doi: 10.1007/s00249-004-0448-6. [DOI] [PubMed] [Google Scholar]
- 66.Gunsteren WFv, Billeter SR, Eising AA, Hunenberger PH, Kruger P, Mark AE, Scott WRP, Tironi IG. Biomolecular Simulation: The GROMOS96 Manual and User Guide. Verlag der Fachvereine Hochschulverlag AG an der ETH Zurich; Zurich, Switzerland: 1996. [Google Scholar]
- 67.Darden T, York D, Pedersen L. Particle mesh Ewald: An N-log(N) method for Ewald sums in large systems. J Chem Phys. 1993;98:10089–10092. [Google Scholar]
- 68.Jefcoate CR. Measurement of substrate and inhibitor binding to microsomal cytochrome P-450 by optical-difference spectroscopy. Methods Enzymol. 1978;52:258–279. doi: 10.1016/s0076-6879(78)52029-6. [DOI] [PubMed] [Google Scholar]
- 69.Miller GP, Guengerich FP. Binding and oxidation of alkyl 4-nitrophenyl ethers by rabbit cytochrome P450 1A2: evidence for two binding sites. Biochemistry. 2001;40:7262–7272. doi: 10.1021/bi010402z. [DOI] [PubMed] [Google Scholar]
- 70.Koymans L, Donne-op den Kelder GM, Koppele Te JM, Vermeulen NP. Cytochromes P450: their active-site structure and mechanism of oxidation. Drug Metab Rev. 1993;25:325–387. doi: 10.3109/03602539308993979. [DOI] [PubMed] [Google Scholar]
- 71.Locuson CW, Hutzler JM, Tracy TS. Visible spectra of type II cytochrome P450-drug complexes: evidence that “incomplete” heme coordination is common. Drug Metab Dispos. 2007;35:614–622. doi: 10.1124/dmd.106.012609. [DOI] [PubMed] [Google Scholar]
- 72.Segall MD, Payne MC, Ellis W, Tucker GT, Boyes N. Evidence for stabilization of the low-spin state of cytochrome P450 due to shortening of the proximal heme bond. Chem Res Toxicol. 1998;11:962–966. doi: 10.1021/tx980017j. [DOI] [PubMed] [Google Scholar]
- 73.Bridges A, Gruenke L, Chang YT, Vakser IA, Loew G, Waskell L. Identification of the binding site on cytochrome P450 2B4 for cytochrome b5 and cytochrome P450 reductase. J Biol Chem. 1998;273:17036–17049. doi: 10.1074/jbc.273.27.17036. [DOI] [PubMed] [Google Scholar]
- 74.Gharbi-Benarous J, Bertho G, Evrard-Todeschi N, Coadou G, Megy S, Delaunay T, Benarous R, Girault JP. Epitope mapping of the phosphorylation motif of the HIV-1 protein Vpu bound to the selective monoclonal antibody using TRNOESY and STD NMR spectroscopy. Biochemistry. 2004;43:14555–14565. doi: 10.1021/bi0492861. [DOI] [PubMed] [Google Scholar]
- 75.Claasen B, Axmann M, Meinecke R, Meyer B. Direct observation of ligand binding to membrane proteins in living cells by a saturation transfer double difference (STDD) NMR spectroscopy method shows a significantly higher affinity of integrin αIIbβ3 in native platelets than in liposomes. J Am Chem Soc. 2005;127:916–919. doi: 10.1021/ja044434w. [DOI] [PubMed] [Google Scholar]
- 76.Ammann LP, Merritt M, Sagalowsky A, Nurenberg P. Peak-finding partial least squares for the analysis of 1H NMR spectra. Chemometrics and Intelligent Laboratory Systems. 2006;20:231–238. [Google Scholar]
- 77.Zhao Y, Sun L, Muralidhara BK, Kumar S, White MA, Stout CD, Halpert JR. Structural and thermodynamic consequences of 1-(4-chlorophenyl)imidazole binding to cytochrome P450 2B4. Biochemistry. 2007;46:11559–11567. doi: 10.1021/bi7011614. [DOI] [PMC free article] [PubMed] [Google Scholar]
- 78.Hernandez CE, Kumar S, Liu H, Halpert JR. Investigation of the role of cytochrome P450 2B4 active site residues in substrate metabolism based on crystal structures of the ligand-bound enzyme. Arch Biochem Biophys. 2006;455:61–67. doi: 10.1016/j.abb.2006.08.024. [DOI] [PMC free article] [PubMed] [Google Scholar]
- 79.Mizukami Y, Sogawa K, Suwa Y, Muramatsu M, Fujii-Kuriyama Y. Gene structure of a phenobarbital-inducible cytochrome P-450 in rat liver. Proc Natl Acad Sci U S A. 1983;80:3958–3962. doi: 10.1073/pnas.80.13.3958. [DOI] [PMC free article] [PubMed] [Google Scholar]
Associated Data
This section collects any data citations, data availability statements, or supplementary materials included in this article.