
Figure 4. Saturation Transfer Difference (STD) of AP, DMAP and AAP with P450 2B4.
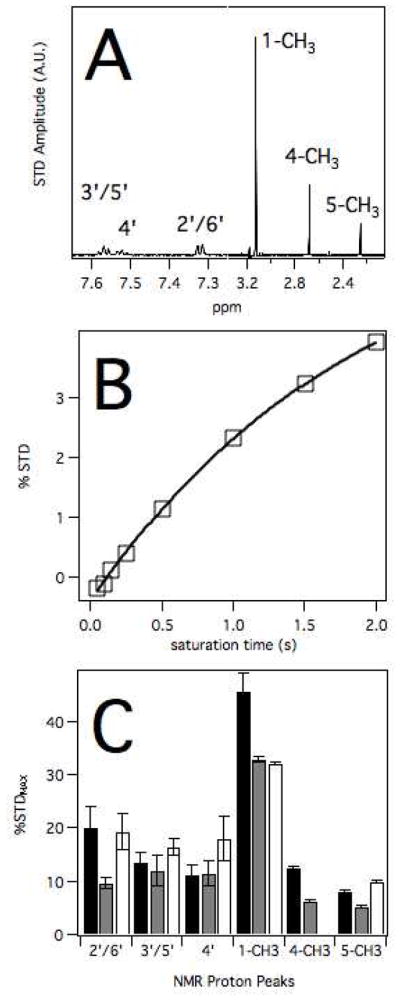
A) STD NMR spectrum of 2B4 with AP. B) %STD transfer of peak e as a function of saturation time. C) %STDMAX versus proton peaks for AP (black), DMAP (gray) and AAP (white).