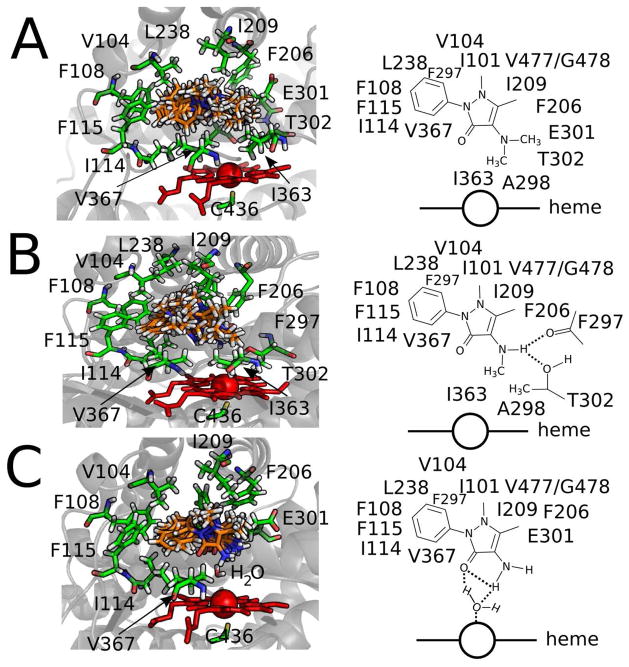
Figure 7. Distance-restrained model of A) AP, B) DMAP and C) AAP to P450 2B4.
The left column shows the MD snapshots of these molecules. To differentiate the protein residues from the ligand, the carbons are colored green and orange, respectively. The heme is colored red. For clarity, only one of the MD snapshots of P450 2B4 is shown and residues I101, V477 and G478 are hidden from view. On the right column are cartoon representations of the figures that are shown on the left. The heme is labeled and shown as a circle and a line. Hydrogen bonds are represented by dotted lines.

