

Abstract
Interactions of beta-amyloid (Aβ) peptides with neuronal membranes have been associated with the pathogenesis of Alzheimer’s disease, however the molecular details remain unclear. We used atomistic molecular dynamics simulations to study the interactions of Aβ40 and Aβ42 with model neuronal membranes. The differences between cholesterol-enriched and -depleted lipid domains were investigated by use of model phosphatidylcholine lipid bilayers with and without 40 mole % cholesterol. Sixteen independent 200 ns-simulation replicates were investigated. The surface area per lipid, bilayer thickness, water permeability barrier, and lipid order parameter, which are sensitive indicators of membrane disruption, were significantly altered by the inserted state of the protein. We conclude that cholesterol protects Aβ-induced membrane disruption and inhibits beta-sheet formation of Aβ on the lipid bilayer. The latter could represent a 2D seeding-template for the formation of toxic oligomeric Aβ in the pathogenesis of Alzheimer’s disease.
Keywords: Protein insertion, Lipid/protein interactions, Membrane protein unfolding
1. INTRODUCTION
Alzheimer’s disease (AD) is a neurological disorder that progressively impairs memory and cognitive capability of patients.1 The presence of extracellular amyloid deposits, or plaques on neuronal membranes, is a significant histological or diagnostic marker of AD.2,3 A major component of these plaques is a self-aggregated fibrillar form of beta-amyloid (Aβ), a short 39–42 residue amphiphilic peptide of ~ 4 kDa.3 Monomeric Aβ is released upon a highly regulated sequential proteolytic cleavage of the large 100 kDa transmembrane amyloid precursor protein (APP) by two proteases, beta and gamma secretases.3 The normal, non-pathological concentration of Aβ in the extracellular matrix is subnanomolar, but its physiological role is unclear.2,4,5
In vitro studies of Aβ reveal that monomeric Aβ adopts a largely random-coil structure6–8 in aqueous solution. At the nonphysiological micromolar concentration region, monomeric Aβ peptides rapidly unfold and self-aggregate to form soluble protofibrils or oligomers that are toxic to neurons.3 The detailed structure of these oligomers and the factors regulating their formation are still unknown.2 According to the amyloid cascade hypothesis,2,9 self-aggregation of Aβ into toxic oligomers is a critical event in the pathogenesis of AD. The key factors that modulate the interaction of monomeric or oligomeric Aβ with the neuronal membrane, a major site of the Aβ deposit formation,9 remain unclear. At present, early lipid membrane interaction events of monomeric Aβ, between its release from the parent APP and before the toxic oligomer formation, are difficult to access either experimentally or computationally.
Experimentally, the major challenge lies in the preparation of structurally homogeneous, monomeric Aβ samples in solution or in lipid membranes. This difficulty stems from the peptide’s propensity to spontaneously form mesoscopic oligomers.10 Computationally, only the NMR-structure of Aβ40 in micelles,11 a lipid membrane-mimic, is currently available. However, the primary structures of Aβ40 and Aβ42, the 40 and 42 residue-long major Aβ peptides, are known.2,11,12 Significant progress in the computational study of the Aβ interactions with membranes requires a computationally robust and biologically relevant multi-component lipid/water membrane nanodomain model. The model system should capture the structures and dynamics of key lipid components with high atomic resolution. Several lipid models of well-defined organizations and/or compositions have been proposed.13–17 Most current studies of Aβ/membrane interactions use small single-component lipid membranes.18–26 However, accumulative experimental evidence suggests that lipids in cell membranes are not randomly distributed, but exhibit highly ordered cholesterol-enriched nanodomains known as “lipid rafts” that are surrounded by disordered cholesterol-depleted lipid matrix, or “non-lipid raft regions”.15,27–33 Therefore, these single-component lipid bilayer models may not provide useful information regarding the conformational transitions of membrane-active peptide structures and their disruptive effects in membranes.
This computational study used phosphatidylcholine (PC) and PC/Cholesterol (PC/CHOL) bilayers to mimic the cholesterol-depleted and -enriched lipid domains of neuronal membranes. We focused on the interactions of Aβ40 and Aβ42 with these lipid domains in a pre-inserted state, which represents a possible initial orientation state of Aβ immediately upon its release from the APP by the secretases.11 We have examined the protein insertion efficiency, protein unfolding and protein-induced membrane disruption. The latter was characterized by the calculated water permeability barrier, transbilayer lipid polar group distribution and order parameters of both PC acyl chains and cholesterol rings. Our results reveal a protective role of cholesterol in preventing both Aβ-induced membrane disruption and membrane surface-induced beta-sheet formation. The latter is important because surface-induced beta-sheet formation may provide a template for the formation of toxic oligomeric Aβ that further leads to the pathogenesis of AD.
2. MATERIALS AND METHODS
2.1. Beta-amyloid Primary Structures
The primary sequence of Aβ40 and Aβ42 are known and shown below.3 Both peptides share the same first 40 residues, but the Aβ42 contain two extra residues, ILE and ALA.
H-Asp-Ala-Glu-Phe-Arg-His-Asp-Ser-Gly-Tyr-Glu-Val-His-His-Gln-Lys-Leu-Val-Phe-Phe-Ala-Glu-Asp-Val-Gly-Ser-Asn-Lys-Gly-Ala-Ile-Ile-Gly-Leu-Met-Val-Gly-Gly-Val-Val-(-ILE-ALA)-OH.
2.2. Simulations of Beta-amyloid in cholesterol-depleted and -enriched membranes
The simulation systems consisted of four different protein/lipid/water/ion complexes: (A) Aβ40 in PC, (B) Aβ42 in PC, (C) Aβ40 in PC/CHOL, and (D) Aβ42 in PC/CHOL. All simulations were in the presence of explicit water and counter ions. We used a 1-palmitoyl-2-oleoyl-PC with a saturated sn-1 chain (16:0) and an unsaturated sn-2 chain (18:1) for our PC lipid. Four independent replicates, each with a different initial velocity distribution but identical initial coordinates of the lipid and protein atoms, were generated for each series. Each replicate of a given series was denoted by a number running from one to four. In total 16 replicates were generated: A1–A4, B1–B4, C1–C4, and D1–D4. In addition, 8 extra independent “control replicates”, four of pure PC and four of pure PC/CHOL, were generated to provide protein-free controls. Each system was simulated for 200 ns, for a grand total of 4800 ns for the 24 trajectories generated in this study.
Aβ40, for the A and C series, or Aβ42, for the B and D series, was pre-inserted into the upper layer of a lipid bilayer. This system was intended to mimic the initial configuration of the protein with respect to neuronal cell membrane right after its enzymatic cleavage from its precursor APP.11 The initial membrane structure was constructed of four identical smaller equilibrated PC or PC/CHOL lipid bilayers from a previous publication.34 Beta-amyloid proteins were then inserted into these initial structures. For the A and B series in which a protein was inserted into a pure PC membrane, a void was created by removing two PC molecules in the upper layer from the original structure. One protein molecule, Aβ40, for A series, or Aβ42, for B series, was inserted into this void. This new structure underwent energy minimization in vacuum to remove energetically unfavorable close contacts between the protein and lipid molecules. The energy-minimized structure was subsequently solvated in a water box then underwent energy minimization again in the presence of solvent. This was followed by a 100 ps simulation on the solvated system in which each atom of the protein or lipid molecule was position-restrained by coupling to its current position with a spring constant of 5000 kJ nm−2 mol−1. The above preparation procedures were effective in preventing the system from structurally disruptive shock at the beginning of each production run due to local incomplete solvation. The procedures for preparing the C and D series were similar, except that two PC and one CHOL molecules were removed before the protein pre-insertion.
The final structures from the preparative procedures described above were taken as the initial structures for the 200 ns production runs. The initial system size of the simulation box was 13.57 × 14.80 × 11.59 nm3 for the A series, 13.24 × 14.44 × 11.71 nm3 for the B series, 13.82 × 15.98 × 14.40 nm3 for the C series, and 13.45 × 15.55 × 14.01 nm3 for the D series. There were 574 PC molecules for the PC bilayers in the A and B series. There were 574 PC molecules and 383 cholesterol molecules for the PC/CHOL bilayers in the C and D series. To assess the effect of the Aβ peptides on lipid membranes, control systems of PC and PC/CHOL lipid bilayers without the protein were constructed using identical preparative procedure but excluding the lipid removal and protein insertion steps. For the control systems, the initial simulation box was 13.30 × 14.51 × 13.26 nm3 for the pure PC and 13.52 × 15.64 × 14.31 nm3 for the PC/CHOL.
Molecular Dynamics (MD) simulations of six different series, A–D series in the presence of protein and two pure lipid bilayer control series with no protein, were performed using the Gromacs 4.0 package35–38 with the GROMOS 87 force field and under constant number, pressure, and temperature (NPT) conditions. Periodic boundary conditions were applied to the x, y, and z directions for the whole system. Initial coordinates for POPC34 and Cholesterol39 were obtained from published data with details given elsewhere.34 A simple point charge (SPC) model40 was employed for water. The non-bonded van de Waals interactions were estimated using a twin-range cut-off Lennard-Jones potential,36 with interactions within 1.0 nm evaluated every step and interactions between 1.0 and 1.5 nm evaluated every 10 steps. Bond lengths were constrained by a linear constraint solver (LINCS) algorithm.41 Short-range electrostatic interactions were calculated with a smoothly-shifted coulomb potential;42 and long-range electrostatic interactions were approximated by a Particle-Mesh Ewald (PME) algorithm.43,44 A leapfrog integrator45 was used for all systems with a 2 fs time step. Water, lipids, and protein in the simulation system were coupled separately to temperature baths of 300 K with a coupling time of 0.05 ps, using a v-rescale thermostat.42,46,47 Isotropic pressures of 1 atm were maintained through a Berendsen barostat48 with a coupling time of 1 ps.
2.3. Data Analysis and Visualization
To analyze the membrane disruption due to the presence of protein, the lipids of each replicate were partitioned into two groups: the annular lipids (ALs) and the non-annular lipids (nALs).49,50 Here, ALs were defined as those lipids that were within 0.5 nm of the protein along the x–y plane and therefore confined to a cylinder-like column of irregular cross-section enclosing the protein. Lipids that were not ALs were nALs. See S1 in Supporting Information for selection details.
2.3.1 Surface Areas of PC and Cholesterol
The average surface areas of PC (APC) and cholesterol (Ac) were calculated based on a method originally proposed by Hofsass et al.51 with some modifications to take into account of the presence of the embedded protein. In our method, the total volume of the protein (vp), the partial volume of the protein embedded in the lipid bilayer (vp′), the average volume of PC (vPC), and the average thickness of lipid bilayer (h) have to be estimated. The calculations and the assumptions used in the estimation of the protein and lipid parameters are given below.
A Monte Carlo integration method was used to calculate the total and partial protein volumes, i.e., vP and vP′, respectively. This method is similar to the estimation of the cross-section area (A) of the conformal AL column mentioned in Supporting Information except that the integration was carried out in 3 dimensions for the volume calculation. The whole AL column was placed inside a 3 dimensional rectangular box with a pre-determined volume of VB. Uniformly distributed random sampling points were generated inside this rectangular box. If the distance between a sampling point and any atom of the protein is less than twice the van der Waals radius of the atom under consideration, this sampling point is considered to be located inside the protein region. Although this cut-off distance, twice the van der Waals radius, of an atom of protein, may be arbitrary, this approach may take into account the void volume inside the alpha helix barrel and the void volume between the protein and lipid molecules. Finally, vP was estimated using the following equation
| (1) |
where nprotein is the number of sampling points inside the protein region, and n is the total number of sampling points. Error estimation is the same as in cross-section area calculation.
To calculate the partial volume vP′, only those residues that satisfied the criterion of zp − zc + rVDW ≥ 0 were counted as the “embedded” residues inside the lipid bilayer. Here zp and zc are defined as the average z-position of the phosphorus (P8) of the PC in the upper layer and the exact z-position of the backbone carbon (Cα) of each residue of the protein, respectively, and rVDW the van der Waals radius of the Cα. The use of approximately three million sample points ensured a precision of 3% with a 99% confidence interval, according to the worst-case sample size suggested by Fishman.52
The average volume of PC (vPC) was calculated by subtracting the volumes occupied by the water (nw · vw), the cholesterol (nCHOL · vCHOL) and the protein (vp) from the volume of the AL or nAL region of interest (vROI), and then divided by nPC as shown in Eq. 2 below. Here nw, nCHOL and nPC represent the numbers of water, CHOL and PC within the vROI. Also, vw and vCHOL correspond to the estimated average volumes of water and cholesterol of 0.031546 and 0.593 nm3, respectively, from a recent study.53
| (2) |
For nAL there is no protein, so the value of vp is zero in Eq. 2.
The average thickness of the lipid bilayer (h) was obtained by dividing the volume of the lipid bilayer (vLB) with or without the embedded protein segment with the cross-section area (A) of the region of interest, AL or nAL, as shown in Eq. 3. Here vLB was estimated by subtracting the volumes occupied by the non-embedded protein (vP - vP′) and the water (nw · vw).
| (3) |
For the case of nAL where the protein is not present, the value of (vP - vP′) is zero in Eq. 3.
Finally, the APC and AC were deduced from the estimated vPC (Eq. 2) and h (Eq. 3) as shown in Eqs. 4 and 5, respectively.
| (4) |
| (5) |
2.3.2. Lipid Order Parameter
The average deuterium order parameter <S> of both sn-1 and sn-2 chains of PC in all A–D series as a function of carbon number was calculated using the Gromacs analysis tool g_order.38 The average orientational order parameter of CHOL in C and D series was also calculated. This order parameter of CHOL is defined as <(3cos2θ−1)/2> where θ is the angle between the z-axis (the membrane normal) and the plane of the sterol rings as determined by the three carbon atoms C5, C13, and C16 in the united-atom topology of cholesterol.39 The above angular bracket represents the average over all the lipid molecules involved within a given region, i.e., AL or nAL. All lipid order parameters were calculated over the last 25 ns of the simulations.
2.3.3. Transbilayer density profile
The transbilayer density profiles for different atom types, the phosphorus of PC (P), the 3-β oxygen of CHOL (C), and the oxygen of water (W), defined as ρP(z), ρC(z) and ρW(z), respectively, were calculated over the last 25 ns of the simulations for both the AL and nAL regions. The calculation of ρi(z) for the ith atom type is given by.
| (6) |
Here, Ni(z) is the number of particles for the ith atom type within a thin z-slice at z-coordinate, A is the area of the AL column or the nAL region, and Δz is the thickness of the z-slice, which also limits the z-resolution of the density calculation. In this study, Δz was fixed at 0.32 nm. The irregular cross-section area A was calculated by a Monte Carlo integration method. See S2 and S3 in Supporting Information for the details of the calculations of A and Ni(z).
2.3.4. Protein Secondary Structures
The secondary structures of Aβ40 and Aβ42 were analyzed by a Defined Secondary Structure of Protein (DSSP) program.54,55 Snapshots of proteins with detailed secondary structures obtained from DSSP were generated by the visualization programs, Molscript v2.156 and Raster3D v2.9.2.57 Snapshots of protein in the presence of lipid bilayers were generated by Visual Molecular Dynamics program VMD v1.8.7.58
3. RESULTS
3.1. Starting Simulation Structures of Beta-Amyloid/Lipid/water/ion Complexes
The initial structures of Aβ40 and Aβ42 in this study are illustrated in Fig. 1. The atomic coordinates of Aβ40 were obtained from the published solution-structure of Aβ40 in a micelle-water environment, a mimic of the water-lipid bilayer, according to Coles et al.11 To create the initial structure of Aβ42, two residues, ILE and ALA, were added to the C-terminus of Aβ40 (see Materials and Methods). Both Aβ40 and Aβ42 in this study had a net charge of −3, and the charge distribution among the residues is depicted in Fig. 1. In Aβ40, there are six negatively charged residues: Glu-3, Asp-7, Glu-11, Glu-22, Asp-23, a de-protonated Val-40 (C-terminus), and three positively charged residues: Arg-5, Lys-16 and Lys-28. The charge distribution of Aβ42 differs from that of Aβ40 only in the location of the negatively charged C-terminus, which is at Ala-42.
Fig. 1. Initial or 0 ns-simulated structures of Aβ40 and Aβ42.
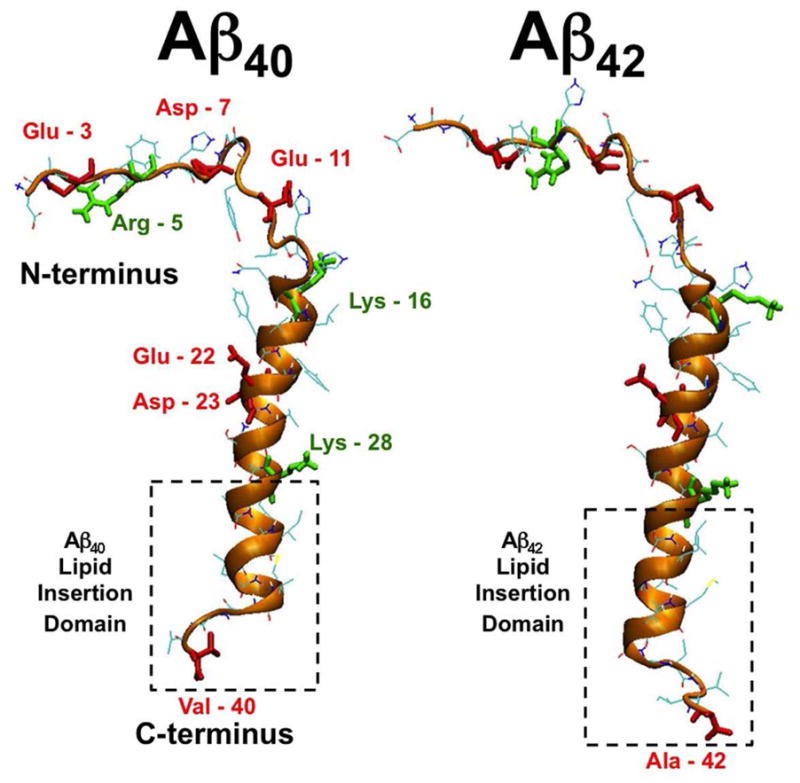
The initial secondary structure of either Aβ40 or Aβ42 consists of the N-terminal (residue 1 to 14) in a random-coil structure and the C-terminal in an alpha-helix barrel (residue 15 to 36) and a random-coil (residue 37 to 40 or 42). The gold ribbon and line represent the alpha helix and random coil structure, respectively, of the backbone of each peptide. The lipid insertion domain, Lys-28 to 40 or Lys-28 to 42 of Aβ40 or Aβ42, respectively, of each peptide is shown inside a dashed-box. Each peptide was partially inserted into the PC or PC/CHOL bilayers with the lipid insertion domain buried into the upper layer of the lipid bilayer with the Lys-28 locating on the phosphate headgroup/water interface. The positively charged residues (Arg-5, Lys-16 and Lys-28) of the protein are in green, whereas the negatively charged residues (Glu-3, Asp-7, Glu-11, Glu-22, Asp-23 and Val-40 or Ala-42) in red.
Both Aβ40 and Aβ42 can be divided into structurally distinct segments: an N-terminal random coil (residues 1 to 14), a C-terminal alpha barrel (residues 15 to 36), and a short random coil tail (residue 37 to 40 for Aβ40 and 37 to 42 for Aβ42). Within the C-terminal region, a transmembrane lipid insertion domain (LID) spans residues 28 to 40 or 42 for Aβ40 or Aβ42, respectively. The LID is highlighted in Fig. 1. Except for the initial positively-charged Lys-28 and the negatively-charged C-terminus, the peptides in this short domain are neutral and highly hydrophobic.11
Each beta-amyloid/lipid/water/ion complex was constructed by inserting Aβ40 or Aβ42 into a PC or PC/CHOL bilayer. Initially, the LID of the protein was placed in the void created at the center of the upper bilayer leaflet. In each case, the C-terminus of the protein was placed at the center of the bilayer (z = 0), with the long axis of the alpha barrel in a vertical orientation, parallel to the z-axis or the bilayer normal, as demonstrated in Fig. 2. This orientation brought the positively charged Lys-28 near the lipid/water interface after the energy minimization and solvation steps (see Materials and Methods). Note that this partially-inserted structure represents a possible membrane location of beta-amyloid upon its release from the APP by the sequential proteolytic cleavages of β and γ-secretases in-vivo.3,9,11
Fig. 2. Summary of 200ns-simulated structures of Aβ40 and Aβ42 in cholesterol-depleted and cholesterol-enriched lipid domains.

(A1–A4) Aβ40 in PC, (B1–B4) Aβ42 in PC, (C1–C4) Aβ40 in PC/CHOL and (D1–D4) Aβ42 in PC/CHOL. The initial structures (A0, B0, C0 and D0) of the above are also shown for comparison. For the protein, the red ribbon and line represent the alpha helix and random coil structure, respectively, of the backbone of each peptide. For the lipid bilayer, the blue spheres represent the polar groups of PC, gray lines the acyl chains of PC, red sticks the cholesterol and gold spheres the polar headgroups of cholesterol. The Z-axis indicates the normal of the bilayer. Water was present during the simulations but is not shown for clarity.
The first column of Fig. 2 depicts the initial structures of the four beta-amyloid/lipid complexes: Aβ40 in PC (A0), Aβ42 in PC (B0), Aβ40 in PC/CHOL (C0), and Aβ42 in PC/CHOL (D0), where 0 indicates initial structure. Water molecules were present in all complexes but for clarity are not shown in Fig. 2. These four molecular complexes represent beta-amyloid proteins of two different chain lengths (40 and 42 residues) in two different lipid environments, PC and PC/CHOL. These complexes mimic the beta-amyloid peptides in the cholesterol-depleted or cholesterol-enriched domains of heterogeneous neuronal membranes immediately after being released from the APP by the secretases.3
3.2. Protein Orientations in Cholesterol-depleted and -enriched Membranes
Each starting structure, A0, B0, C0 or D0 (first column), underwent four independent 200-ns MD simulations, or replicates. The next four columns (2nd to 5th) of Fig. 2 display the final 200-ns structures of each replicate. These are identified as A1–A4, B1–B4, C1–C4 and D1–D4, for Aβ40 in PC, Aβ42 in PC, Aβ40 in PC/CHOL and Aβ42 in PC/CHOL, respectively. Although water molecules were present during the simulations, they are not shown for clarity in Fig. 2. To highlight the hydrophobic region of the bilayer, the acyl chains of PC and the nonpolar region (fused rings and chain) of CHOL are labeled in gray and red, respectively. The polar regions, the polar headgroup of PC and the 3-β OH headgroup of CHOL, are labeled in blue and gold, respectively.
Fig. 2 is a molecular-level visualization of the protein insertion efficiency, or the probability of insertion in a replicate within the 200 ns observation time of this study. In PC bilayers (A and B series), only A1 for Aβ40 (or 25% of the A-series replicates) and B1 and B2 for Aβ42 (or 50% of the B-series replicates) exhibited complete insertion into the bilayer: the “fully-inserted” state. Here, the fully-inserted state was indicated by the C-terminus of the protein migrating through the acyl chain region and anchoring at the polar PC headgroup region of the lower monolayer. For the case of Aβ40 in PC (A-series), the three other replicates (A2–A4) adopted a membrane surface-interaction state, in which the long axis of the alpha barrel within the C-terminal segment tended to align parallel to the x–y plane or the plane of the bilayer. Interestingly, the C-terminus of the A2–A4 replicate protein anchored in the PC polar headgroup region of the upper lipid monolayer instead of the lower lipid monolayer as in A1. This anchoring to the upper monolayer helped stabilize the surface state throughout the 200 ns simulation time. For Aβ42 in PC (B-series), the long axis of the alpha barrel of the protein in B3 was oriented along the membrane normal, whereas that of B4 was tilted. However, the C-terminus of B3 and B4 was not anchored to the headgroups of either leaflet, but instead dangled near the middle of the bilayer. Hence, B3 and B4 were designated “partially inserted”.
In PC/CHOL bilayers (C and D series), two replicates of Aβ40 (C1 and C2, 50% of C-series) and all four replicates of Aβ42 (D1–D4, 100% of D-series) ended in the fully inserted state. The other two Aβ40 replicates, C3 and C4, were partially inserted. The above assignments of surface, partially inserted and fully inserted states of all replicates are summarized in Table 1.
TABLE 1.
Summary of Secondary Structures of Aβ40 and Aβ42 in PC and PC/CHOL bilayers
| Replicate | State | α-helix1 | β-sheet1 | α-helix2 | β-sheet2 |
|---|---|---|---|---|---|
| non-LID | non-LID | LID | LID | ||
| Aβ40 in PC | |||||
| A0 | Partially Inserted | 32.5 | 0 | 22.5 | 0 |
| A1 | Fully Inserted | 31.2 ± 1.7 | 0 ± 0 | 24.8 ± 0.8 | 0 ± 0 |
| A2 | Surface | 32.8. ± 3.8 | 0 ± 0 | 18.3 ± 3.1 | 0 ± 0 |
| A3 | Surface | 32.1 ± 0.9 | 9.3 ± 5.4 | 19.3 ± 2.4 | 0 ± 0 |
| A4 | Surface | 31.2 ± 4.0 | 9.5 ± 2.2 | 19.9 ± 0.8 | 0 ± 0 |
| Aβ42 in PC | |||||
| B0 | Partially Inserted | 35.7 | 0 | 23.8 | 0 |
| B1 | Fully Inserted | 35.2 ± 1.5 | 0 ± 0 | 21.4 ± 0.3 | 0 ± 0 |
| B2 | Fully Inserted | 20.0 ± 5.9 | 0 ± 0 | 2.2 ± 3.3 | 0 ± 0 |
| B3 | Partially Inserted | 32.4 ± 2.1 | 0 ± 0 | 3.8 ± 1.9 | 0 ± 0 |
| B4 | Partially Inserted | 25.2 ± 4.1 | 0 ± 0 | 4.7 ± 3.4 | 0 ± 0 |
| Aβ40 in PC/CHOL | |||||
| C0 | Partially Inserted | 32.5 | 0 | 22.5 | 0 |
| C1 | Fully Inserted | 37.4 ± 0.4 | 0 ± 0 | 18.6 ± 1.8 | 0.0 ± 0.3 |
| C2 | Fully Inserted | 22.1 ± 1.7 | 6.3 ± 5.1 | 0.0 ± 0.1 | 0.5 ± 1.4 |
| C3 | Partially Inserted | 15.1 ± 2.9 | 0 ± 0 | 21.1 ± 2.2 | 0.2 ± 1.7 |
| C4 | Partially Inserted | 19.1 ± 5.9 | 0 ± 0 | 12.9 ± 4.2 | 0.9 ± 1.4 |
| Aβ42 in PC/CHOL | |||||
| D0 | Partially Inserted | 35.7 | 0 | 23.8 | 0 |
| D1 | Fully Inserted | 35.7 ± 0.4 | 0 ± 0 | 14.7 ± 1.1 | 0 ± 0 |
| D2 | Fully Inserted | 33.5 ± 4.6 | 1.6 ± 4.0 | 16.6 ± 0.5 | 0 ± 0 |
| D3 | Fully Inserted | 33.4 ± 5.8 | 0 ± 0 | 5.4 ± 1.2 | 0 ± 0 |
| D4 | Fully Inserted | 29.5 ± 2.1 | 0.0 ± 0.3 | 14.1 ± 0.7 | 0 ± 0 |
non-LID region (Asp-1 to Asn-27);
LID region (Lys-28 to C-terminus). Results (mean ± SD) from DSSP analysis over the last 25 ns of the 200 ns-simulations.
3.3. Protein Conformational Transition in Cholesterol-depleted and -enriched Membranes
The conformational structures of beta-amyloid in lipid bilayers were examined by DSSP analysis (see Materials and Methods). A summary of the secondary structures, expressed as percentage of residues participating in the alpha-helix and beta-sheet structures of the protein, at the beginning and during the last 25 ns of the simulations, is shown in Table 1. Here, we are primarily interested in the conformational transition of two domains, the non-LID (Asp-1 to Asn-27) and the LID (Lys-28 to C-terminus), as described earlier and shown in Fig. 1. As noted in Materials and Methods, the LID represents the portion of the peptide that was pre-inserted into the upper-leaflet of the bilayer in the intial structure. The non-LID region contains the entire random coil N-terminal (residues 1 to 14) and the first part of the C-terminal (residues 15 to 27) whereas the LID region covers the rest of the C-terminal.
The conformational transition of beta-amyloid in PC bilayers (A and B series) is examined first. Fig. 3 shows the evolution of the secondary structure of the protein or DSSP profile throughout the entire 200 ns-simulations for several replicates, i.e., A1, A4, B1 and B2. Here A1, B1 and B2 were in the fully inserted state whereas A4 was in the surface state. As shown in Fig. 3, the alpha-helix structure of both A1 and B1 was largely preserved in both non-LID and LID regions. In contrast, a significant protein folding from a random coil to a beta sheet structure was found in the N-terminal segment (residue 1 to 14) of the non-LID region for the surface state, A4. Yet, the alpha structure for both non-LID and LID regions of A4 was also preserved. For B2, a moderate unfolding from 35.7 to 20% in the non-LID but a large unfolding from 23.8 to 2.2 % in the LID of alpha-helix were evident as shown in Fig. 3 and Table 1. The other replicates in the A-series, A2 and A3 were similar to A4 in alpha-helix content, but A2 did not show beta-sheet structure as shown in Table 1. The B-series replicates B3 and B4 were in the partially inserted state and showed similar alpha-helix contents to B1 and B2 and no evidence of beta sheet formation.
Fig. 3. Representative secondary structures as a function of simulation time for Aβ40 and Aβ42 in cholesterol-depleted lipid domains.

The secondary structures of Aβ40 and Aβ42 in PC bilayers were calculated by DSSP from the representative trajectories, A1, A4, B1 and B2. At the end of the 200 ns-simulations, A4 was in the surface state while A1, B1 and B2 in the fully inserted state (see Fig. 2 and Table 1). Snapshot structures of the peptides at some representative simulation time points based on DSSP analysis are also shown. The location of the end C- or N-terminus is indicated for clarity.
The conformational transition of beta-amyloid in PC/CHOL bilayers (C and D series) was examined next. Fig. 4 shows the DSSP profiles for several replicates, i.e., C1, C2, D1 and D3, all in the fully inserted state at the end of the simulations. Similar to A1 or B1, the alpha-helix content of C1, D1, D2 and D4 was largely preserved. In contrast, there was a large unfolding of alpha-helix from 22.5 to 0% in C2 and 23.8 to 5.2% in D3. For the other replicates in the C-series, C3 and C4 were in the partially inserted state with about 13 to 20% alpha-helix in both non-LID and LID regions as shown in Table 1.
Fig. 4. Representative secondary structures as a function of simulation time for Aβ40 and Aβ42 in cholesterol-enriched lipid domains.

The secondary structures of Aβ40 and Aβ42 in PC/CHOL bilayers were calculated by DSSP from the representative trajectories, C1, C2, D1 and D3. At the end of the 200 ns-simulations, all the shown trajectories are in the fully inserted state (see Fig. 2 and Table 1). See the legend of Fig. 3 for more details.
The more detailed atomistic structures of A1, B1, C1 and D1, all fully inserted states, are shown in Fig. 5. It is clear that the LID of either Aβ40 or Aβ42 was completely embedded into the acyl chain region while the non-LID stayed mainly within the polar region of the bilayer. The positively charged Lys-28 and negatively charged C-terminus, marking the beginning and end residues of the LID region as shown in Fig. 1, respectively, were found to attach to the negatively charged nitrogen (N4) of PC of the upper layer and the positively charged phosphorous (P8) of PC of the lower layer, respectively.
Fig. 5. Representative 200ns-simulated fully inserted structures of Aβ40 and Aβ42 in cholesterol-depleted and -enriched lipid domains.

The representative secondary structures of Aβ40 in PC (A1), Aβ42 (B1), Aβ40 in PC/CHOL (C1) and Aβ42 in PC/CHOL (D1), all in the fully inserted state, are shown. See the legends of Figs.1 and 2 for details.
3.4. Protein-Induced Membrane Disruption in Cholesterol-depleted and -enriched Membranes
The extent of membrane disruption by Aβ40 or Aβ42 in different states (surface and inserted) in PC and PC/CHOL was studied. The membrane disruption was quantified by three biophysical parameters: surface area per lipid (Fig. 6), transbilayer density thickness of lipid polar group and water (Fig. 7), and order parameter of lipid (Figs. 8–10). These parameters were determined for both the annular lipids (ALs) and the non-annular lipids (nALs), as described in Materials and Methods. The differences in membrane parameters between the ALs and nALs provide sensitive, non-invasive indicators of protein-induced membrane disruption in cholesterol-depleted and -enriched membranes. As important controls for assessing the protein effects on the membranes, the above biophysical parameters were also calculated for the pure PC and PC/CHOL bilayers in the absence of protein (See Materials and Methods). The following four subsections describe the results.
Fig. 6. Summary of the surface area per lipid of PC and cholesterol for Aβ40 and Aβ42 in cholesterol-depleted and cholesterol-enriched lipid domains.

The calculated surface area of PC and CHOL of the ALs (dark blue and orange, respectively) and of the nALs (light blue and yellow, respectively) in the PC or PC/CHOL. The surface area per lipid was also calculated in pure PC (white) and PC/CHOL (green) bilayers in the absence of Aβ peptide. The surface area was calculated over the last 25 ns of the 200 ns-simulations. The error bar represents the SE (= SD/√N, where N = number of replicates) of the mean.
Fig. 7. Summary of the transbilayer thickness of PC and cholesterol polar groups and critical water thickness for Aβ40 and Aβ42 in cholesterol-depleted and cholesterol-enriched lipid domains.

The transbilayer thicknesses of the PC and cholesterol headgroup in the AL column, labeled as black and orange, respectively, and in the nAL region, labled as gray and yellow, respectively, were calculated from the averaged transbilayer peak-to-peak distance of the number density profiles of PC headgroup phosphorus and 3-β hydroxyl polar oxygen in cholesterol, respectively, as demonstrated in Figs. S2 and S3 in Supporting Information. For the case of water, the critical thickness was evaluated from the averaged |z| distance of water profile at a fixed number density of 1 nm−3 in the ALs (dark blue) and in the nALs (light blue) also demonstrated in Figs. S2 and S3 in Supporting Information. The plot represents the average of all three surface states (A2–A4 for Aβ40 in PC), combined partially and fully inserted states (B1–B4 for Aβ42 in PC and C1–C4 for Aβ40 in PC/CHOL) and all fully inserted states (D1–D4 for Aβ42 in PC/CHOL). The above thickness parameters of PC, cholesterol and water were also calculated in pure PC and PC/CHOL bilayers in the absence of Aβ peptide and are labeled in white, green and orange bars, respectively. All calculations were performed over the last 25 ns of the 200 ns-simulations. The error bar represents the SE of the mean.
Fig. 8. Representative order parameters of PC acyl chains and cholesterol for Aβ40 and Aβ42 in cholesterol-depleted lipid domains.

Averaged Deuterium order parameters of the sn-1 chains of ALs (black solid triangle), the sn-1 chains of the nALs (black open triangle), the sn-2 chains of ALs (blue solid circle), and the sn-2 chains of nALs (blue open circle) in the upper layer (z > 0) and the lower layer (z < 0) as a function of the carbon number position of the PC acyl chain. The representative plots correspond to the fully inserted states of Aβ40 in PC (A1) and Aβ42 in PC (B1) and the surface state of Aβ40 in PC (A4) and partially inserted state of Aβ42 in PC (B4). The order parameters were calculated over the last 25 ns of the 200 ns-simulations.
Fig. 10. Summary of the cholesterol order parameter for Aβ40 and Aβ42 in cholesterol-enriched lipid domains.

Averaged order parameter of cholesterol of ALs (orange) and nAL (yellow) in the upper layer (z > 0) and the lower layer (z < 0) of Aβ40 and Aβ42 in PC/CHOL. The order parameter in pure PC/CHOL in the absence of Aβ peptide (white) was also calculated. All order parameters were calculated over the last 25 ns of the 200 ns-simulations. The error bar represents the SE of the mean.
3.4.1. Surface Area per Lipid
The average surface area of PC (APC) was calculated for nALs and ALs for the PC and PC/CHOL bilayers and for the PC lipids in the control pure PC and PC/CHOL bilayers. The last 25 ns of the simulations were used, and the results are summarized in Fig. 6. In the PC membrane, the APC of the nALs was 66.24 Å2 for the surface state of Aβ40 and 63.14 Å2 for the inserted state of Aβ42, but increased to 73.87 and 68.05 Å2 for the ALs, representing a change of ~ 12 and 8%, respectively. The APC in the control, i.e., pure PC without protein, was 65.50 Å2 very similar to the calculated value of APC of the nALs. In the PC/CHOL membrane, the APC of the nALs was 52.54 Å2 for Aβ40 and 50.92 Å2 for Aβ42, all in the inserted state. These values increased to 70.52 and 65.21 Å2 for the ALs, respectively, that amounted to an increase of ~ 34 and 28%, respectively. The APC of the pure PC/CHOL bilayers (control) was 51.15 Å2, similar to the APC of the nALs noted above.
The average surface area of CHOL (AC) was also calculated for both nALs and ALs in the PC/CHOL bilayers as well as for all the cholesterol in the control pure PC and PC/CHOL bilayers over the last 25 ns of the simulations, and the results are summarized in Fig. 6. The AC of the nALs was 31.75 Å2 for Aβ40 and 30.81 Å2 for Aβ42, and was 30.05 and 29.75 Å2 for the ALs, respectively. The AC of the pure PC/CHOL (control) was 31.15 Å2, very close to the values in ALs or nALs described above.
3.4.2. Transbilayer Density Profiles of Lipid Polar Group and Water
The transbilayer, or z-dependent, number density profiles of PC polar headgroup phosphorus (P8), cholesterol 3-β hydroxyl oxygen (O6) and water oxygen were calculated for all the A–D series and the control PC and PC/CHOL bilayers. These computations used data from the last 25 ns of the simulations (see Materials and Methods). Here z is defined as the normal of the bilayers with z = 0 at the mid plane of the bilayer. Representative profiles of the A and B series are shown in Figs. S2A and S2B and those of the C and D series in Figs. S3A and S3B in Supporting Information. Two well-defined phosphorus peaks characterize the PC phosphate headgroup distributions in the lower (negative z) and upper (positive z) leaflets of both PC and PC/CHOL bilayers. Similarly, cholesterol polar oxygen peaks in the upper and lower leaflets indicate the cholesterol polar headgroup distributions. The peak-to-peak PC-phosphorus and CHOL-oxygen z-distances, zP and zC respectively, provide a measure of the average transbilayer thickness of PC and CHOL in the lipid bilayer.
The number density of water oxygen decreased progressively as the relative z-distance from the bilayer center, or | z |, decreased in the upper and lower layers as shown in Figs. S2A, S2B, S3A and S3B. Therefore, this z-profile of water density provides useful information about the transbilayer water permeability barrier of the lipid bilayer. To provide a quantitative measure of this permeability barrier, the z-distance of the water density profile at a fixed density of 1 nm−3, defined in here as the “critical” transbilayer water barrier or zW, was determined. The critical density of 1 nm−3 is ~ 3% of the known number density of bulk water, which is about 33.3 nm−3. This 1 nm−3 critical density provided a common gauge to compare water barrier thickness among the bilayer membranes of all six series, i.e., A–D and two pure bilayer controls.
The above three transbilayer membrane parameters (zP, zC and zW) calculated from the density profiles of the ALs and nALs of all replicates in series A–D and in the two bilayer controls over the last 25 ns of the simulations are summarized in Fig. 7. Similar to those of surface area in Fig. 6, the data shown in Fig. 7 represent averages over the combined partially and fully inserted states for either Aβ42 in PC (B1–B4) or Aβ40 in PC/CHOL (C1–C4).
The results of the transbilayer PC thickness were first examined. In the nALs of the PC bilayers (Fig. 7), the average zP was 3.50 nm for the surface state of Aβ40 and 3.66 nm for the inserted state of Aβ40. However, these values dropped to 3.24 nm and 3.07 nm in the ALs, a decline of ~ 7 and 16%, respectively. For comparison, the zP was 3.62 nm in pure PC bilayers (control) and very similar to the above values in the nALs. The nALs of PC/CHOL bilayers showed an average zP of 4.16 nm for Aβ40 and 4.29 nm for Aβ42 both in the inserted state. Yet zP for the ALs was 3.67 and 3.83 nm, ~12 and 11 % less than the nALs. Also for comparison, the zP was 4.25 nm in pure PC/CHOL bilayers (control) and very similar to the above values in the nALs. We notice that the overall zP of the pure PC/CHOL bilayers was ~ 17% larger than that of the pure PC bilayers. This cholesterol-induced increase in bilayer thickness is clearly evident in Figs. 2 and 5.
The results of the transbilayer cholesterol thickness in PC/CHOL were also examined. Here the average zC was 3.35 nm for Aβ40 and 3.44 m for Aβ42 for the nALs but declined ~13 and 15% to 2.94 and 2.90 nm for the ALs. For comparison, the zC was 3.41 nm in pure PC/CHOL bilayers (control) and very similar to the above values in the nALs.
Overall, the above transbilayer lipid (PC and CHOL) thickness results indicate that the protein created a moderate decline in the bilayer thickness and that in the absence of cholesterol the inserted state protein perturbed the bilayer thickness slightly more than the surface state protein.
Finally, the transbilayer water profile was examined. In the nAL region of PC bilayers, the average zW was 2.02 nm for the surface state of Aβ40 and 2.13 nm for the inserted state of Aβ42 as shown in Fig. 7. However, in the ALs, zW dropped to 1.82 nm and 1.54 nm, representing a decline of ~ 10 and 28%, respectively. In the nALs of PC/CHOL bilayers, the average zw was 2.97 nm for Aβ40 and 3.08 nm for Aβ42 in the inserted state. In the ALs, these values dropped to 2.56 nm and 2.55 nm, i.e., a decline of ~14 and 17 %, respectively. For comparison, the zW was 2.11 nm in pure PC and 3.01 nm in pure PC/CHOL, similar to the corresponding value in nALs shown above. These results suggest that the protein induced larger decline in the water barrier thickness for Aβ42 than for Aβ40 in either PC or PC/CHOL bilayers. The observed change was less in PC/CHOL than PC in the inserted state.
3.4.3 Order Parameters of PC Acyl chains
The average order parameters of the PC acyl chains, sn-1 (SP1) and sn-2 (SP2), in PC bilayers for typical replicates are shown in Fig. 8. The results are categorized by proximity to the protein (nALs or ALs) and by leaflet (upper or lower layer). In general, the value of SP1 or SP2 was smaller in the ALs than in the nALs suggesting that the protein disturbed the order of nearby acyl chains. Similar results were seen for PC/CHOL bilayers as demonstrated by Fig. 9.
Fig. 9. Representative order parameter of PC acyl chains for Aβ40 and Aβ42 in cholesterol-enriched lipid domains.

Averaged Deuterium order parameters of the sn-1 chains of ALs (black solid triangle), the sn-1 chains of nALs (black open triangle), the sn-2 chains of the ALs (blue solid circle), and the sn-2 chains of nALs (blue open circle) in the upper layer (z > 0) and the lower layer (z < 0) as a function of the carbon number position of the PC acyl chain. The representative plots correspond to the fully inserted states of Aβ40 in PC/CHOL (C1), Aβ42 in PC/CHOL (D1 and D3) and partially inserted state of Aβ40 in PC/CHOL (C4). The order parameters were calculated over the last 25 ns of the 200 ns-simulations.
For both Aβ40 and Aβ42 in PC bilayers as illustrated in Fig. 8, nALs show a progressive decline in the order parameter of the saturated sn-1 chain (16:0) as a function of carbon number (n), and a prominent dip of the order at n = 9, the location of the double-bond of the unsaturated sn-2 chain (18:1).
For Aβ40 in the fully inserted state (A1), SP1 for n < 9 and SP2 for n > 9 were much smaller in the ALs than in the nALs of the upper layer. In contrast, for Aβ40 in the surface state (A4), both SP1 and SP2 for n < 6 were only slightly smaller in the ALs than in the nALs of the upper layer. These observations indicate that Aβ40 perturbs the acyl chains of the upper layer more effectively when fully inserted than when remaining in the surface state. For the lipids in the lower layer of either A1 or A4, the values of SP1 in the ALs were similar to those in the nALs for all n’s. A similar observation was found for the values of SP2. These results suggest a lack of perturbation of the acyl chain order in the lower layer by Aβ40 in either inserted or surface state.
For Aβ42 in the fully inserted state (B1), SP1 for n < 9 was smaller in the ALs than in the nALs of the upper layer, while SP2 remained the same in ALs and nALs. Again, for the lipids in the lower layer, the values of SP1 or SP2 in ALs were similar to those in the nALs indicating no significant acyl chain perturbation induced by the inserted Aβ42 in the lower lipid layer. For Aβ42 in the partially inserted state (B4), SP1 for all n in ALs was similar to that in nALs, but SP2 for all n < 9 was much smaller in the ALs than in the nALs in the upper layer. For the lower layer, SP1 for n < 9 and SP2 for all n were much smaller in ALs than in nALs. It is interesting that in the fully inserted state Aβ42 had little effect on the lipid order in the lower lipid layer, but when partially inserted, a large decline for B4 was detected. This suggests that for pure PC membranes, the partially inserted state is the most perturbing, and that the sn-2 chains were preferentially disturbed by Aβ42.
As shown in Fig. 9, the values of SP1 and SP2 for lipids in PC/CHOL bilayers were significantly higher than those in the PC bilayers. Here, the fully inserted (C1) or partially inserted (C4) Aβ40 in PC/CHOL bilayers has only moderate perturbation effects in lowering the SP1 or SP2 of the ALs in the upper layer when compared with the inserted Aβ40 in PC bilayers (see Fig. 8). However, for the lower lipid layer, strong perturbations by the inserted or partially inserted Aβ40 in the ALs of PC/CHOL bilayers (Fig. 9) were evident when compared with no perturbation at all for the inserted Aβ40 in PC bilayers (see Fig. 8). In addition, Aβ42 appeared to be more effective than Aβ40 in inducing acyl chain disorder, especially in the lower leaflet as clearly demonstrated in Fig. 9.
As controls, the average SP1 and SP2 of all PC lipids in the pure PC and PC/CHOL bilayers in the absence of protein were calculated over the last 25 ns of the simulations. The results of the controls were directly compared with the order parameters in the nALs for the same representative replicates (A1, A4, B1, B4, C1, C4 and D1 and D3) as described above. As demonstrated in Figs. S4A and S4B of SI, the values of SP2 in the upper or lower layer of PC and PC/CHOL were almost identical to those in the nALs of the same bilayers for either Aβ40 or Aβ42. On the other hand, the values of SP1 in the nALs of Aβ40 in PC (A1 and A4) and in PC/CHOL (C1 and C4) bilayers were slightly lower than those in the pure PC. The reverse, i.e., the order in control slightly higher than that in nALs, was evident for Aβ42 in PC (B1 and B4) and in PC/CHOL (D1 and D3) bilayers. The difference between the control and the nALs was however much smaller than the large perturbation effect of protein in the ALs as shown in Figs. 8 and 9.
3.4.4 Order Parameters of Cholesterol
Cholesterol order parameter (SC) provides a unique measure of the orientational distribution of the long axis of the cholesterol rings with respect to the normal of the PC/CHOL bilayer. Fig. 10 summarizes the average SC of ALs and nALs in both upper and lower leaflets of PC/CHOL for Aβ40 and Aβ42. The average SC of nALs was 0.62 in the upper layer and 0.70 in the lower layer for Aβ40, but slightly higher at 0.66 and 0.74, respectively, for Aβ42. Similar to the trend of SP1 and SP2 of PC, the SC of ALs in either upper or lower layer was smaller than that of nALs for both Aβ40 and Aβ42. For the ALs in Aβ40, the average SC was 0.42 in the upper layer and 0.50 in the lower layer, reductions of approximately 32 and 29% compared with that of nALs. For Aβ42, the order parameter declined 8% and 23% between AL and nAL cholesterol for the upper and lower leaflets. Therefore, Aβ40 disrupted the cholesterol orientational distribution in the upper layer more than Aβ42, whereas the extent of disruption was similar in the lower layer. As controls, the average SC of cholesterol was 0.66 in the upper layer and 0.71 in the lower layer of the pure PC/CHOL bilayers. These values were very similar to those in the nALs of the upper and lower layers as described above.
3.4.5. Site-specific Cholesterol Interaction Dynamics with Protein
Residue-specific cholesterol/protein interaction dynamics based on the time evolution of the minimum distance between the cholesterol and each individual protein residue was examined. Figs. 11 and 12 show the kinetics of representative replicates (C1, C2, D1 and D3). Since a cutoff of 5 Å was used to define the AL boundary and a distance range of 0 to 5 Å was used in generating the plots, Figs. 11 and 12 highlight the interaction dynamics of cholesterol within the ALs. It is clear that most of interactions between cholesterol and the protein were within the LID of either Aβ40 or Aβ42. Generally, large fluctuation in the minimum distance with an average > 3 Å were found. However, Lys-28 of C1 (Fig. 11) clearly shows a minimum distance of around ~ 2Å, which remained stable for the last 25 ns of the simulations. A previous study of cholesterol interaction dynamics with a 17-residue long membrane-active peptide dynorphin A also showed a close interaction distance between cholesterol and Lys-11 of ~ 2Å.17 Close examination of replicate C1 during the last 25 ns revealed interactions between the 3-β hydroxyl group of cholesterol and the Lys-28 residue of Aβ40 as shown in Fig. 13.
Fig. 11. Cholesterol interaction dynamics with Aβ40 in cholesterol-enriched lipid domains.

The time evolution of the minimum distance (in Å) between cholesterol and each residue of Aβ40 as a function of simulation time (in ns) is shown. The order of residues starts from the top (N-terminus) to the bottom of the left column and continues with the top to the bottom (residue C-terminus) of the right column. The vertical arrow marks those residues within the LID of each protein. The panel marked with an asterisk indicates the interaction dynamics of cholesterol with Lys-28 where the minimum distance between them was observed to be the shortest (~ 2 Å) and stable when compared with other kinetics plots in the last 25 ns.
Fig. 12. Cholesterol interaction dynamics with Aβ42 in cholesterol-enriched lipid domains.

The time evolution of the minimum distance (in Å) between cholesterol and each residue of Aβ42 as a function of simulation time (in ns) is shown. See the legend of Fig. 11 for details.
Figure 13. Demonstration of the close contact between cholesterol and Lys-23 of Aβ40 in cholesterol-enriched lipid domains.
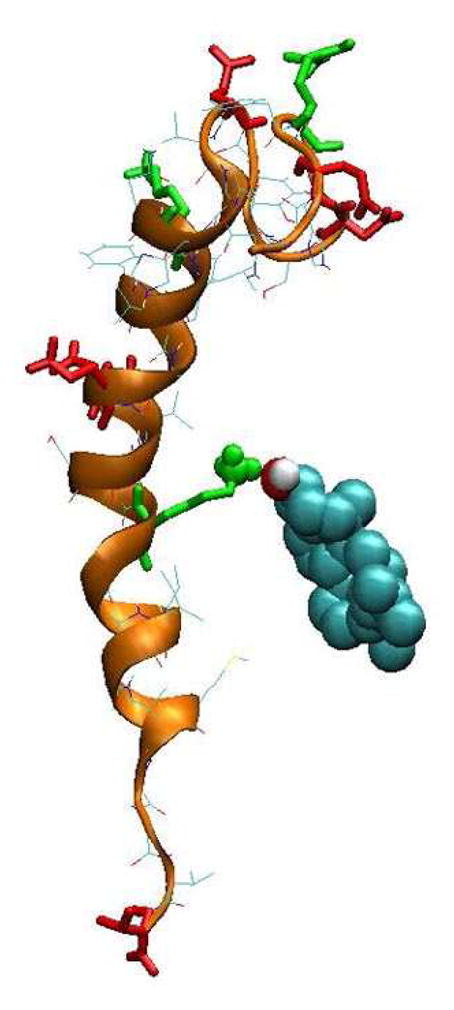
The cholesterol is represented by van der waals spheres. A close contact between the Lys-23 of Aβ42 and the 3-β hydroxyl group of cholesterol is clearly observed. See the legend of Fig. 1 for details of the protein representation.
To further examine the possibility of local cholesterol enrichment around the protein in the ALs, the local molar ratio of cholesterol XCHOL, defined as Chol/(PC+CHOL), was calculated using the last 25 ns of the simulations. For the representative replicates, the value of XCHOL (mean ± SD of mean) in the ALs was 0.436 ± 0.023 for C1, 0.413 ± 0.030 for C2, 0.369 ± 0.020 for D1 and 0.360 ± 0.026 for D3. For comparison, the value of XCHOL in the nALs was 0.399 ± 0.001, 0.4000 ± 0.001, 0.401 ± 0.001 and 0.402 ± 0.001, as expected. Hence, no significant enrichment of cholesterol in the ALs, except perhaps a slight increase for C1, was evident. The time evolution of XCHOL in both ALs and nALs for the above replicates are given in Fig. S5 of Supporting Information.
4. DISCUSSION
An atomistic MD simulation was employed to examine the role of cholesterol in modulating the membrane interactions of two beta-amyloid peptides. The peptides, Aβ40 and Aβ42, interacted with PC and PC/CHOL bilayers that mimic cholesterol-depleted and -enriched membrane domains of the neuronal membranes. Starting from a partially inserted membrane orientation, we have used 200 ns-simulations to investigate (1) the protein orientation in the lipid bilayer, (2) the protein folding/unfolding behavior in the LID and non-LID regions, and (3) the protein-induced membrane disruption in the bilayers. These three membrane-associated events relate to early membrane interactions of the beta-amyloid peptide as it is released from the parent-APP by the secretases in-vivo.3 Sixteen independent simulation replicates and eight pure lipid bilayer controls representing a total simulation time of 4.8 microseconds were successfully generated and systematically analyzed to reveal the role of cholesterol in these membrane interaction events.
The membrane orientation and interaction events of Aβ with neuronal membranes in atomistic details and biologically relevant time scale are important unsolved problems. This MD simulation study provides evidence that the shorter Aβ40 prefers the surface state over the inserted state in cholesterol-depleted membranes. However, in cholesterol-enriched membranes, the Aβ40 exhibited only partially or fully inserted state with no sign of surface state. For the case of the longer Aβ42, the peptide exhibited only the partially or fully inserted state in cholesterol-depleted membranes but exclusively the fully inserted state in cholesterol-enriched membranes. The unique surface state preference of Aβ40 in cholesterol-depleted membranes suggests that the shorter Aβ40 released in a disordered cholesterol-free lipid domain is likely to migrate to the membrane surface. On the other hand, in a more ordered lipid domain with cholesterol, or a lipid raft, newly released Aβ40 will stay in the inserted orientation. For the more hydrophobic, longer Aβ42, the peptide stays in the inserted orientation whether or not it is released in a cholesterol-enriched domain. However, the depth and possibly the stability of the inserted state do depend on cholesterol enrichment. These observations indicate the importance of the site of beta-amyloid release in the highly heterogeneous neuronal membranes regarding the preference of protein membrane orientation.59
Our study also suggests an interesting insertion stabilization mechanism of beta-amyloid in membrane. With the peptide in an initial orientation in which the Lys-28 is at the lipid/water interface and the C-terminus at the lipid bilayer center, we observed Lys-28 snorkeling.60,61 In all the inserted states observed in this study, the lysine residue stretched to the charged region to the negatively charged PC phosphorus or in few cases to the 3-β hydroxyl polar group of cholesterol (Figs. 5 and 13). In addition, the negatively charged C-terminus was found to anchor to the positively charged PC nitrogen (Figs. 2 and 5). This intriguing dual-docking mechanism, lysine snorkeling to the upper layer and C-terminus anchoring to the lower layer, appears to stabilize the fully inserted protein orientation. This protein insertion-stabilization mechanism might operate in the neuronal membrane in-vivo to keep the newly released protein in the inserted state upon its release by the secretases. An interesting implication inferred from this simulation study is that cholesterol essentially doubles the insertion efficiency of the peptide, i.e., from 25 to 50% for Aβ40 (A to C series) and 50% to 100% for Aβ42 (B to D series). Of course, determining the true insertion efficiency will require more replicates and longer observation time. Note that previous experiment work has indicated that cholesterol strongly promotes Aβ40 insertion in saturated PC bilayers.7
Protein folding/unfolding events of the LID and non-LID in the cholesterol-depleted and -enriched membranes were examined by calculating the percentages of ordered structures, alpha-helix and beta sheet in the two protein domains (Table 1). The LID is a unique peptide domain that begins with a positively charged Lys-28, followed by a region of highly hydrophobic and neutral segment and then ends with a negatively charged C-terminus. The non-LID, on the other hand, is charged and polar. Therefore, the non-LID interacts exclusively with the polar region of the membranes whereas the LID interacts with the lipid acyl chains only when the peptide is in the inserted state (Fig. 2). We observed prominent membrane surface-assisted protein folding in the PC membrane only. There, random coil-to-beta sheet transition occurred in the non-LID of Aβ40 for replicates A3 and A4, two of the three observed surface states for Aβ40. This result suggests that the highly disordered cholesterol-depleted lipid domain provides a favorable surface for the non-LID to interact with the polar region of the membrane. This gives rise to the highly structured beta sheet on the membrane surface. This structured motif of the protein might represent a 2D surface-template6 for the formation of the beta-amyloid oligomers by recruiting other beta-amyloid peptides either in the membrane or from the aqueous phase. More simulation and experimental studies are needed to confirm this membrane event.
Interestingly, the longer and more hydrophobic peptide, Aβ42 exhibited only the inserted orientation in the absence of cholesterol and the non-LID showed no protein folding on the membrane surface (Table 1). This behavior demonstrates the importance of the protein membrane orientation in protein folding on the cholesterol-depleted membrane surface. In the highly ordered PC/CHOL bilayers, appearance of unstable beta sheets was found for both the non-LID and the LID of Aβ40. There were fewer beta sheets in the non-LID of Aβ42, and they were less stable. These observations indicate that the highly ordered environment of cholesterol-enriched membranes might promote some unstable beta sheets formation within our current 200 ns simulation time. We do not know whether these unstable beta sheets will dissipate or form stable beta sheets. This awaits future exploration.
In addition to protein folding to beta sheets, we observed protein unfolding from a structured alpha-helix to random coil of both non-LID and LID. There was little protein unfolding in the surface state for either the non-LID or the LID when compared with the inserted state. In addition, for the inserted state, the extent of the unfolding in the non-LID was consistently smaller than that in the LID. At most, 46% of the helix unfolded (non-LID of C3). Unfolding in the LID varied widely, from a slight increase in the helix content for A1 to 0% helix, or complete unfolding, in C2. These observations suggest that partial unfolding of the LID of a newly released Aβ is likely to occur rapidly within the structurally homogeneous and hydrophobic acyl chain region of the neuronal membranes. However the non-LID is likely to unfold more slowly on the more structurally complex polar lipid headgroup region. More replicates and much longer simulations are needed to identify the role of cholesterol in modulating the partial folding of the non-LID and LID of the peptide. However, our cholesterol interaction dynamics results (Figs. 11–13) suggest that cholesterol exerts its effects mainly by aligning the PC acyl chains or via the condensing effect13,14 rather than by direct contact with the protein.
The protein-induced membrane disruption was measured by eight membrane parameters: surface area per lipid (AP and AC), transbilayer thickness (zP, zC and zW) and lipid order (SP1, SP2 and SC). These parameters were calculated for the ALs and nALs of the cholesterol-depleted and -enriched membranes. Although the selection of the 0.5 nm cutoff in selecting the AL and nALs is somehow arbitrary, it provides a useful length scale standard to compare the protein-induced effects between two peptides of different lengths and membranes of different cholesterol contents.
Overall both Aβ40 and Aβ42 significantly increased the surface area of PC in PC and PC/CHOL bilayers (Fig. 6) upon comparing the measurements in ALs vs. nALs. Only a modest increase in the PC surface area was induced by the protein in PC bilayers. However, a larger increase in the PC surface area by the protein was found in PC/CHOL bilayers. Aβ40 appeared to perturb the PC surface area slightly more than Aβ42 (Fig. 6) probably due to the hydrophobic mismatch between the shorter Aβ40 and the thicker PC/CHOL bilayer vs. the longer Aβ42 and the thicker PC/CHOL. No significant change however was observed in the surface area of cholesterol. This observation suggests that the surface area of cholesterol as calculated by the current method is not a sensitive indicator of protein-induced disruption of membrane structures. Future work on the development of a more accurate method for cholesterol surface determination is still needed to address this address.
Interestingly the extent of protein-induced decline in the average zP and, particularly, zW of Aβ42 in PC (B series) ranked the highest among the other three systems (A, C and D series. This observation suggests stronger membrane disruption of Aβ42 in cholesterol-depleted membranes. In addition, the larger protein-induced decline in zW, an important non-invasive marker of membrane disruption, found in the B series agrees with the observation that that Aβ42 is more neurotoxic than Aβ40 in cell studies.3 Our study further suggests that most membrane disruption was associated with Aβ42 in cholesterol-depleted membranes and that the presence of cholesterol (C and D series) significantly increased the water barrier thickness when compared with the case of no cholesterol (A and B series). This indicates a protective effect of cholesterol in preventing membrane disruption. A similar observation of cholesterol-induced reduction of water influx inside the acyl chain region was also found in a recent study on dimyristoyl-PC (DMPC) and DMPC/CHOL bilayers.17
Finally, the average SC provides a useful marker for the effect of protein on the sterol orientation in membranes. Here, a larger protein-induced 32% drop in the SC of the upper layer for Aβ40 than for Aβ42 in PC/CHOL bilayers may indicate a stronger membrane disruptive effect of Aβ40 vs. Aβ42 in cholesterol-enriched membranes. This differential effect may again be related to the hydrophobic length mismatch of the shorter protein placed in a thicker cholesterol-containing membranes. This also agrees with the stronger perturbation effect of Aβ40 on PC surface area discussed above Interestingly, this mismatch may also explain the presence of partially inserted state for Aβ40 when only the fully inserted state existed for Aβ42. This would reflect the higher energy requirement of stretching the shorter protein in a thicker bilayer.
5. CONCLUSIONS
In conclusion, our simulation study provides a systematic survey of the membrane interaction events of the beta-amyloid peptides in cholesterol-depleted and -enriched membranes based on the 200 ns-simulation replicates The protective role of cholesterol in preventing beta-sheet formation and the membrane disruption provides some molecular-based insights of the early membrane interaction events of the newly released beta-amyloid from secretases that might be associated with the pathogenesis of Alzheimer’s.
Supplementary Material
Acknowledgments
This work was supported by the Robert A. Welch Research Foundation grant (D-1158) and NIH grant (RC1GM090897-02) given to K.H.C.
Footnotes
SUPPORTING INFORMATION AVAILABLE
Details of mathematical procedures for the determination of the AL column and the nAL region (S1), the calculation of cross-section area (A) of AL column and nAL region (S2) and the calculation of particle number (Ni(z)) (S3) are detailed. Also given are representative number density profile plots of lipid and water in PC and PC/CHOL in the presence or absence of protein (S4 – S7), comparisons of order parameter of PC acyl chains in nALs and in pure bilayers (S8 – S9) and time evolution of XCHOL in ALs and nAls (S10) of PC and PC/CHOL bilayers. This information is available free of charge via the Internet at http://pubs.acs.org.
References
- 1.Sims I. Alzheimers Dement. 2009;5:234–270. doi: 10.1016/j.jalz.2009.03.001. [DOI] [PubMed] [Google Scholar]
- 2.Roberson ED, Mucke L. Science. 2006;314:781–784. doi: 10.1126/science.1132813. [DOI] [PMC free article] [PubMed] [Google Scholar]
- 3.Selkoe DJ. Neuron. 1991;6:487–498. doi: 10.1016/0896-6273(91)90052-2. [DOI] [PubMed] [Google Scholar]
- 4.Haass C, Schlossmacher MG, Hung AY, Vigo-Pelfrey C, Mellon A, Ostaszewski BL, Lieberburg I, Koo EH, Schenk D, Teplow DB, et al. Nature. 1992;359:322–325. doi: 10.1038/359322a0. [DOI] [PubMed] [Google Scholar]
- 5.Skovronsky DM, Lee VM, Trojanowski JQ. Annu Rev Pathol. 2006;1:151–170. doi: 10.1146/annurev.pathol.1.110304.100113. [DOI] [PubMed] [Google Scholar]
- 6.Bokvist M, Lindstrom F, Watts A, Grobner G. J Mol Biol. 2004;335:1039–1049. doi: 10.1016/j.jmb.2003.11.046. [DOI] [PubMed] [Google Scholar]
- 7.Ji SR, Wu Y, Sui SF. J Biol Chem. 2002;277:6273–6279. doi: 10.1074/jbc.M104146200. [DOI] [PubMed] [Google Scholar]
- 8.Terzi E, Holzemann G, Seelig J. J Mol Biol. 1995;252:633–642. doi: 10.1006/jmbi.1995.0525. [DOI] [PubMed] [Google Scholar]
- 9.Hardy JA, Higgins GA. Science. 1992;256:184–185. doi: 10.1126/science.1566067. [DOI] [PubMed] [Google Scholar]
- 10.Kremer JJ, Pallitto MM, Sklansky DJ, Murphy RM. Biochemistry. 2000;39:10309–10318. doi: 10.1021/bi0001980. [DOI] [PubMed] [Google Scholar]
- 11.Coles M, Bicknell W, Watson AA, Fairlie DP, Craik DJ. Proc Natl Acad Sci U S A. 1998;37:11064–11077. doi: 10.1021/bi972979f. [DOI] [PubMed] [Google Scholar]
- 12.Luhrs T, Ritter C, Adrian M, Riek-Loher D, Bohrmann B, Dobeli H, Schubert D, Riek R. Proc Natl Acad Sci U S A. 2005;102:17342–17347. doi: 10.1073/pnas.0506723102. [DOI] [PMC free article] [PubMed] [Google Scholar]
- 13.Niemela PS, Hyvonen MT, Vattulainen I. Biochim Biophys Acta. 2009;1788:122–135. doi: 10.1016/j.bbamem.2008.08.018. [DOI] [PubMed] [Google Scholar]
- 14.Niemela PS, Ollila S, Hyvonen MT, Karttunen M, Vattulainen I. PLoS Comput Biol. 2007;3:304–312. doi: 10.1371/journal.pcbi.0030034. [DOI] [PMC free article] [PubMed] [Google Scholar]
- 15.Somerharju P, Virtanen JA, Cheng KH, Hermansson M. Biochim Biophys Acta. 2009;1788:12–23. doi: 10.1016/j.bbamem.2008.10.004. [DOI] [PubMed] [Google Scholar]
- 16.Khelashvili G, Pabst G, Harries D. J Phys Chem B. 2010;114:7524–7534. doi: 10.1021/jp101889k. [DOI] [PMC free article] [PubMed] [Google Scholar]
- 17.Khelashvili G, Mondal S, Andersen OS, Weinstein H. J Phys Chem B. 2010;114:12046–12057. doi: 10.1021/jp106373r. [DOI] [PMC free article] [PubMed] [Google Scholar]
- 18.Davis CH, Berkowitz ML. J Phys Chem B. 2009;113:14480–14486. doi: 10.1021/jp905889z. [DOI] [PubMed] [Google Scholar]
- 19.Davis CH, Berkowitz ML. Biophys J. 2009;96:785–797. doi: 10.1016/j.bpj.2008.09.053. [DOI] [PMC free article] [PubMed] [Google Scholar]
- 20.Davis CH, Berkowitz ML. Proteins. 2010;78:2533–2545. doi: 10.1002/prot.22763. [DOI] [PMC free article] [PubMed] [Google Scholar]
- 21.Devanathan S, Salamon Z, Lindblom G, Grobner G, Tollin G. FEBS J. 2006;273:1389–1402. doi: 10.1111/j.1742-4658.2006.05162.x. [DOI] [PubMed] [Google Scholar]
- 22.Lemkul JA, Bevan DR. Arch Biochem Biophys. 2008;470:54–63. doi: 10.1016/j.abb.2007.11.004. [DOI] [PubMed] [Google Scholar]
- 23.Lemkul JA, Bevan DR. Febs J. 2009;276:3060–3075. doi: 10.1111/j.1742-4658.2009.07024.x. [DOI] [PubMed] [Google Scholar]
- 24.Lemkul JA, Bevan DR. Biochemistry. 2010;49:3935–3946. doi: 10.1021/bi1000855. [DOI] [PubMed] [Google Scholar]
- 25.Lemkul JA, Bevan DR. J Phys Chem B. 2010;114:1652–1660. doi: 10.1021/jp9110794. [DOI] [PubMed] [Google Scholar]
- 26.Xu Y, Shen J, Luo X, Zhu W, Chen K, Ma J, Jiang H. Proc Natl Acad Sci U S A. 2005;102:5403–5407. doi: 10.1073/pnas.0501218102. [DOI] [PMC free article] [PubMed] [Google Scholar]
- 27.Anderson RG, Jacobson K. Science. 2002;296:1821–1825. doi: 10.1126/science.1068886. [DOI] [PubMed] [Google Scholar]
- 28.Gallegos AM, Storey SM, Kier AB, Schroeder F, Ball JM. Biochemistry. 2006;45:12100–12116. doi: 10.1021/bi0602720. [DOI] [PubMed] [Google Scholar]
- 29.Puglielli L, Friedlich AL, Setchell KD, Nagano S, Opazo C, Cherny RA, Barnham KJ, Wade JD, Melov S, Kovacs DM, Bush AI. J Clin Invest. 2005;115:2556–2563. doi: 10.1172/JCI23610. [DOI] [PMC free article] [PubMed] [Google Scholar]
- 30.Simons K, Ikonen E. Science. 2000;290:1721–1726. doi: 10.1126/science.290.5497.1721. [DOI] [PubMed] [Google Scholar]
- 31.Wang MM, Olsher M, Sugar IP, Chong PL. Biochemistry. 2004;43:2159–2166. doi: 10.1021/bi035982+. [DOI] [PubMed] [Google Scholar]
- 32.Pan J, Tristram-Nagle S, Nagle JF. Phys Rev E. 2009;80:021931. doi: 10.1103/PhysRevE.80.021931. [DOI] [PMC free article] [PubMed] [Google Scholar]
- 33.Tristram-Nagle S, Chan R, Kooijman E, Uppamoochikkal P, Qiang W, Weliky DP, Nagle JF. J Mol Biol. 402:139–153. doi: 10.1016/j.jmb.2010.07.026. [DOI] [PMC free article] [PubMed] [Google Scholar]
- 34.Zhu Q, Cheng KH, Vaughn MW. J Phys Chem B. 2007;111:11021–11031. doi: 10.1021/jp070487z. [DOI] [PubMed] [Google Scholar]
- 35.Bekker H, Berendsen HJC, Dijkstra EJ, Achterop S, van Drunen R, van der Spoel D, Sijbers A, Keegstra H, Reitsma B, Renardus MKR. Physics Computing. Vol. 92. World Scientific; Singapore: 1993. Gromacs: A Parallel Computer for Molecular Dynamics Simulations. [Google Scholar]
- 36.Berendsen HD, van der Spoel D, van Drunen R. Comp Phys Comm. 1995;91:43–56. [Google Scholar]
- 37.Lindahl E, Hess B, van der Spoel D. J Mol Mod. 7:306–317. [Google Scholar]
- 38.Van Der Spoel D, Lindahl E, Hess B, Groenhof G, Mark AE, Berendsen HJ. J Comput Chem. 2005;26:1701–1718. doi: 10.1002/jcc.20291. [DOI] [PubMed] [Google Scholar]
- 39.Holtje M, Forster T, Brandt B, Engels T, von Rybinski W, Holtje HD. Biochim Biophys Acta. 2001;1511:156–167. doi: 10.1016/s0005-2736(01)00270-x. [DOI] [PubMed] [Google Scholar]
- 40.Berendsen HJC, Postma JPM, van Gunsteren WF, Hermans J. Interaction Models for Water in Relation to Protein Hydration. In: Pullman B, editor. Intermolecular Forces. Reidel; Dordrecht, The Netherlands: 1981. pp. 331–342. [Google Scholar]
- 41.Hess B, Bekke H, Berendsen HJC, Fraaije JGEM. J Comp Chem. 1997;13:952–962. [Google Scholar]
- 42.van der Spoel D, Lindahl E, Hess B, van Buuren AR, Apol E, Meulenhoff PJ, Tieleman DP, Sijbers ALTM, Feenstra KA, van Drunen R, Berendsen HJC. Gromacs User Manual version 40. 2005 www.gromacs.org.
- 43.Darden T, York D, Pedersen L. J Chem Phys. 1993;98:10089–10092. [Google Scholar]
- 44.Essmann U, Perera L, Berkowitz ML, Darden T, Lee H, Pedersen L. J Chem Phys. 1995;103:8577–8593. [Google Scholar]
- 45.Hockney RW, Goel SP, Eastwood JW. J Comput Phys. 1974;14:148–158. [Google Scholar]
- 46.Bussi G, Donadio D, Parrinello M. J Chem Phys. 2007;126:014101. doi: 10.1063/1.2408420. [DOI] [PubMed] [Google Scholar]
- 47.Hess B, Kutzner C, van der Spoel D, Lindahl E. J Chem Theory Comput. 2008:435–447. doi: 10.1021/ct700301q. [DOI] [PubMed] [Google Scholar]
- 48.Berendsen HJC, Postma JPM, van Gunsteren WF, DiNola A, Haak JR. J Chem Phys. 1984;81:3684–3690. [Google Scholar]
- 49.Lee AG. Biochim Biophys Acta. 2003;1612:1–40. doi: 10.1016/s0005-2736(03)00056-7. [DOI] [PubMed] [Google Scholar]
- 50.Warren GB, Houslay MD, Metcalfe JC, Birdsall NJ. Nature. 1975;255:684–687. doi: 10.1038/255684a0. [DOI] [PubMed] [Google Scholar]
- 51.Hofsäß C, Lindahl E, Edholm O. Biophys J. 2003;84:2192–2206. doi: 10.1016/S0006-3495(03)75025-5. [DOI] [PMC free article] [PubMed] [Google Scholar]
- 52.Fishman GS. Monte Carlo: Concepts, Algorithms, and Applications. Springer-Verlag; New York: 1997. [Google Scholar]
- 53.Alwarawrah M, Dai J, Huang J. J Phys Chem B. 2010;114:7516–7523. doi: 10.1021/jp101415g. [DOI] [PMC free article] [PubMed] [Google Scholar]
- 54.Center for Molecular and Biomolecular Bioinformatics homepage. [accessed may 2009]; http://www.cmbi.ru.nl. updated CMBI version by ElmK, April 1, 2000.
- 55.Kabsch W, Sander C. Biopolymers. 1983;22:2577–2637. doi: 10.1002/bip.360221211. [DOI] [PubMed] [Google Scholar]
- 56.Kraulis PJ. J Appl Cryst. 1991;24:946–950. [Google Scholar]
- 57.Merritt EA, Bacon DJ. Meth Enzymol. 1997;277:505–524. doi: 10.1016/s0076-6879(97)77028-9. [DOI] [PubMed] [Google Scholar]
- 58.Humphrey W, Dalke A, Schulten K. J Molec Graphics. 1996;14:33–38. doi: 10.1016/0263-7855(96)00018-5. [DOI] [PubMed] [Google Scholar]
- 59.Simons K, Ehehalt R. J Clin Invest. 2002;110:597–603. doi: 10.1172/JCI16390. [DOI] [PMC free article] [PubMed] [Google Scholar]
- 60.Jaud S, Fernandez-Vidal M, Nilsson I, Meindl-Beinker Hubner NC, Tobias DJ, von Heijne G, White SH. Proc Natl Acad Sci U S A. 2009;106:11588–11593. doi: 10.1073/pnas.0900638106. [DOI] [PMC free article] [PubMed] [Google Scholar]
- 61.Strandberg E, Killian JA. FEBS Lett. 2003;544:69–73. doi: 10.1016/s0014-5793(03)00475-7. [DOI] [PubMed] [Google Scholar]
Associated Data
This section collects any data citations, data availability statements, or supplementary materials included in this article.