Abstract
Fluoromodules are complexes formed upon the noncovalent binding of a fluorogenic dye to its cognate biomolecular partner, which significantly enhances the fluorescence quantum yield of the dye. Previously, several single-chain, variable fragment (scFv) antibodies were selected from a yeast cell surface-displayed library that activated fluorescence from a family of unsymmetrical cyanine dyes covering much of the visible and near-IR spectrum. The current work expands our repertoire of genetically encodable scFv-dye pairs by selecting and characterizing a group of scFvs that activate fluorogenic blue-absorbing, blue-fluorescing cyanine dyes, based on oxazole and thiazole heterocycles. The dye binds to both yeast cell surface-displayed and soluble scFvs with low nanomolar Kd values. These dye-protein fluoromodules exhibit high quantum yields, approaching unity for the brightest system. The promiscuity of these scFvs with other fluorogenic cyanine dyes was also examined. Fluorescence microscopy demonstrates that the yeast cell surface-displayed scFvs can be used for multicolor imaging. The prevalence of 405 nm lasers on confocal imaging and flow cytometry systems make these new reagents potentially valuable for cell biological studies.
INTRODUCTION
The development of genetically encodable fluorescent protein tags has transformed the field of cellular imaging.1 Green fluorescent protein (GFP)2,3 is a prominent example, and can be attached as a fusion tag and used to track a protein of interest in vivo.4–7 Although GFP and its derivatives have become standard cellular imaging tools, it can be problematic to precisely tune properties such as fluorescence color and brightness because the chromophore is covalently embedded within the protein. Our Center has recently created a class of novel fluorophores using single-chain variable fragment (scFv) antibodies and fluorogenic dyes.8 These dye-protein pairs are called fluoromodules, in which the fluorescence-activating protein (FAP) binds noncovalently to a target fluorogenic dye. In a conformationally unconstrained environment, such as fluid solution, the dye loses energy through torsional movement around a conjugated methine bridge and is nonfluorescent. However, in a constrained environment such as an scFv’s binding pocket, torsional movement of the dye is restricted, resulting in significant fluorescent enhancement.9,10 The FAP scFvs can be genetically encoded and fused to a protein of interest to be used in a manner similar to GFP. When a fluorogenic dye accesses the site where the FAP is expressed, the dye is bound by the FAP and fluorescence is observed. Unlike GFP, the timing of the fluorescence signal can be controlled based on when the dye is added to the FAP. The fluorescent signal of the fluoromodule can also be restored after photobleaching by simply adding fresh dye to exchange out the bleached dye,11 something which is not possible when the chromophore is covalently integrated within the protein.7
Our fluoromodule systems are readily fine-tuned by rationally designing new fluorogenic dyes with the desired wavelength and photostability properties. If new dyes do not bind to existing FAPs obtained from prior selections, new FAPs that activate these dyes are selected using a yeast surface-displayed scFv library.12 One of our Center’s goals is to develop fluoromodules covering the entire visible and near-IR spectrum, allowing for multicolor labeling at any desired absorption/emission wavelengths. Previous work resulted in the selection and characterization of FAPs that bind to and activate the dyes thiazole orange, malachite green, and dimethylindole red (DIR).8,11,13–15 Although most scFvs exhibited high specificity and selectivity for only their target dye, one DIR-binding scFv was capable of activating a family of unsymmetrical cyanine dyes spanning most of the visible and near-IR spectrum with low nanomolar dissociation constants (Kd).13 However, the promiscuous scFv bound much weaker to a violet-absorbing dye. Our goal in the current study was to create a new family of blue fluoromodules with low nanomolar Kds and high quantum yields (ϕf).
RESULTS
Rationale
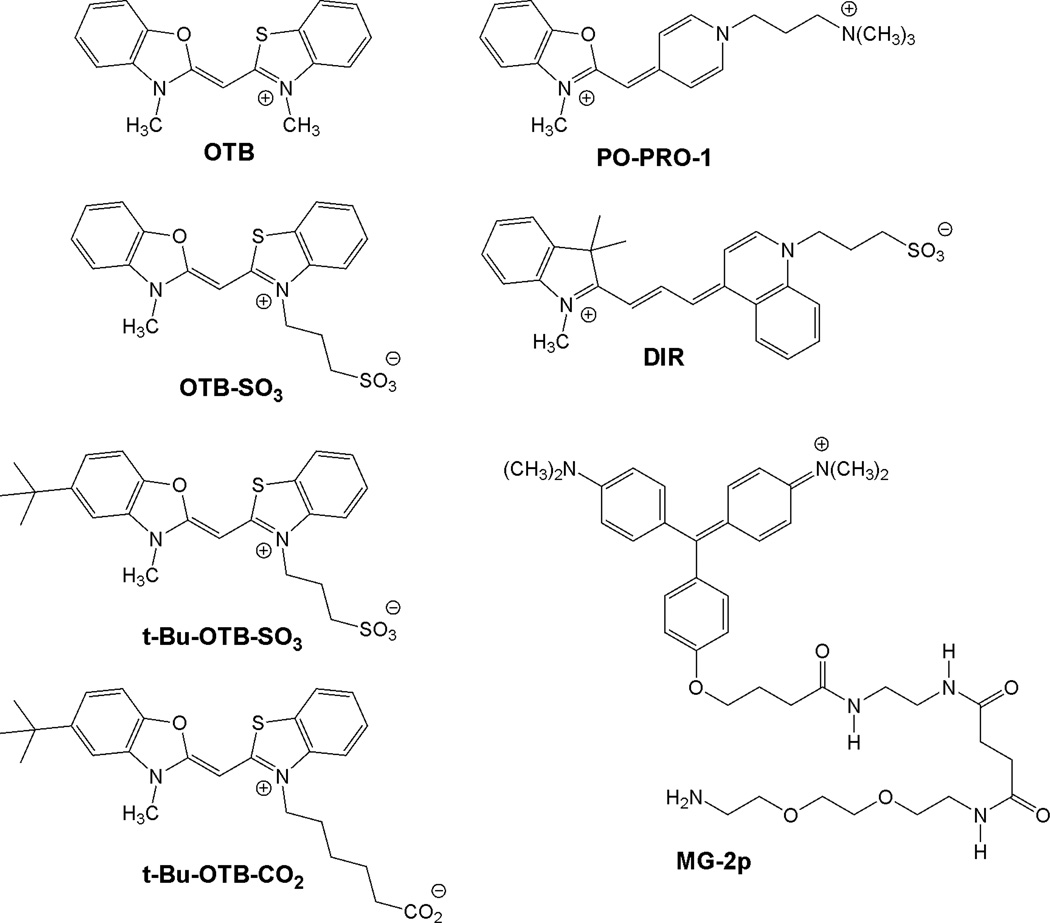
The structures of the fluorogenic dyes used in these studies are given in Chart 1. Previously, our group reported a promiscuous scFv capable of activating a variety of structurally similar unsymmetrical cyanine dyes spanning much of the visible spectrum.13 Dyes containing various heterocycles and conjugated methine bridge lengths were activated by the promiscuous FAP with low nanomolar Kds. However, the blue dye studied, PO-PRO-1, had a significantly higher dissociation constant of 712 nM with the yeast cell surface-displayed FAP. PO-PRO-1 was also structurally dissimilar from the other dyes in that it had a pyridinium heterocycle in place of the normal quinolinium; this may have altered pi-stacking, van der Waals attractions, and/or hydrophobic interactions that help to stabilize the complexes formed with the higher affinity dyes.
Chart 1.
Fluorogenic dye structures.
Because the Kd of PO-PRO-1 and the promiscuous scFv was significantly higher than desired, we decided to create an entirely new blue fluoromodule with higher affinity. PO-PRO-1 is not ideal for intracellular use because it can intercalate into DNA,16,17 leading to significant background fluorescence as shown in the Supplemental Information. Instead of using PO-PRO-1 as our target dye, we synthesized a variant of the blue dye Cyan47.18 We chose to rechristen Cyan47 with the more descriptive name of oxazole thiazole blue (OTB). The new dye used for our fluoromodules, OTB-SO3, differs from the original OTB by the addition of a sulfonate group, which was introduced to reduce the nonspecific binding to DNA reported previously for OTB.18 A similar strategy was used by our group to inhibit DNA binding by DIR.19
Synthesis and Characterization of OTB-SO3
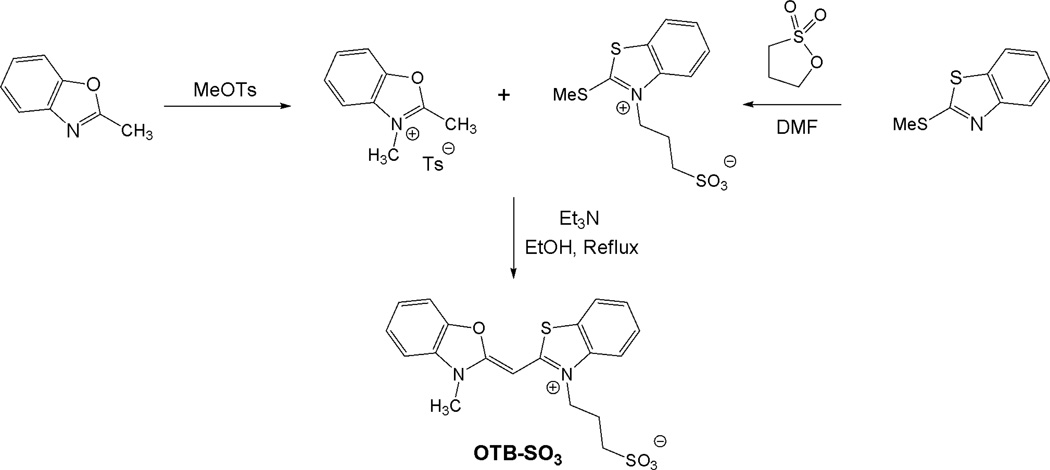
The sulfonated version of OTB was synthesized as shown in Scheme 1. Briefly, 2-methylbenzoxazole and 2-(methylthio)-1,3-benzothiazole were alkylated with methyltosylate and propanesultone, respectively. The two half-dyes were then condensed in the presence of triethylamine to give the dye. (Full experimental details are provided in the Supplemental Information.)
Scheme 1.
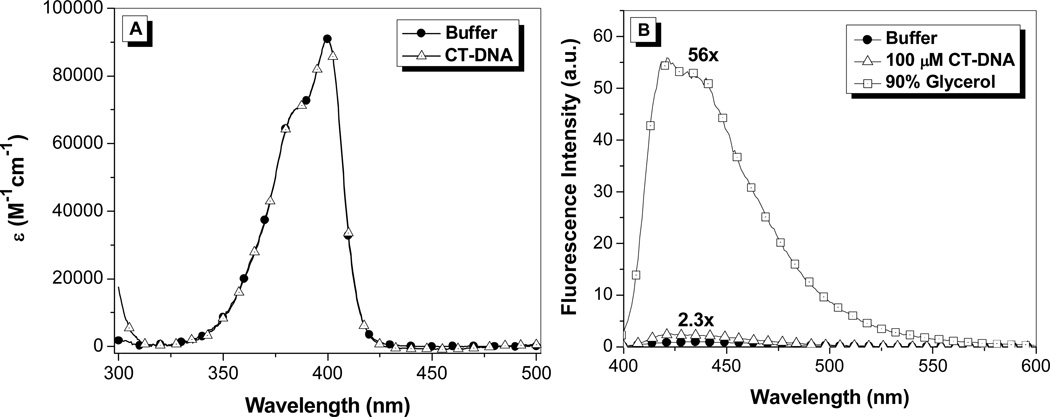
The absorption and fluorescence emission spectra of OTB-SO3 are given in Figure 1. The absorption spectrum features a maximum at 400 nm (ε = 44,000 M−1cm−1)18 and a vibronic shoulder at 385 nm. The dye’s absorption properties are unchanged upon the addition of 100 µM calf thymus DNA to buffer. Meanwhile, OTB-SO3 exhibits low fluorescence in buffer and only a 2.3-fold enhancement in the presence of DNA. However, fluorescence is enhanced 56-fold in 90% glycerol solution, demonstrating the fluorogenic potential of this unsymmetrical cyanine dye.
Figure 1.
A. UV-vis spectra of OTB-SO3 in 10 mM sodium phosphate buffer, 100 mM NaCl (pH 7) and in the presence of 100 µM calf thymus DNA. B. Fluorescence spectra of OTB-SO3 in 10 mM sodium phosphate buffer (pH 7) with 100 mM NaCl (solid circles), in the presence of 100 µM base pairs calf thymus DNA (triangles) or in 90% glycerol (squares). Samples were excited at 380 nm.
Both PO-PRO-1 and OTB are also fluorogenic, but their fluorescence is activated by DNA as well as glycerol (Supplemental Information). The much lower fluorescence activation of OTB-SO3 by DNA is presumably due to the dye’s negatively charged sulfonate group repelling the phosphate backbone. By preventing interactions with endogenous DNA, the background fluorescence of the dye should be significantly reduced in an intracellular environment, which is an important property for future applications of fluoromodules based on this dye.
FAP Selection
The naïve yeast surface-display library used to select the protein components of our OTB-SO3 fluoromodules consisted of ca. 8 × 10⁸ recombinant human scFvs and was developed by Dane Wittrup of MIT.12,20 These non-immune scFvs were made from cDNA and are representative of a naïve germline repertoire. The scFvs are encoded in the pPNL6 plasmid and expressed as fusion proteins to the yeast cell surface protein Aga2p. Each two-domain scFv is ca. 250 amino acids long and consists of a heavy and light chain joined together by an artificial (SerGly4)3 linker.
The binding of OTB-SO3 to one or more of these yeast surface-displayed scFvs should result in enhanced blue fluorescence, which can be monitored via flow cytometry. The library was mixed with OTB-SO3 and sorted using Fluorescence-Activated Cell Sorting (FACS) to select those cells having the brightest blue fluorescence and FAP expression levels (ca. top 2% of the population). For the initial round of flow cytometry, ca. 2.4 × 10⁸ cells, which covers approximately a quarter of the original library’s diversity, were sorted after a half hour incubation with 1 µM OTB-SO3. The selected cells were taken through four additional rounds of FACS sorting in the presence of OTB-SO3. Individual cells were then sorted onto an agar induction plate.21 Data from each round of sorting are provided in the Supplemental Information. The twelve brightest clones were selected for further analysis. Sequencing results showed that 7 of these clones were unique. Preliminary analysis showed that one of the clones had a comparatively large Kd (>1 µM), so this clone was discarded. The other 6 clones were analyzed in detail; their light and heavy chain sequences are provided in the Supplemental Information. Little homology was present among the FAP’s complementarity determining regions.
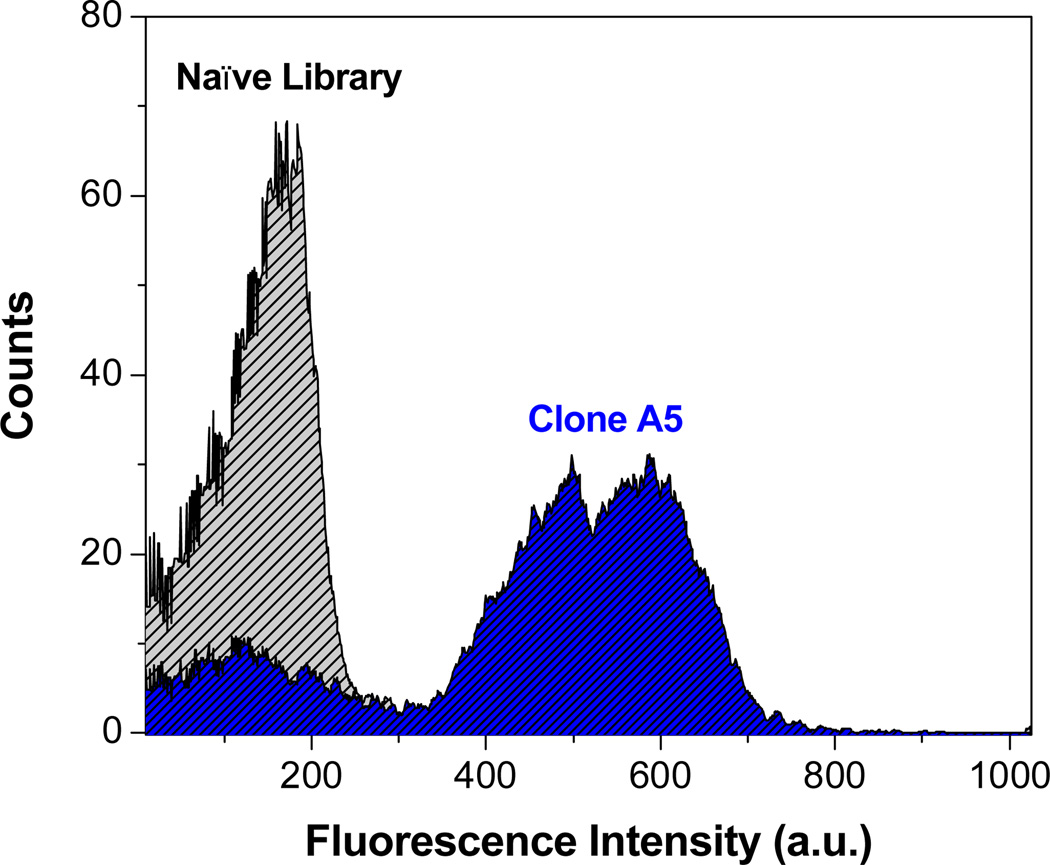
Figure 2 depicts flow cytometry histograms of blue fluorescence signal of the unsorted naïve yeast library and clone A5. In the unsorted library, very little blue signal is seen. In contrast, for clone A5, the average blue fluorescence is greatly enhanced, indicating that yeast expressing this protein on their surface significantly activate OTB-SO3. A similar trend was seen for the other five yeast surface-displayed OTB-SO3-binding clones (data not shown).
Figure 2.
Flow cytometry histograms of blue fluorescence emission of the unsorted naïve yeast library (gray) and clone A5 (blue) in the presence of 1 µM OTB-SO3. Samples were excited with a 405 nm laser.
Fluoromodule Characterization
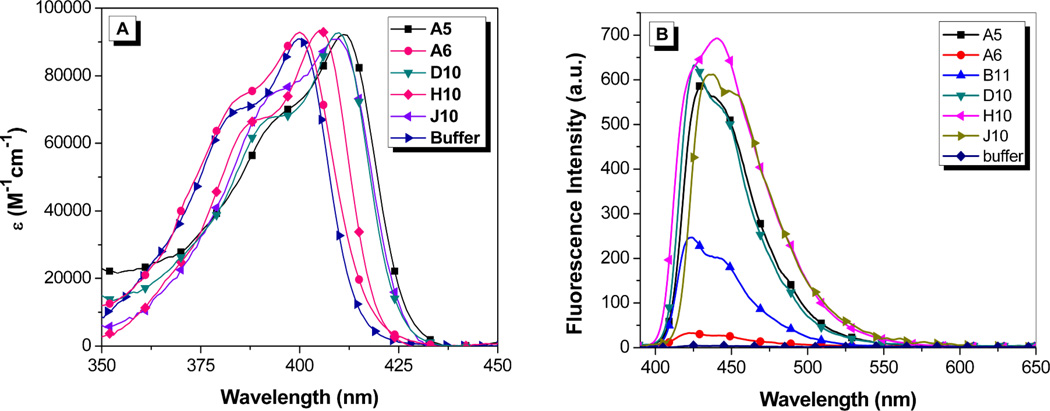
The clones were put into a protein expression vector and soluble hexahistidine-tagged versions of the FAPs were purified on a Ni2+ column following standard protocols.12 Absorption and fluorescence spectra for OTB-SO3 with soluble scFvs are shown in Figure 3. The binding of the clones to OTB-SO3 causes up to an 11 nm red-shift in the maximum absorbance wavelength relative to dye in buffer. A similar trend is seen in the fluorescence emission spectra of the OTB-FAP complexes, with the emission maxima ranging from 422 nm with clone A6 to 440 nm with clone H10.
Figure 3.
(A) Absorption spectra of 1.6 µM OTB-SO3 and 3.2 µM soluble scFv. The absorption spectrum for B11 is not shown to reduce the complexity of the figure; the profile is very similar to that of the dye in buffer. (B) Fluorescence spectra of 2.25 µM OTB-SO3 + 4.5 µM soluble scFv. Spectra were corrected for differences in absorbance at the excitation wavelength (370 nm).
The emission profile for OTB-SO3 with H10 differs from the other fluoromodules. In the case of H10, a shoulder is observed on the short wavelength side of the main emission band, whereas the shoulder appears on the long wavelength side of the peak for the other fluoromodules as well as for OTB-SO3 in glycerol. The variation in the relative intensities of these two bands could reflect differences in the rigidity and/or conformation of the dye when bound to the proteins, suggesting that the spectral profiles might be temperature dependent. However, the fluorescence spectrum of the OTB-SO3/H10 complex exhibited minimal change in the range of 10–45 °C, where the protein begins to denature (Supporting Information). In separate experiments, excitation spectra recorded while monitoring emission at 425 nm and 450 nm yielded identical profiles, indicating that a single emitting species is present (data not shown).
We also examined the pH dependence of the OTB-SO3/H10 fluorescence (Supporting Information). The fluorescence intensity exhibits considerable variation, with 3–4-fold enhancements (relative to free dye) at acidic pH, compared with 15–20-fold enhancements at neutral and alkaline pH.
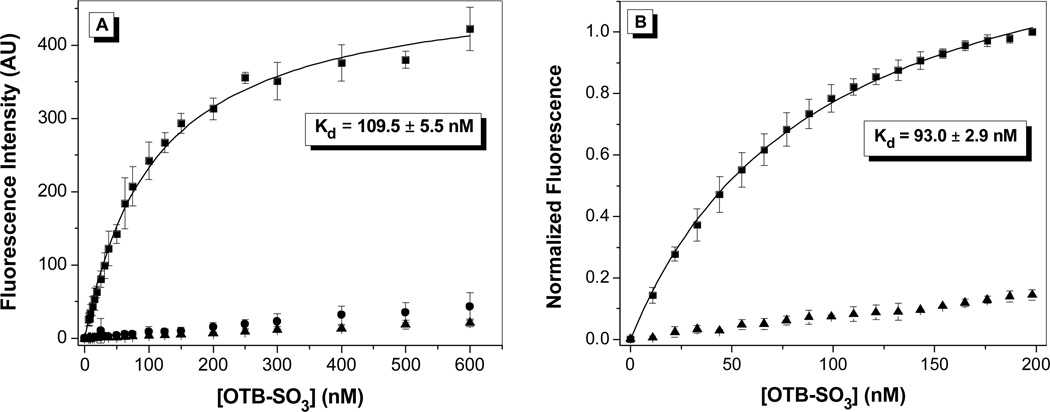
Dissociation constants were determined for OTB-SO3 by fluorescence titration in the presence of either the yeast surface-displayed or soluble FAPs. Dye was titrated into either 107 cells or 50 nM soluble protein; representative binding curves for clone A5 are shown in Figure 4 with results for other clones are provided in the Supporting Information. Control experiments were also run where dye was titrated into either buffer or into yeast cells where expression of the scFv-containing plasmid was not induced. Minimal fluorescence signal was seen for both controls, demonstrating that little intrinsic background fluorescence or nonspecific binding to the yeast cell surface is present. All Kd values were relatively low at <200 nM (Table 1). The Kds for OTB-SO3 with the soluble proteins were slightly lower than for the cell surface-displayed versions. This may be due to partial blockage of the dye binding site by the cell surface environment, misfolding of the protein on the cell surface, or a small amount of nonspecific binding of the dye to the cell surface.
Figure 4.
Fluorescence titration of OTB-SO3 into (A) yeast surface-displayed A5 or (B) soluble A5. Samples were fit to a one-site binding equation. For A, dye was titrated into 107 cells expressing scFvs (squares), cells not expressing scFvs (circles), or buffer (triangles). Samples were excited at 401 nm. For B, dye was titrated into 50 nM protein (squares) or buffer (triangles), and samples were excited at 380 nm and normalized to the fluorescence maximum.
Table 1.
Absorbance and fluorescence emission maxima, equilibrium dissociation constants (Kd) with scFvs either expressed on the yeast cell surface or in solution, fluorescence enhancement, and fluorescence quantum yields (Φf) for the dyes bound to soluble scFv. (Fluorescence enhancement values were calculated for soluble protein relative to the dye in buffer and were not corrected for differences in absorbance.)
| scFv + OTB-SO3 |
Abs λmax (nm) |
Em λmax (nm) |
Yeast surface Kd (nM) |
Protein Kd (nM) |
Fluor. Enhance. |
Φf |
|---|---|---|---|---|---|---|
| A5 | 411 | 431 | 109.5 ± 5.5 | 93.0 ± 2.9 | 52.6 | 0.841 |
| A6 | 400 | 422 | 6.9 ± 1.4 | 9.4 ± 0.5 | 9.73 | 0.047 |
| B11 | 400 | 424 | 13.0 ± 0.8 | 7.7 ± 0.3 | 20.2 | 0.353 |
| D10 | 410 | 426 | 12.3 ± 0.7 | 12.9 ± 0.8 | 49.2 | 0.904 |
| H10 | 405 | 440 | 119.0 ± 6.5 | 72.4 ± 4.1 | 54.5 | 1.00 |
| J10 | 410 | 435 | 166.9 ± 4.2 | 63.3 ± 2.0 | 50.7 | 0.877 |
| scFv + t-butyl-OTB-SO3 | ||||||
| A5 | 413 | 434 | 42.3 ± 1.4 | 61.5 ± 3.1 | 36.6 | 0.827 |
| scFv + t-butyl-OTB-CO2 | ||||||
| A5 | 413 | 437 | 39.4 ± 1.5 | 31.2 ± 1.8 | 40.0 | 0.605 |
| scFv + DIR | ||||||
| J10 | 625 | 650 | 24.4 ± 1.6 | 21.2 ± 1.0 | 8.2 | 0.257 |
Quantum yield values were also determined for OTB-SO3 with an excess of soluble protein at concentrations much higher than their Kd values (Table 1). A wide range of quantum yields was observed, with four of the OTB-SO3 fluoromodules having ϕf > 0.8, which is significantly higher than was observed for our previously reported fluoromodules.8,11,13 All FAP-dye pairs had quantum yields substantially higher than those of the dye in buffer or in the presence of 100 µM calf thymus DNA (data not shown). Clone H10 was especially notable for its very high quantum yield of ~1.00, which was verified multiple times and measured against two different standards (quinine sulfate and 9,10-diphenylanthracene). Interestingly, there is little correlation between affinity and quantum yield. For example, FAPs A6 and D10 bind to OTB-SO3 with similar Kd values (9.4 and 12.9 nM, respectively) but their ϕf values differ by nearly 20-fold (0.047 vs 0.904).
Promiscuity
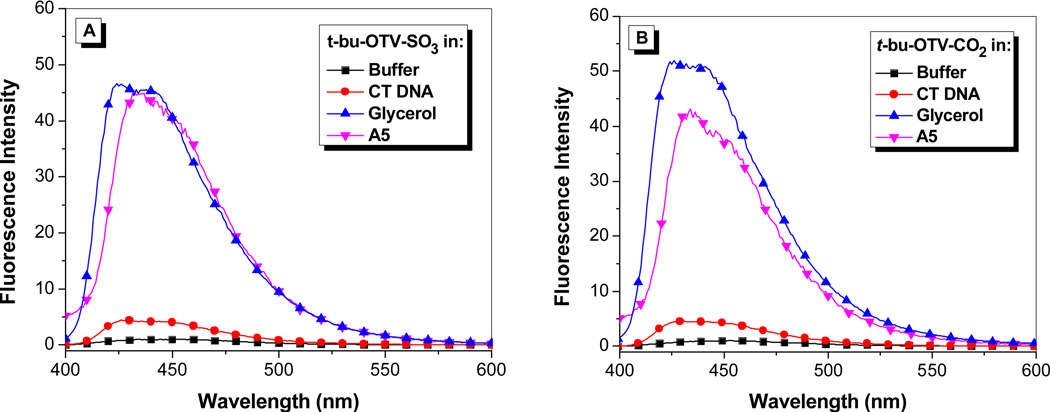
Our previous work with the DIR-binding FAP K7 demonstrated a high degree of promiscuity in that the protein was able to bind a wide range of cyanine dyes, giving rise to a “rainbow” of fluoromodules.11,13 We performed similar studies with the OTB-SO3-binding scFvs selected in this study. This included experiments with the other OTB dyes shown in Chart 1: t-butyl-OTB-SO3 and t-butyl-OTB-CO2 both have a t-butyl group attached to position 5 on the benzoxazole heterocycle. (Synthesis and characterization of these dyes are described in Supplemental Information.) This substituent was added to the ring in order to suppress intercalation of the dye into DNA. However, fluorescence spectra shown in Figure 5 indicate that these dyes actually exhibit slightly greater DNA binding based on the larger fluorescence enhancement compared with OTB-SO3 (Figure 1).
Figure 5.
Fluorescence enhancement of samples excited at 380 nm relative to dye in buffer of (A) t-butyl-OTB-SO3 and (B) t-butyl-OTB-CO2 in 10 mM sodium phosphate buffer, 100 mM NaCl (pH 7), in the presence of 100 µM calf thymus DNA, in 90% glycerol, and with A5 protein. Spectra were corrected for differences in absorbance at the excitation wavelength.
The addition of the t-butyl group does not significantly affect the absorbance and fluorescence maxima relative to OTB-SO3. Only one of the six scFvs, A5, was able to fluorogenically activate all three OTB variants. The other proteins showed no ability to bind to the t-butyl-modified dyes. A5 bound with 1.5 and 3-fold lower Kd values to t-butyl-OTB-SO3 and t-butyl-OTB-CO2 respectively, compared to OTB-SO3. This suggests that A5, unlike the other scFvs, has extra room in its binding pocket that allows the protein to accommodate the bulky t-butyl group. It is also possible that the OTB dyes are bound to A5 in a different orientation compared with the other FAPs. High-resolution structural information would provide more information on the shape complementarity of these protein-dye complexes. High ϕf values were observed for all three modified OTB dyes bound to soluble A5 (Table 1).
The ability of these scFvs to activate the parent unmodified OTB was also studied. All 6 soluble FAPs were able to bind to OTB with a 10-fold to 45-fold fluorescence enhancement relative to dye in buffer (Supporting Information). This indicates that the alkyl sulfonate substituent on OTB-SO3 is not essential for binding. However, unmodified OTB readily interacts with double-stranded DNA,18 which would result in a high background if used as an intracellular label or sensor. Because of this, the modified OTB dyes are better candidates for further fluoromodule development.
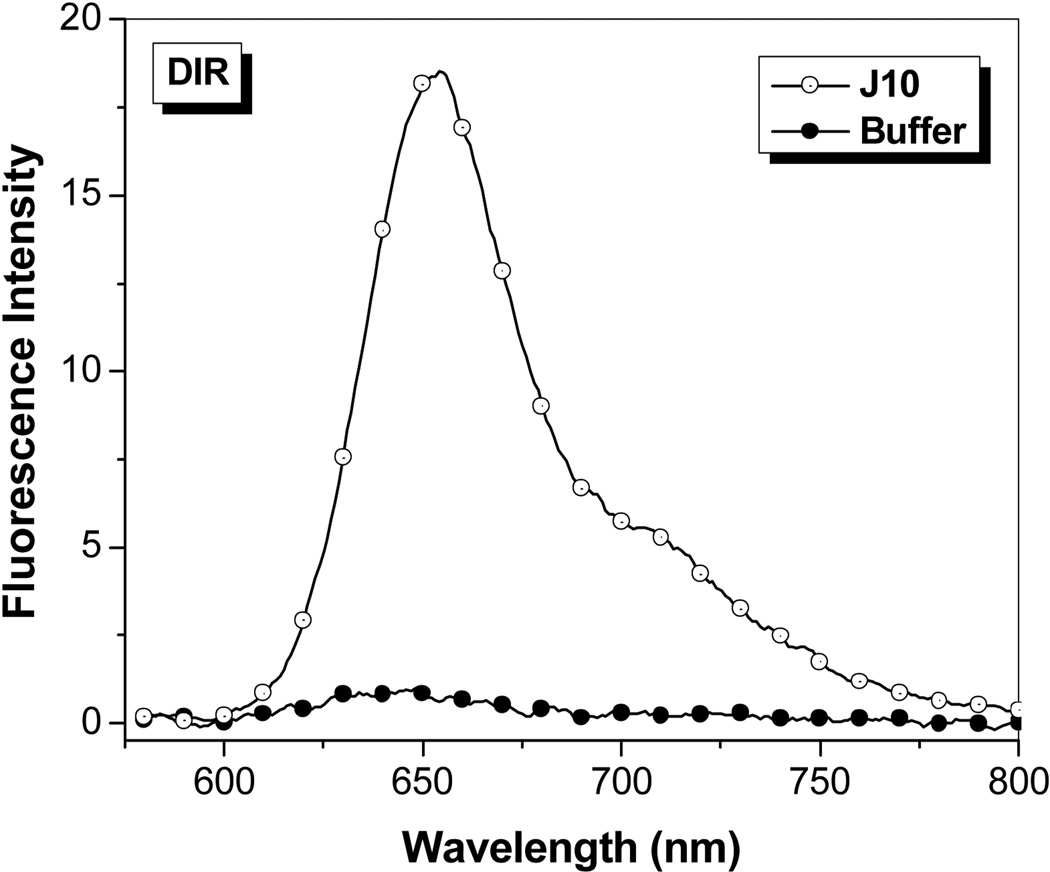
The promiscuity of A5 with the t-butyl-OTB dyes led us to test whether any of the OTB-binding proteins were capable of activating DIR. Unlike the OTB dyes, DIR has a bulky dimethylindole heterocycle and a 3-carbon methine bridge. In spite of these substantial changes in dye structure, FAP J10 still fluorogenically activates DIR (Figure 6; absorption spectra are given in Supplemental Information). Surprisingly, soluble J10 bound DIR 3-fold better than OTB-SO3. The ϕf of DIR bound to soluble J10 was found to be 0.257, which is comparable to the ϕf previously determined for an scFv intentionally selected to bind DIR (ϕf = 0.33).13
Figure 6.
Fluorescent enhancement of samples excited at 570 nm containing 750 nM DIR in the presence of 1.5 µM J10 FAP relative to fluorescence of the dye in buffer. Spectra were corrected for differences in absorbance at the excitation wavelength
Fluorescence Microscopy
Figure 7 shows confocal microscopy images of yeast surface-expressed J10 in the presence of 200 nM OTB-SO3 and DIR. Merged fluorescence and differential contrast images of these samples are provided in the supplemental information. The same cells are labeled with both dyes, indicating that this single FAP can activate fluorogenic dyes at both ends of the visible spectrum. J10’s sequence was unique compared to all of the FAPs previously selected for DIR,13 even though the same naïve library was used at the start of prior DIR selections. This further illustrates the diversity of the unsorted original library and suggests that repeating the selection process could yield additional new FAPs that activate a given target dye.
Figure 7.
J10 cells imaged with 200 nM OTB-SO3 (left) and DIR (center), along with the overlaid images (right). Cells were not washed before imaging. Samples were excited at 405 nm (OTB-SO3) and 561 nm (DIR).
In contrast to the promiscuous binding of J10, we used a previously developed dye-FAP pair (H6-MG, which activates the red-emitting dye malachite green)8 and the newly selected H10 scFv to demonstrate the possibility of orthogonal multicolor imaging. Figure 8 shows the mixture of H6-MG and H10 surface-displayed scFvs in the presence of MG-2p and OTB-SO3. Not only is there negligible crossover, but little background fluorescence is seen even without washing the unbound dye prior to imaging, once again demonstrating the value of using fluorogenic dyes. 8,11,13
Figure 8.
H10 and H6-MG yeast cells with 200 nM OTB-SO3 and MG-2p. Cells were not washed prior to imaging. Samples were excited at 405 nm (OTB-SO3) and 633 nm (MG-2p).
DISCUSSION
Our dye-scFv fluoromodules provide a new technology for multicolor fluorescent labeling and cellular imaging. A FAP binds to a dye that is nonfluorescent when free in solution, resulting in fluorogenic activation against a dark background of unbound dye. The present work adds a new color to our toolbox of fluoromodules, allowing for cellular labeling with a new blue fluorescent dye, OTB-SO3.
In the selection method described in our previous reports, the naïve yeast library was initially subjected to two rounds of magnetic sorting in which a biotinylated version of the fluorogenic dye was immobilized on a magnetic bead coated with either streptavidin or an anti-biotin antibody. The affinity-enriched library was then sorted by FACS for yeast that activated fluorescence from the dye.8,13 An important advance in our selection method reported here involves bypassing of the magnetic selection steps, i.e. the naïve library was sorted directly by FACS for binding to OTB-SO3.21 Since the library contains ca. 109 unique yeast, only a quarter of the original library’s diversity was sorted over a period of 6 hours. Nevertheless, we selected at least six unique FAPs in this experiment, indicating that there is sufficient diversity in the library to allow selection of excellent (i.e. high affinity/high quantum yield) binders after only partial screening of the library. This approach, which we have since extended to several other fluorogenic dyes, simplifies the fluoromodule development process by eliminating the need to (a) synthesize a biotinylated version of the fluorogen and (b) magnetically pre-sort the library. Analogous work has recently been conducted to improve the fluorescent properties of blue fluorescent protein by creating a library of mutagenized chromophores and then screening the library using flow cytometry.22
Four of our newly selected OTB-SO3-binding scFvs have remarkably high quantum yields (ϕf > 0.8). These values compare favorably with the quantum yields of Azurite (0.55), EBFP2 (0.56), and mTagBFP (0.63), which are some of the brightest and most photostable proteins to date.22–24 These proteins feature fluorophores that are covalently integrated into the protein structure. In addition, blue fluoromodules consisting of noncovalent dye-protein complexes were previously reported for trans-stilbene fluorogens and antibody25 or scFv26 binding partners. Kd and ϕf values ranged from 100–4000 nM and 0.1–0.8, respectively, for those fluoromodules. The OTB-based fluoromodules reported here exhibit generally higher affinity and similar or better quantum yields than the stilbene variants.
The observation of enhanced fluorescence for OTB-SO3 in a viscous glycerol solution indicates that a torsional motion contributes to deactivation of the excited state in fluid solution, similar to other unsymmetrical cyanine dyes as well as triphenylmethane dyes such as malachite green.27,28 Twisting of the excited state dye about the central methine bridge allows the dye to relax nonradiatively to the ground state, provided the dye can twist beyond a critical torsional angle (ca. 60° for thiazole orange).29 Restriction of this motion, either by a bulk viscous solvent or by binding within a three-dimensional pocket that constrains the torsional freedom of the dye, blocks the nonradiative decay pathway, leading to significantly enhanced fluorescence.
The Kd and ϕf data presented in Table 1 indicate that affinity and fluorescence efficiency are not correlated. While all of the fluoromodules show significantly higher fluorescence than for the free dye, one of the highest affinity proteins, A6, exhibits the lowest ϕf = 0.047. There are several possible explanations for this observation. First, the dye could be bound by the benzoxazole heterocycle, with few contacts to the benzothiazole ring system. This would leave the benzothiazole half of the dye relatively unconstrained and able to twist in the excited state, resulting in weak fluorescence enhancement. (This would also account for the failure of the t-butyl-modified analogue to bind to A6, since the t-butyl group is attached to the benzoxazole ring.) A second possibility is that the dye is bound to the protein in a twisted conformation that is beyond the critical angle, leading to a low quantum yield. While this would seem to require an energetically unfavorable conformation for the dye, we note that malachite green can bind to an RNA aptamer in a significantly twisted conformation.28,30 A third explanation is that A6 has more room in its binding pocket for torsional movement, resulting in the bound dye losing energy through vibronic pathways. However, this seems unlikely based on the emission spectra. The dye in A6 has a relatively narrow spectrum with a clear vibronic shoulder, suggesting that the dye is tightly constrained, while in the very bright scFv H10 it possesses the broadest emission spectrum. This indicates that bright fluorescence can occur even in the presence of some heterogeneity in the binding conformation and/or torsional freedom, as long as the dye does not pass through its critical torsional angle in the excited state.
The promiscuous binding ability of two of the clones was especially interesting. A5 was able to bind t-butyl modified versions of OTB but not to DIR, while J10 bound to DIR but not to the t-butyl-OTB analogues. The other proteins exhibited fluorogenic activation exclusively with OTB-SO3 and the unmodified parent OTB. The range of dye-binding selectivities as well as the lack of sequence homology exhibited by these proteins indicates that the naïve scFv library contains sufficient diversity to provide numerous unique solutions to OTB-SO3 recognition. High resolution structures determined by x-ray crystallography or multidimensional NMR will aid in explaining the promiscuity of these scFvs.
Finally, these fluoromodules are ready to be used for cell-surface labeling applications. As shown in Figure 8, the H10/OTB-SO3 and H6-MG/MG-2p pairs are orthogonal and can be used for simultaneous blue/red imaging of two different proteins. Intracellular use will require engineering fluoromodules so that the scFv component folds properly within the reducing environment of the cytoplasm while also developing versions of the dyes that are cell permeable.
CONCLUSION
The results reported here show the development of a novel family of dye-scFv fluoromodules based on a blue fluorogenic cyanine dye, expanding the catalog of emission colors to the short wavelength region of the visible spectrum.
EXPERIMENTAL
Materials
Synthesis and characterization of OTB, OTB-SO3 and OTB-CO2 are described in supporting information. PO-PRO-1 was purchased from Invitrogen and used as received. DIR synthesis was described previously.19 Calf thymus DNA was purchased from Sigma-Aldrich and used as received.
Selection of yeast surface-displayed clones that activate OTB-SO3
The naïve yeast cell surface-display library was provided by Dane Wittrup of MIT and consists of ca. 8 × 10⁸ recombinant human scFvs produced from cDNA. This library is also available from Pacific Northwest National Library. EBY100 yeast were used to host the display library. The pPNL6 plasmids containing individual clones were extracted from the yeast using a Zymoprep I kit (Zymoresearch) and then transformed into Mach1™T1R E. coli. Sequencing was conducted by GeneWiz. Expression of a soluble protein version of the FAPs from E. coli was as described previously.8
Fluorescence Activated Cell Sorting was conducted on a Becton Dickinson FACSVantage SE with FACSDiva option. In the initial selection round, 2.4 × 10⁸ cells, or ca. one fourth of the original yeast library were sorted, a process which required approximately 6 hours. Cells were incubated with unwashed 1 µM OTB-SO3 for 30 min prior to sorting. Induction levels were measured using an Alexa 488 antibody binding to a c-myc epitope tag expressed alongside the FAP, and the brightest 2% of cells in terms of OTB-SO3 and induction signal were collected. Two additional selection rounds were performed using 1 µM OTB-SO3, while in the last two rounds the dye concentration was reduced to 100 nM to further increase affinity. At the fifth selection, individual cells were sorted onto an agar induction plate and allowed to grow. Individual colonies in the presence of OTB-SO3 were examined on a Carl Zeiss LSM 510 Meta Confocal Microscope using a 405 nm laser and a 420–480 nm bandpass filter; colonies with bright blue fluorescence were selected for further analysis.
Optical Spectroscopy
UV-Vis Spectroscopy
UV-vis spectra were recorded on a CARY-3Bio spectrophotometer. Sample temperatures were maintained at 20 °C using a thermoelectrically controlled Peltier cell holder.
Fluorescence Quantum Yields
Quantum yields for the OTB dyes were determined using 9,10-diphenylanthracene in 100% ethanol and quinine sulfate in 10% sulfuric acid as calibration curve standards. Cresyl violet in methanol and Cy5 in PBS were standards for the DIR measurements. Absorbance measurements were conducted on a Cary 300 Bio UV-Visible spectrophotometer, and fluorescence spectra were measured on a Cary Eclipse fluorimeter at 20 °C. Quantum yields were determined with respect to 9,10-diphenylanthracene from samples having an absorbance of between 0.02 and 0.1 at and above λmax. A plot of absorbance versus the integral of the fluorescence spectra was fit by linear regression, giving a slope M. Quantum yields (Φx) were determined using the following equation:
where Φsd is the quantum yield of the standard dye, Mx and Msd are the linear regression slopes of the sample and standard as defined previously, and ηx and ηsd are the refractive indices. Refractive indices of 1.333 for water (buffer), 1.3614 for ethanol, 1.0661 for 10 % sulfuric acid, and 1.4583 for glycerol were used.
Fluorescence Enhancements
Fluorescence enhancement values were calculated based on the fluorescence ratio for 200 nM dye bound to protein versus dye in buffer. These values were not corrected for differences in absorbance in the two samples.
Equilibrium Dissociation Constants
Fluorescence was measured by titrating dye into either 107 cells or 50 nM soluble protein. The fluorescence intensity was measured on a Tecan Safire2 plate reader or a Photon Technologies International fluorimeter respectively. Titrations were done in triplicate, with the mean value and standard deviations shown in the graphs as data points and vertical error bars, respectively. The data were fit to a one-site binding equation using Origin 7.5 software, where x is the dye concentration:
Fluorescence Microscopy
Yeast surface-displayed scFvs with dye were imaged using a Carl Zeiss LSM 510 Meta Confocal Microscope with a photomultiplier tube. Samples were excited using a 405 nm laser and a 420–480 nm band-pass filter for OTB-SO3, a 561 nm laser and a 575–630 nm band-pass filter for DIR, and a 633 nm laser and 650 nm longpass filter for MG. Cells were labeled with 200 nM dye and were imaged without washing unbound dye. Images were processed using ImageJ software (Rasband, W.S., ImageJ, U. S. National Institutes of Health, Bethesda, Maryland, USA, http://rsb.info.nih.gov/ij/, 1997–2009.) False colors were applied representative of emission wavelengths.
Supplementary Material
ACKNOWLEDGEMENT
K.J.Z. gratefully acknowledges support from a DoD, Air Force Office of Scientific Research, NDSEG Fellowship 32 CFR 168a. This work is supported by the U.S. National Institutes of Health (grant U54 RR022241). NMR instrumentation at CMU was partially supported by NSF (CHE-0130903). Mass spectrometers were funded by NSF (DBI-9729351). MG-2p was a generous gift from Brigitte Schmidt. We thank Drs. Gayathri Withers and Roberto Gil for expert assistance with NMR characterization of dyes. We are grateful to Dane Wittrup for providing an aliquot of the yeast scFv surface-displayed library.
REFERENCES
- 1.Giepmans BN, Adams SR, Ellisman MH, Tsein RY. Science. 2006;312:217–224. doi: 10.1126/science.1124618. [DOI] [PubMed] [Google Scholar]
- 2.Morise H, Shimomura O, Johnson FH, Winant J. Biochemistry. 1974;13:2656–2662. doi: 10.1021/bi00709a028. [DOI] [PubMed] [Google Scholar]
- 3.Shimomura O, Johnson FH, Saiga Y. J. Cell. Comp. Physiol. 1962;59:223–239. doi: 10.1002/jcp.1030590302. [DOI] [PubMed] [Google Scholar]
- 4.Chalfie M, Tu Y, Euskirchen G, Ward WW, Prasher DC. Science. 1994;263:802–805. doi: 10.1126/science.8303295. [DOI] [PubMed] [Google Scholar]
- 5.Inouye S, Tsuji FI. FEBS Lett. 1994;341:277–280. doi: 10.1016/0014-5793(94)80472-9. [DOI] [PubMed] [Google Scholar]
- 6.Tsien RY. Annu. Rev. Biochem. 1998;67:509–544. doi: 10.1146/annurev.biochem.67.1.509. [DOI] [PubMed] [Google Scholar]
- 7.Ward TH, Lippincott-Schwartz J. In: Green Fluorescent Protein. 2nd edn. Chalfie M, Kain SR, editors. Hoboken, NJ: John Wiley & Sons; 2006. pp. 305–337. [Google Scholar]
- 8.Szent-Gyorgyi C, Schmidt BF, Creeger Y, Fisher GW, Zakel KL, Adler S, Fitzpatrick JA, Woolford CA, Yan Q, Vasilev KV, Berget PB, Bruchez MP, Jarvik JW, Waggoner A. Nature Biotechnol. 2007;26:235–240. doi: 10.1038/nbt1368. [DOI] [PubMed] [Google Scholar]
- 9.Rye HS, Yue S, Wemmer DE, Quesada MA, Haugland RP, Mathies RA, Glazer AN. Nucleic Acids Res. 1992;20:2803–2812. doi: 10.1093/nar/20.11.2803. [DOI] [PMC free article] [PubMed] [Google Scholar]
- 10.Netzel TL, Nafisi K, Zhao M, Lenhard JR, Johnson I. J. Phys. Chem. 1995;99:17936–17947. [Google Scholar]
- 11.Shank NI, Zanotti KJ, Lanni F, Berget PB, Armitage BA. J. Am. Chem. Soc. 2009;131:12960–12969. doi: 10.1021/ja9016864. [DOI] [PMC free article] [PubMed] [Google Scholar]
- 12.Feldhaus MJ, Siegel RW, Opresko LK, Coleman JR, Feldhaus JM, Yeung YA, Cochran JR, Heinzelman P, Colby D, Swers J, Graff C, Wiley HS, Wittrup KD. Nature Biotechnol. 2003;21:163–170. doi: 10.1038/nbt785. [DOI] [PubMed] [Google Scholar]
- 13.Özhalici-Ünal H, Lee Pow C, Marks SA, Jesper LD, Silva GL, Shank NI, Jones EW, Burnette JM, III, Berget PB, Armitage BA. J. Am. Chem. Soc. 2008;130:12620–12621. doi: 10.1021/ja805042p. [DOI] [PMC free article] [PubMed] [Google Scholar]
- 14.Falco CN, Dykstra KM, Yates BP, Berget PB. Biotechnol. J. 2009;4:1328–1336. doi: 10.1002/biot.200900075. [DOI] [PubMed] [Google Scholar]
- 15.Fitzpatrick JAJ, Yan Q, Sieber JJ, Dyba M, Shwarz U, Szent-Gyorgyi C, Woolford CA, Berget PB, Waggoner AS, Bruchez MP. Bioconj. Chem. 2009;20:1843–1847. doi: 10.1021/bc900249e. [DOI] [PMC free article] [PubMed] [Google Scholar]
- 16.Yue S, Johnson I, Huang Z, Haugland R. 5 321 130. US Pat. 1994
- 17.Haugland RP. Handbook of Fluorescent Probes and Research Chemicals. 9th edn. Eugene, OR: Molecular Probes; 2002. [Google Scholar]
- 18.Yarmoluk SM, Lukashov SS, Ogul'chansky TY, Losytskyy MY, Kornyushyna OS. Biopolymers. 2001;62:219–227. doi: 10.1002/bip.1016. [DOI] [PubMed] [Google Scholar]
- 19.Constantin T, Silva GL, Robertson KL, Hamilton TP, Fague KM, Waggoner AS, Armitage BA. Org. Lett. 2008;10:1561–1564. doi: 10.1021/ol702920e. [DOI] [PubMed] [Google Scholar]
- 20.Chao G, Lau WL, Hackel BJ, Sazinsky SL, Lippow SM, Wittrup KD. Nature Protocols. 2006;1:755–768. doi: 10.1038/nprot.2006.94. [DOI] [PubMed] [Google Scholar]
- 21.Creeger Y. Manuscript in preparation. [Google Scholar]
- 22.Mena MA, Treynor TP, Mayo SL, Daugherty PS. Nature Biotechnology. 2006;24:1569–1571. doi: 10.1038/nbt1264. [DOI] [PubMed] [Google Scholar]
- 23.Ai H, Shaner NC, Cheng Z, Tsein RY, Campbell RE. Biochemistry. 2007;46:5904–5910. doi: 10.1021/bi700199g. [DOI] [PubMed] [Google Scholar]
- 24.Subach OM, Gundorov IS, Yoshimura M, Subach FV, Zhang J, GrÜenwald D, Souslova EA, Chukdakov DM, Verkhusha VV. Chem. Biol. 2008;15:1116–1124. doi: 10.1016/j.chembiol.2008.08.006. [DOI] [PMC free article] [PubMed] [Google Scholar]
- 25.Simeonov A, Matsushita M, Juban EA, Thompson EHZ, Hoffman TZ, Beuscher AE, Taylor MJ, Wirsching P, Rettig W, McCusker JK, Stevens RC, Millar DP, Schultz PG, Lerner RA, Janda KD. Science. 2000;290:307–313. doi: 10.1126/science.290.5490.307. [DOI] [PubMed] [Google Scholar]
- 26.Debler EW, Kaufmann GF, Meijler MM, Heine A, Mee JM, Pljevaljčić G, Di Bilio AJ, Schultz PG, Millar DP, Janda KD, Wilson IA, Gray HB, Lerner RA. Science. 2008;319:1232–1235. doi: 10.1126/science.1153445. [DOI] [PubMed] [Google Scholar]
- 27.Deligeorgiev TG, Kaloyanova S, Vaquero JJ. Rec. Pat. Mat. Sci. 2009;2:1–26. [Google Scholar]
- 28.Grate D, Wilson C. Proc. Natl. Acad. Sci., USA. 1999;96:6131–6136. doi: 10.1073/pnas.96.11.6131. [DOI] [PMC free article] [PubMed] [Google Scholar]
- 29.Silva GL, Ediz V, Armitage BA, Yaron D. J. Am. Chem. Soc. 2007;129:5710–5718. doi: 10.1021/ja070025z. [DOI] [PMC free article] [PubMed] [Google Scholar]
- 30.Flinders J, DeFina SC, Brackett DM, Baugh C, Wilson C, Dieckmann T. ChemBioChem. 2004;5:62–72. doi: 10.1002/cbic.200300701. [DOI] [PubMed] [Google Scholar]
Associated Data
This section collects any data citations, data availability statements, or supplementary materials included in this article.


