

Abstract
The effect of salicylic acid (SA) on respiration and mitochondrial function was examined in tobacco (Nicotiana tabacum) suspension cell cultures in the range of 0.01 to 5 mm. Cells rapidly accumulated SA up to 10-fold of the externally applied concentrations. At the lower concentrations, SA accumulation was transitory. When applied at 0.1 mm or less, SA stimulated respiration of whole cells and isolated mitochondria in the absence of added ADP, indicating uncoupling of respiration. However, at higher concentrations, respiration was severely inhibited. Measurements of ubiquinone redox poise in isolated mitochondria suggested that SA blocked electron flow from the substrate dehydrogenases to the ubiquinone pool. This inhibition could be at least partially reversed by re-isolating the mitochondria. Two active analogs of SA, benzoic acid and acetyl-SA, had the same effect as SA on isolated tobacco mitochondria, whereas the inactive p-hydroxybenzoic acid was without effect at the same concentration. SA induced an increase in Aox protein levels in cell suspensions, and this was correlated with an increase in Aox1 transcript abundance. However, when applied at 0.1 mm, this induction was transient and disappeared as SA levels in the cells declined. SA at 0.1 mm also increased the expression of other SA-responsive genes, and this induction was dependent on active mitochondria. The results indicate that SA is both an uncoupler and an inhibitor of mitochondrial electron transport and suggest that this underlies the induction of some genes by SA. The possible implications of this for the interpretation of SA action in plants are discussed.
Salicylic acid (SA) is a phenolic compound that is an important effector molecule in plants (Klessig and Malamy, 1994). It has been shown to regulate a number of processes, including thermogenesis (Raskin et al., 1987), the defense response to pathogen attack (Klessig and Malamy, 1994; Hunt et al., 1996; Yang et al., 1997), ethylene synthesis, and fruit ripening (Leslie and Romani, 1988). There is also evidence for a role of SA in regulating plant responses to some abiotic stresses, in particular UV radiation and ozone (Yalpani et al., 1991; Rao and Davis, 1999; Senaratna et al., 2000). The signal transduction mechanisms involved in the action of SA in these processes and cross-talk between SA and other signaling molecules have been partially elucidated (see Alvarez, 2000). Other studies have provided evidence for the involvement of protein phosphorylation in the transcriptional regulation of at least some SA-responsive genes (Jupin and Chua, 1996; Stange et al., 1997), and an SA-activated mitogen-activated protein kinase has been discovered (Conrath et al., 1997; Shirasu et al., 1997; Zhang and Klessig, 1997, 1998a).
A well-characterized role of SA in plants is the control of heat production during flowering of thermogenic plants (Raskin et al., 1987). In Arum sp., SA induces thermogenesis, which volatilizes odor compounds that aid pollination (Raskin et al., 1987). Energy for thermogenesis is provided by an increase in mitochondrial electron transport through the alternative oxidase (Aox), which diverts electron transport from the cytochrome pathway and uncouples ATP production (Meeuse, 1975). Aox is induced by SA in this system and in non-thermogenic plants (Raskin et al., 1987, 1989; Rhoads and McIntosh, 1993; Van Der Straeten et al., 1995; Maxwell et al., 2002).
In non-thermogenic plants, Aox is thought to assist in minimizing the production of reactive oxygen species (ROS) by the respiratory chain (Vanlerberghe and McIntosh, 1997; Maxwell et al., 1999; Parsons et al., 1999; Yip and Vanlerberghe, 2001). Two recent studies with transgenic tobacco (Nicotiana tabacum) lacking or overexpressing Aox also suggest that this enzyme could be involved in the hypersensitive response (HR) and may prevent programmed cell death induced by down-regulation of the cytochrome pathway (Ordog et al., 2002; Vanlerberghe et al., 2002). Aox is effectively induced by artificial chemical inhibition of the cytochrome pathway by poisons such as cyanide and antimycin A (Vanlerberghe et al., 1994; Wagner and Wagner, 1997), and these chemicals can influence the effect of SA on virus resistance in tobacco (Gilliland et al., 2003). However, the mechanism of Aox induction by SA remains unclear.
In many studies, SA is applied externally at millimolar concentrations (Maxwell et al., 2002; Gilliland et al., 2003), whereas in others, it has been shown to be an effective signal at micromolar concentrations (Raskin et al., 1987). Endogenously generated SA may accumulate to micromolar concentrations, for example, 70 μm at the site of the HR (Bi et al., 1995). SA has also been shown to act as a respiratory poison in tobacco cells (Xie and Chen, 1999; Maxwell et al., 2002), but its site of action has not been elucidated. The fact that mitochondria isolated from SA-inhibited cells respire normally suggested that it might affect respiration indirectly (Xie and Chen, 1999; Djajanegara et al., 2002).
We have reinvestigated the effect of SA on respiration by intact cells and isolated mitochondria from tobacco suspension cell cultures. We show that when applied externally, SA can accumulate to millimolar concentrations inside the cells. In isolated mitochondria, SA acts as an uncoupler of electron transport at concentrations less than 1 mm. At higher concentrations, it is a potent inhibitor of electron transport, appearing to block electron transport from substrate dehydrogenases to the ubiquinone (UQ) pool. The implications of these results for studies on SA-induced changes in gene expression in plants are discussed.
RESULTS
SA Rapidly Accumulates in Cell Cultures
Changes in internal SA levels were measured at different times after addition of SA to tobacco cell suspensions. Minimum cytosolic concentrations were calculated by assuming that SA was evenly distributed throughout the interior of the cells. As shown in Table I, no SA was detected in control (untreated) cells, whereas in treated cells, SA was found to accumulate rapidly. In cells treated with either 0.01 or 0.1 mm external SA, the internal SA concentration increased 6- to 10-fold within 0.5 h, remained high for at least 1 h, and then decreased to be barely detectable 4 h after treatment. In cells treated with 1 mm external SA, internal SA rapidly accumulated to a concentration of 4 mm. The high internal SA levels remained high, decreasing only to about 1 mm after 24 h.
Table I.
Internal SA concentration (mm) in tobacco cells 0.5, 1, 4, or 24 h after the addition of SA to a final concentration of 0.01, 0.1, or 1 mm
Data are means ± se, n = 4.
| 0.5 h | 1 h | 4 h | 24 h | |
|---|---|---|---|---|
| Control | 0.00 ± 0.00 | 0.01 ± 0.01 | 0.00 ± 0.00 | 0.00 ± 0.00 |
| 0.01 mm SA | 0.15 ± 0.08 | 0.16 ± 0.06 | 0.02 ± 0.01 | 0.03 ± 0.02 |
| 0.1 mm SA | 0.64 ± 0.04 | 0.72 ± 0.08 | 0.03 ± 0.01 | 0.04 ± 0.02 |
| 1 mm SA | 4.06 ± 0.91 | 2.98 ± 0.58 | 1.44 ± 0.28 | 0.96 ± 0.12 |
The cultures treated with either 0.01 or 0.1 mm SA were similar in density and color to the control cells, whereas cultures treated with 1 mm SA were less dense and took on a gray hue within 24 h after treatment. Cell viability was determined by fluorescence microscopy using the vital stain fluorescein diacetate. Whereas treatment with the two lower concentrations of SA did not affect the viability of the cells, 1 mm exogenous SA led to 60% cell death within 4 h and 90% cell death 24 h after the treatment (data not shown). It should be noted that this may have caused us to underestimate the concentration of SA within cells, because the SA extracted may have been confined only to the viable cells.
Effect of Exogenous SA on Whole-Cell Respiration
SA effects on whole-cell respiration were assayed by measuring O2 uptake by the cells and adding SA directly to the electrode reaction chamber. As shown in Table II, the addition of 1 mm exogenous SA resulted in a complete and immediate inhibition of whole-cell respiration. Concentrations of 0.01 and 0.1 mm SA, in contrast, stimulated oxygen uptake by 1.2- to 1.4-fold, compared with the basal respiration rate. Carbonyl cyanide m-chlorophenoxylhydrazone (CCCP), an uncoupler of the electron transport chain, was found to stimulate respiration by 1.8-fold. Potassium cyanide (KCN), an inhibitor of the cytochrome pathway, added sequentially after CCCP, inhibited respiration to 10% of the basal rate, indicating that the capacity of the alternative pathway was very low under the culture conditions employed.
Table II.
Effect of SA on whole cell respiration
Oxygen consumption of whole tobacco cells was measured as described in `Materials and Methods,' before (basal) and after addition of SA or CCCP or CCCP then KCN. Data are means ± se, paired samples are significantly different where P ≤ 0.02.
| Treatment | Respiration rate | n |
|---|---|---|
| nmol O2 | ||
| min−1 mL−1 | ||
| Basal | 40 ± 2 | 23 |
| 0.01 mm SA | 61 ± 10 | 4 |
| 0.1 mm SA | 51 ± 5 | 3 |
| 1 mm SA | 0 ± 1 | 11 |
| CCCP | 80 ± 4 | 5 |
| CCCP/KCN | 5 ± 2 | 5 |
SA Is an Uncoupler and an Inhibitor of Mitochondrial Electron Transport
The above results are in accordance with those of Xie and Chen (1999) who observed inhibition of whole-tobacco cell respiration by 0.5 mm SA and noted that intracellular ATP levels decreased. These authors found that SA at a concentration of 0.5 mm did not significantly affect the respiration of isolated mitochondria, with NADH as a substrate. Having found that SA applied at 1 mm accumulated to at least 4 mm inside cells (Table I), we decided to reinvestigate the effect of SA on isolated mitochondria using various substrates.
As shown in Figure 1, SA had different effects on the respiration of isolated mitochondria depending on the concentration at which it was applied and the substrate provided to the mitochondria. At all concentrations used, SA inhibited state 3 respiration (the rapid oxygen uptake in the presence of ADP) with succinate or malate + pyruvate provided as substrates. At SA concentrations less than 1 mm, the intracellular concentration found 30 min after adding 0.01 or 0.1 mm SA to cells (Table I), O2 uptake was stimulated in the absence of ADP (state 4) when malate + pyruvate was the substrate (Fig. 1A). The stimulation occurred even in the presence of oligomycin, an ATP synthase inhibitor (data not shown), showing that SA acted as an uncoupler at this concentration. This uncoupling was not as obvious with succinate or NADH because respiratory control was not as marked with these substrates, and state 4 rates were often higher than the SA-stimulated state 4 rates with malate + pyruvate (Fig. 1). The lesser stimulation with succinate as substrate may also reflect a slightly greater sensitivity of succinate dehydrogenase to SA inhibition. NADH oxidation in the presence of ADP, when rates are maximal, was less affected by SA, with inhibition only apparent when SA was applied in excess of 1 mm. This is in accordance with previous results from Xie and Chen (1999). At 4 to 5 mm, the approximate intracellular concentration when 1 mm SA was added to cell suspensions (Table I), respiration was completely inhibited with all three substrates. These data agree with the effect of SA on whole cells (Table II), the respiration of which was apparently limited by adenylate levels. Experiments with mitochondria isolated from soybean (Glycine max) cotyledons, which contain substantial amounts of Aox, showed that electron transport via both the cytochrome pathway and Aox was sensitive to SA (results not shown).
Figure 1.

Effect of SA on purified mitochondria. Oxygen uptake by mitochondria purified from tobacco cells was measured with: 5 mm malate + 5 mm pyruvate (A), 10 mm succinate (B), and 10 mm NADH (C and D). State 3 respiration was measured in the presence of 0.1 mm ADP, state 4 respiration in absence of ADP. SA was added to the reaction vessel to the final concentration indicated for each histogram during state 4 respiration (in the absence of ADP) for A, B, and C and during state 3 respiration (in the presence of ADP) for D. A, Stimulation of oxygen uptake by 0.5 and 1 mm SA is statistically significant as compared with state 4 respiration as indicated by a and b where P ≤ 0.002. Oxygen uptake was measured as described in “Materials and Methods” and expressed in nanomoles of O2 per minute per milligram protein. Data are means ± se, n = 4.
Two active analogs of SA, benzoic acid (BA) and acetyl-SA (ASA), had the same inhibitory effect at 5 mm as SA on isolated tobacco mitochondria, whereas the inactive p-hydroxybenzoic acid (pHBA) was without effect at the same concentration (Table III).
Table III.
Effect of SA analogs on mitochondrial respiration
Data are expressed as a percentage of the maximal respiration of control in state 3 (48 ± 7 nmol O2 min−1 mg−1 protein) using malate and pyruvate as substrates. The analogs were added directly to the oxygen electrode chamber to a final concentration of 5 mm. Data are means ± se, n = 3-7.
| Compound Tested | Control |
|---|---|
| % | |
| Acetyl salicylic acid | 0 ± 1 |
| Benzoic acid | 0 ± 1 |
| p-Hydroxy benzoic acid | 95 ± 7 |
Respiration in isolated mitochondria could at least partially recover from inhibition by 5 mm SA by reisolating and resuspending the organelles in fresh reaction medium (Table IV). Respiration was observed to recover to a various extent in the presence of all three respiratory substrates. This is in agreement with previous studies showing that mitochondria isolated from SA-inhibited cells have respiration rates similar to those from control cells (Xie and Chen, 1999; Djajanegara et al., 2002).
Table IV.
Recovery of mitochondrial oxygen uptake with various substrates after SA inhibition followed by washing
Mitochondrial O2 uptake was measured with three different substrates in presence (state 3) or absence (state 4) of 0.1 mm ADP in control and treated with 5 mm SA mitochondria as described in “Materials and Methods.” Both control and SA-treated mitochondria were then washed by centrifugation and resuspended in fresh reaction media, and O2 uptake was measured using the same substrate as before treatment. Data are means ± se, n = 3.
| Substrate: | Control Mitochondria | Mitochondria Treated with 5 mm SA | Control Mitochondria Washed | Mitochondria Treated with 5 mm SA Washed |
|---|---|---|---|---|
| nmol O2 min−1 mg−1 protein | ||||
| Succinate | ||||
| State 3 (+ADP) | 157 ± 13 | 0 ± 1 | 119 ± 7 | 74 ± 15 |
| State 4 (−ADP) | 86 ± 13 | 0 ± 1 | 72 ± 5 | 58 ± 12 |
| NADH | ||||
| State 3 (+ADP) | 158 ± 25 | 0 ± 1 | 130 ± 16 | 87 ± 30 |
| State 4 (−ADP) | 71 ± 8 | 0 ± 1 | 80 ± 5 | 69 ± 16 |
| Malate and pyruvate | ||||
| State 3 (+ADP) | 175 ± 18 | 0 ± 1 | 111 ± 18 | 59 ± 11 |
| State 4 (−ADP) | 78 ± 11 | 0 ± 1 | 61 ± 5 | 51 ± 4 |
SA Blocks Electron Flow from the Substrate Dehydrogenases to the UQ Pool
As seen above, the inhibition of respiration by SA was observed with all substrates used. To localize the site of SA inhibition, we examined the effect of SA on UQ reduction status, using an O2 electrode coupled to a Q potentiostat. A membrane soluble quinol, Q1, was added to the reaction chamber containing the respiratory media. The mitochondria were then added, followed by ATP and succinate. As electron flow through the respiratory chain commenced, Q1 became reduced, causing an upward deflection of the Q potentiostat (Fig. 2A). This is indicative of the endogenous mitochondrial UQ pool being reduced (Dry et al., 1989). When ADP was added and electron flow from UQ through to O2 increased, Q1 was oxidized, reflecting oxidation of the UQ pool. When the added ADP had been fully phosphorylated, oxygen uptake decreased and Q1 became more reduced. Subsequent addition of increasing concentrations of SA to the mitochondria in respiratory state 4 initially caused a slight stimulation (uncoupling), followed by inhibition of O2 uptake (Fig. 1A). All additions of SA caused the UQ pool to become more oxidized, suggesting that SA blocked electron transport between succinate and UQ.
Figure 2.

Effect of SA on the redox state of the UQ pool. A, Simultaneous recording of O2 uptake (top trace) and Q reduction (bottom trace). Where indicated, 10 mm succinate and 0.1 mm ADP were added to the reaction vessel, and SA was added in state 4 sequentially as indicated to final concentrations of 0.1, 0.2, 0.5, 1, 2, and 4 mm, respectively. B, Respiration rate as a function of the redox state of UQ. Tobacco cell mitochondria oxidizing succinate were titrated with either KCN (▵ and ▴) or malonate (□ and ▪). Data were expressed as a percentage of the maximal state 3 respiration. White symbols, No SA; black symbols, plus 1 mm SA.
To confirm the site of SA action, O2 uptake with succinate as substrate was titrated with KCN, an inhibitor of cytochrome oxidase, and malonate, an inhibitor of succinate dehydrogenase, and UQ reduction status was simultaneously measured in the presence and absence of SA (Fig. 2B). Incremental addition of KCN to control mitochondria caused a gradual inhibition of O2 uptake and a concomitant increase in the reduction of the UQ pool as electron flow out of the pool became progressively less. When 1 mm SA was added, O2 uptake was inhibited by approximately 60%. In the presence of SA, KCN addition increased Qreduced/Qtotal substantially, but O2 uptake changed little until high concentrations of KCN were added. When malonate was used to titrate respiration, the plot of O2 uptake versus Qreduced/Qtotal in the presence of SA overlays that in the absence of SA (Fig. 2B). These results confirm that the major effect of SA is on the kinetics of the dehydrogenases reducing the UQ pool and that it had very little effect on the kinetics of the quinol oxidases (Van den Bergen et al., 1994; Millar et al., 1995).
Effect of SA on Expression of Mitochondrial Proteins
SA is a signal molecule and has been shown previously to be involved in the induction of Aox protein in different plants (Lennon et al., 1997; Chivasa and Carr, 1998; Maxwell et al., 2002). However, the concentrations used in these experiments were high, 1 mm or greater, which has been shown to be toxic. Because respiratory poisons have been shown to induce Aox synthesis (Vanlerberghe and McIntosh, 1997), it is important to determine whether the effect of SA on respiratory gene expression is due to its action as a signal or a poison. We therefore treated tobacco cell cultures with three different concentrations of SA and determined the abundance of Aox protein 24 h after treatment. Exposure to 0.01, 0.1, or 1 mm SA caused Aox protein abundance to increase (Fig. 3), whereas the abundance of the outer membrane protein porin was virtually unaffected by any of the SA treatments. However, as mentioned above, after 24 h of treatment with 1 mm SA, many of the cells were dead or dying, so Aox protein may have been extracted only from a sub-population of cells.
Figure 3.

Effect of SA on the expression of mitochondrial proteins. Cells were treated with SA for 24 h, after which total proteins were extracted and mitochondrial proteins detected by western blotting. C, Control cells (no added SA); 0.01, 0.01 mm SA; 0.1, 0.1 mm SA; 1, 1 mm SA. Signal intensities were quantified and expressed relative to the maximal value as shown by the numbers below each blot.
We subsequently studied the effects of SA at concentrations that did not affect cell viability (Fig. 4). In our hands, the amount of Aox protein in control cells of tobacco varies from culture to culture and, in Figure 4A, more protein was observed in control cells than in those used in the experiment of Figure 3. However, we consistently observed more Aox protein in SA-treated cells. For example, treating with 0.01 mm SA resulted in increases in protein abundance of 36% in Figure 3 and 41% in Figure 4. At 0.01 and 0.1 mm SA, Aox protein abundance was higher 4 h after SA addition than after 24 h (Fig. 4A). This decrease between 4 and 24 h after SA addition coincided with the loss of SA from the cells (Table I). Two Aox cDNA sequences, Aox1 and Aox2, have been isolated in tobacco, although only Aox1 has been fully cloned and characterized (Whelan et al., 1995). Because it was not possible to differentiate between the two Aox isoforms by western blots, transcript levels were measured using real-time PCR and primers specific for each isoform. Transcripts for Aox1 were more abundant than those for Aox2 in untreated control cells, and SA treatment caused the concentration-dependent induction of Aox1 transcripts over Aox2 transcripts. Within 4 h of SA treatment, NtAox1 transcript abundance had increased 2- to 6-fold, whereas Aox2 transcripts were induced by less than 2-fold. After 24 h, Aox1 transcript abundance had decreased nearly to control levels. In all samples, the total abundance of Aox transcripts correlated well with Aox protein abundance (Fig. 4).
Figure 4.

Effect of SA on the expression of Aox protein and transcripts. Cells were treated with SA at different concentrations and protein and RNA extracted after 4 and 24 h. A, Aox protein. Lanes C, Controls (no added SA); lanes 0.01, 0.01 mm SA; lanes 0.1, 0.1 mm SA. Cells were harvested after 4 or 24 h, and Aox protein was detected by western blotting. The numbers under the blots represent quantification of the signal intensity and are expressed relative to the maximum. B, Transcript levels for NtAox1 and NtAox2. Two independent samples from each of the treatments (control, 0.01 mm SA, and 0.1 mm SA) at both 4 and 24 h after SA addition were used for RNA isolations. From each RNA sample, two preparations of cDNA were produced and used in real-time quantitative PCR to determine transcript levels of the two Aox isoforms. Each cDNA sample was analyzed in duplicate for each isoform. Absolute transcript levels were determined using a standard curve prepared using known concentrations of amplified regions of the Aox1 and Aox2 cDNA. Error bars show the se calculated for each treatment.
Effect of SA on Gene Expression
To further understand the effect of SA on gene expression, we measured transcript levels of five SA-responsive genes after treatment of cells with 0.1 mm SA: Aox1; wound-induced-protein kinase Wipk, which has been shown to be induced at a the transcriptional level during the HR (Romeis et al., 1999); two SA-early responsive genes, Gnt35, encoding a glutathione S-transferase (Garreton et al., 2002), and Sagt, encoding a UDP-Glc-SA transferase (Lee and Raskin, 1999); and Pr1a, a SA-late responsive gene. We also measured transcript levels for SA-induced protein kinase (Sipk), as a control. This gene is not induced at a transcriptional level by SA application but rather is regulated posttranslationally by phosphorylation of the SIPK protein (Zhang and Klessig, 1997, 1998a, 1998b; Zhang et al., 1998; Romeis et al., 1999). Expression of Sipk did not change significantly in any of the experiments (Fig. 5).
Figure 5.
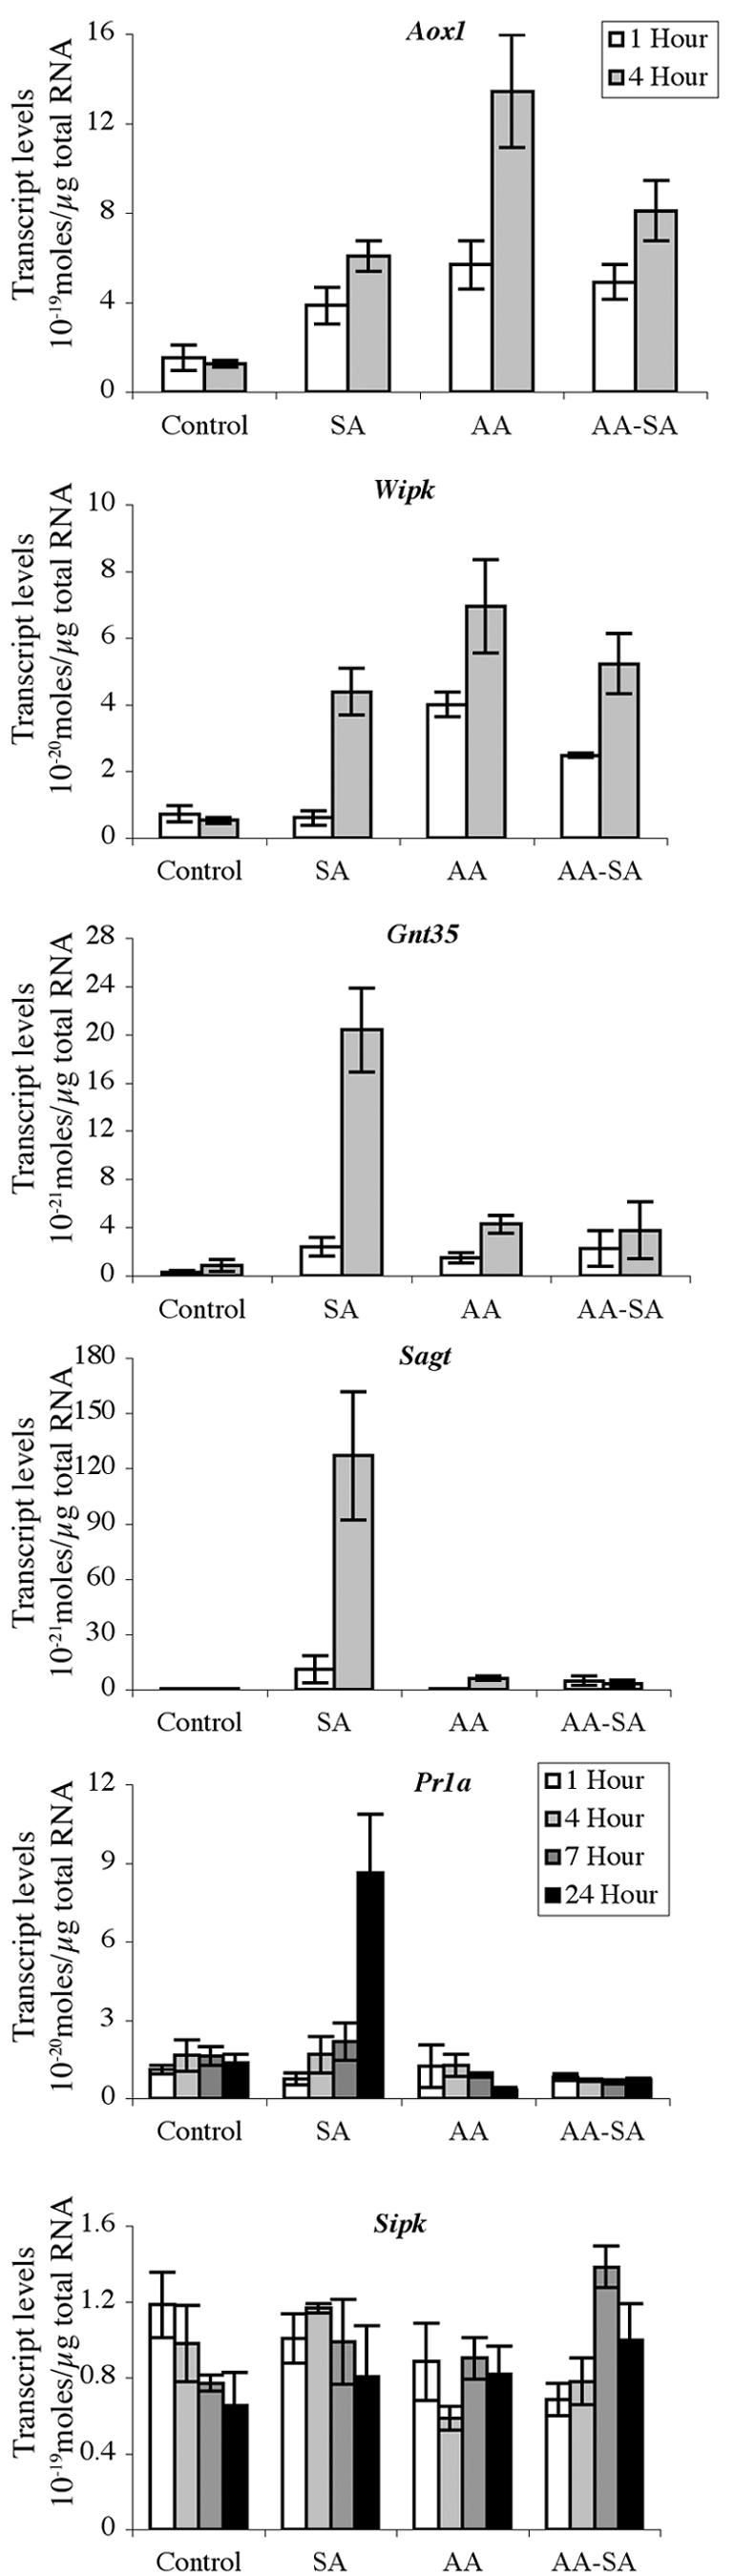
Effect of SA on gene expression. Tobacco cells were: not treated (Control), treated with SA at 0.1 mm or antimycin A (AA) at 5 μm, or pretreated with 5 μm AA for 1 h followed by 0.1 mm SA (AA-SA) and RNA extracted after 1, 4, 7, and 24 h depending on the sample. Three independent samples from each of the treatment, at indicated time after SA addition, were used for RNA isolations and quantification of gene-specific transcripts as described in the legend to Figure 4. Each cDNA sample was analyzed in duplicate for each gene. Error bars show the se calculated for each treatment.
Transcripts for Aox1, Wipk, Gnt35, and Sagt all increased in abundance after treatment of cells with 0.1 mm SA for 1 and 4 h, with transcript abundance higher after 4 h (Fig. 5). Transcript levels for these genes decreased rapidly after 4 h and were very low 24 h after application (data not shown). Pr1a transcripts, on the other hand, required a 24-h incubation with SA for induction (Fig. 5). For comparison, cells were also treated with 5 μm of the respiratory poison antimycin. Antimycin exposure for 1 or 4 h increased transcript abundance of Aox1 and Wipk to the same level or slightly higher than that following SA exposure for the same time. Antimycin also stimulated Gnt35 expression to some extent but had little effect on the expression of Sagt and Pr1a (Fig. 5).
To examine the interplay between the SA and antimycin effects, we measured the levels of gene transcripts in cells pretreated for 1 h with 5 μm antimycin before incubation with 0.1 mm SA for 1, 4, 7, or 24 h further, depending on the gene. Transcript abundance of Aox1 and Wipk was similar to that induced by antimycin or SA alone. However, the SA-induced increase in transcript abundance for Gnt35, Sagt, and Pr1a was severely inhibited by the pretreatment with antimycin. These results show that some SA-responsive genes, such as Aox1 and Wipk, also respond to an inhibitor of respiratory electron transport, whereas SA-dependent expression of other genes, such as Gnt35, Sagt, and Pr1a, is blocked by this inhibitor. The lack of antimycin inhibition of Sipk, Wipk, and Aox1 transcript accumulation indicates that the lack of message for Gnt35, Sagt, and Pr1a was not due simply to a general decrease or lack of mRNA after disruption of mitochondrial function.
DISCUSSION
The results presented here show that SA can act not only as a signal molecule but also as a respiratory uncoupler and poison. Previous experiments (Xie and Chen, 1999) had shown that SA inhibits whole-cell respiration but the lack of inhibition in mitochondria isolated from those cells prompted these authors to conclude that SA acted outside the mitochondria. However, these experiments employed only one SA concentration (0.5 mm) and a single respiratory substrate (NADH). Here, using a range of substrates and well-coupled isolated mitochondria, we have shown that SA stimulates ADP-limited electron transport at low concentrations (<1 mm) by acting as an uncoupler. At higher concentrations, between 1 and 5 mm, SA inhibits respiration, apparently by preventing electron flow from the substrate dehydrogenases to the UQ pool. These concentrations are found inside suspension cells, at least transitorily, after addition of as little as 0.1 mm SA to the external medium (Table I). The phenolic nature of SA suggests that at millimolar concentrations, SA may act as a quinone analog, preventing interaction between the dehydrogenases and the UQ pool. The respiratory inhibition was partially relieved by washing SA out of the mitochondrial suspension, which may explain why mitochondria isolated from inhibited cells respire normally (Xie and Chen, 1999; Djajanegara et al., 2002). Both the uncoupling and inhibitory effects of SA would act to lower cell ATP levels, as seen by Xie and Chen (1999).
The concentrations of SA used in our experiments are probably higher than those at which endogenous SA is likely to occur, although locally high concentrations cannot be ruled out. However, they span the range of concentrations commonly used for external application in many experimental systems and therefore are important for the interpretation of these results. Even when applied at 1 mm, it is often assumed that SA acts as a signal transduction molecule, mimicking the in vivo situation. Our results suggest that this interpretation may need revision, particularly in experiments using tobacco cell cultures, where we have shown that SA accumulates rapidly. This raises the question of whether external SA, even at low concentrations, is acting as a signal elicitor or a respiratory inhibitor when it stimulates expression of mitochondrial proteins. The results in Figures 3, 4, 5 suggest that SA enhances Aox synthesis via its interference with mitochondrial function, as the increase in Aox protein and transcripts was transitory, declining between 4 and 24 h of applying low concentrations of SA. When applied at low concentrations, the internal concentration of SA in cells also declined over this period (Table I). The impact of SA on mitochondrial function is not a tobacco-specific phenomenon. We have found similar uncoupling and inhibitory effects on soybean mitochondria (data not shown), and SA uncoupling of mammalian mitochondria has also been reported (Jorgensen et al., 1976). In other plant tissues, whether SA inhibits or uncouples will depend on the extent to which SA accumulates inside the tissue and whether respiration is adenylate limited or not.
Interfering with mitochondrial function can influence not only expression of respiratory genes (Vanlerberghe and McIntosh, 1997; McIntosh et al., 1998), but may also influence expression of more general stress- and pathogen-related genes (Maxwell et al., 2002). As shown in Figure 5, four other genes were also induced by SA, three of them, Wipk, Gnt35, and Sagt, with similar kinetics to Aox1. However, Pr1a expression was induced long after SA was gone from the cells. Expression of Wipk, and to some extent Gnt35, was also induced by incubation with antimycin alone, perhaps suggesting a common signaling pathway for SA and antimycin. On the other hand, neither Sagt or Pr1a expression was induced by antimycin, indicating that in these cases SA acts via a different signaling route, as found for the SA-inducible RNA-dependent RNA polymerase (Gilliland et al., 2003). Obviously, SA induces gene expression via multiple pathways in plants, at least one of which is shared by antimycin. As discussed by Gilliland et al. (2003), a possible common feature of both SA and antimycin effects on plant cells is enhanced production of ROS, which can influence expression of many genes. Thus ROS generation may underlie the effects of SA and antimycin on expression on Aox, Wipk, and Gnt35. ROS generation is triggered by inhibition of mitochondrial electron transport (Wagner and Moore, 1997; Maxwell et al., 1999; Yip and Vanlerberghe, 2001) but it should be noted that SA can stimulate ROS production in plant cells via other mechanisms that do not involve mitochondria (Chen et al., 1993; Durner and Klessig, 1995; Slaymaker et al., 2002). Other features common to SA and antimycin effects are changes in cell ATP levels and pyridine nucleotide redox poise, and these are other candidates for signals influencing gene expression.
Although Sagt and Pr1a expression was not induced by antimycin, it is interesting to note that pretreating cells with the respiratory poison blocked the subsequent induction of these genes by SA (Fig. 5). This suggests that SA signaling in this case also involves the mitochondria, or at least requires mitochondria to be functional. Cell ATP levels or redox poise may also influence these signaling pathway(s). Taken together, our results imply that mitochondria play either direct or indirect roles in some SA-linked signal transduction pathways, leading to changes in gene expression in plants.
MATERIALS AND METHODS
Cell Culture and Mitochondrial Isolation
Tobacco (Nicotiana tabacum) cell suspension cultures were generously provided by Dr. K. Soole (The Flinders University of South Australia, Australia) and maintained as described by Zhang et al. (1999). They were subcultured every 7 d 1:25 (v/v) and used for intact tissue experimentation 3 d after subculture, except when used for mitochondria isolation 5 d after subculture. Cells were collected by filtration through four layers of Miracloth. Purification of the mitochondria was performed as described by Day et al. (1985) using Percoll density gradients. Treatments with SA, purchased from Sigma (Sydney), were performed by adding a 1,000-fold concentrated solution directly into the flask.
Respiration and UQ Redox Assays
Oxygen uptake was measured at 25°C using oxygen electrodes (Rank Brothers, Cambridge, UK) in either a 1-mL (mitochondria) or a 4-mL (whole-cell respiration) volume. For isolated mitochondria, the reaction medium consisted of 0.3 m Suc, 10 mm TES, pH 7, 5 mm KH2PO4, 10 mm NaCl, 2 mm MgSO4, and 0.1% [w/v] bovine serum albumin. Mitochondrial O2 uptake was measured with 10 mm succinate, 10 mm NADH, or 5 mm malate + 5 mm pyruvate in presence (state 3) or absence (state 4) of 0.1 mm ADP. Assays containing succinate also included 0.1 mm ATP to activate succinate dehydrogenase. For whole-cell respiration, the cell culture growth medium was used (Zhang et al., 1999). Cells were diluted to 4-mL final volume in fresh media to a final concentration of approximately 2.5 mg dry weight mL-1. The medium was assumed to contain an air-saturated O2 concentration of 240 μm. The redox state of UQ was measured voltametrically with glassy carbon and platinum electrodes, according to Moore et al. (1988). Treatments with SA, ASA, BA, and pHBA (Sigma) involved adding the appropriate amount of 1,000-fold concentrated stocks directly to the oxygen electrode chamber. Recovery assays were done by measuring O2 uptake with various substrates in state 3 and then in state 4 (after ADP had been phosphorylated and respiratory rates decreased). Assays were performed at the same time for the control and treated mitochondria using two oxygen electrodes. Control mitochondria were left untreated in the first oxygen electrode chamber, whereas SA to a final concentration of 5 mm was added directly to the second oxygen electrode chamber. After respiration rate was recorded for about 2 h, mitochondria in both chambers were collected separately by centrifugation, resuspended in fresh reaction medium, and placed back in the oxygen electrode chambers. O2 uptake was remeasured in state 3 and state 4 using the same substrate as before treatment.
Protein Extraction, Electrophoresis, and Western Blot
Cells were collected by filtration through four layers of Miracloth, snap frozen in liquid N2, and stored at -80°C until the protein extraction was performed. Frozen cells were ground to a fine powder in liquid N2 and acid-washed sand, using a mortar and pestle. The frozen powder was then resuspended in 0.5 m Tris-HCl, pH 7.5, 10 mm EDTA, 1% (w/v) Triton X-100, and 2% (v/v) β-mercaptoethanol and carefully solubilized. The solution was then centrifuged at 5,000g for 10 min, and the supernatant containing total cellular protein was collected. The protein concentration was estimated by a modified Lowry method (Peterson, 1977). Aliquots containing 50 μg of protein were separated by reducing SDS-PAGE, transferred to nitrocellulose membranes, and probed with appropriate antibodies (Kearns et al., 1992). Monoclonal antibodies against Aox protein from Sauromatum guttatum and against maize (Zea mays) porin protein were generously supplied by T.E. Elthon (University of Nebraska, Lincoln). Bound antibodies were detected using horseradish peroxidase-conjugated secondary antibodies (Amersham Biosciences, Sydney), in combination with a chemiluminescent substrate (BM Chemiluminescence blotting substrate [POD], Roche Diagnostics, Sydney, Australia) according to the manufacturers' instructions. The chemiluminescent signal was detected using a luminescent image analyzer (LAS-1000, Fujifilm, Tokyo) and quantified using the software Image Gauge (Fujifilm).
Extraction and Quantification of SA
Tobacco cells were collected by filtration under vacuum through four layers of Miracloth, snap frozen in liquid nitrogen, and kept at -80°C until the extraction was performed. SA was extracted from cells (0.5 g fresh weight of frozen tissue), separated by HPLC, and quantified by spectrofluorescence monitoring at 407 nm emission as described by Meuwly and Metraux (1993). All data were corrected for recovery of the internal standard o-anisic acid, which was added at the beginning of each extraction. Intracellular SA concentrations were estimated by assuming that it was equally distributed through the cell and that 1 g fresh weight is equivalent to 1 mL. Only the free SA was measured.
RNA Isolation
Total RNA was isolated from tobacco cells using the RNeasy Plant mini protocol (Qiagen, Clifton Hill) in combination with the RNase-free DNase kit (Qiagen) and the DNA-free kit (Ambion, Austin, TX) to remove contaminating genomic DNA. cDNA was prepared from 1 μg of total RNA sample, in duplicate, using random primers (p(dN)6; 100 pmol) and Expand Reverse Transcriptase according to the manufacturer's instructions (Roche Diagnostics). “No RT” controls were also prepared by omitting the reverse transcriptase enzyme from the reaction.
Real-Time PCR Analysis of Aox Transcript Level
Transcript levels of NtAox1, Wipk, Gnt35, Sagt, Pr1a, and Sipk, were assayed using the LightCycler and FastStart DNA Master SYBR Green I kit (Roche Diagnostics). Reactions were carried out in a total volume of 10 μL with a final concentration of 0.008% (w/v) bovine serum albumin under conditions optimized to minimize primer-dimer formation and maximize amplification efficiency. The LightCycler protocol consisted of four programs: denaturation, 95°C for 10 min; amplification, 40 cycles at 95°C for 15 s, 57°C for 5 s, 72°C for 8 s with single data acquisition; melting curve analysis, 95°C for 0 s, 70°C for 30 s, 95°C for 0 s with a transition rate of 0.1° Cs-1 and continuous data acquisition; cooling, 40°C for 30 s.
Standards were prepared from plasmids carrying each gene by PCR amplification using T7 and M13 reverse primers. Once purified, using the QIAquick PCR Purification kit (Qiagen), standards were accurately quantified using the PicoGreen dsDNA Quantification kit (Molecular Probes, Eugene, OR) and diluted to 0.01 fmol μL-1.
The sequences of nested primers designed for real-time PCR were: Aox1 LC-NtAox1-fwd, CAC TGC AAA TCA CTG AGG CG; LC-NtAox1-rev, GGT AAG TGA CGA AGT AGG CG; Aox2 LC-NtAox2-fwd, CAT CTG AGG TCG TTG CGC AAG; LC-NtAox2-rev, TTG GGG GAC AGC ACG TAA AGC; Wipk LC-Wipk-fwd, TCC GTG GCC TAA AAT ACA TAC A; LC-Wipk-rev, GAT CTT TTC CAC CAA ACA AAG G; Gnt35 LC-Gnt35-fwd, AAA TTC TTT GCG GGT GAC AA; LC-Gnt35-rev, CGG AAC GCG AAG CAA CAA C; Sagt LC-Sagt-fwd, AGA AGC AGA GCA AAT GGA AGA; LC-Sagt-rev, ACA GTG CGT GAG AAA ACA CC; Pr1a LC-Pr1a-fwd, GGC TGC AGA TTG TAA CCT CG; LC-Pr1a-rev, CCG AGT TAC GCC AAA CCA CC; Sipk LC-Sipk-fwd, GTT TGA TCT CCA ACT GAC A; and LC-Sipk-rev, GAA CCA ATA CAA GCG ATC C.
Before determining transcript abundance, the “no RT” controls were tested for genomic DNA contamination using the Wipk primers. No contamination was detected.
For Aox1 and Aox2, although primers were designed in regions of low identity, primer specificity was tested before cDNA samples were analyzed. Cross-reactivity between primers was established by amplification of the nonspecific templates, calculated relative to a standard curve of the specific template. For example, amplification of the Aox1 standard with both the Aox1 and Aox2 primers was compared. For both primer pairs, cross-reactivity was found to be insignificant. Transcript levels were assessed using 10-1 dilutions of the cDNA prepared from 1 μg of total tobacco cell RNA. Ten-fold serial dilutions of the appropriate standard were prepared and used to generate a standard curve from which transcript amounts in the cDNA samples were determined. Absence of primer-dimer and/or nonspecific product accumulation was checked by melting curve analysis and confirmed by agarose gel electrophoresis. Transcript abundance was quantified using the second derivative maximum method of the LightCycler v3.5 software (Roche Diagnostics), which determined the cycle at which each PCR reaction reached exponential amplification and, using the standard curve, assigned concentrations to each sample. From each cDNA preparation, each transcript was analyzed in duplicate.
Acknowledgments
We thank Vanessa Herald, Rose Barnes, and Elizabeth McLean for their technical assistance and Greg Cawthray for his assistance with the SA determinations. We also thank Dr. Patrick Finnegan for critical reading of the manuscript.
This work was supported by the Australian Research Council (grant to A.H.M, J.M.W., and D.A.D.) and by an Eric Lawrence Medical Research Scholarship to K.A.H.
Article, publication date, and citation information can be found at www.plantphysiol.org/cgi/doi/10.1104/pp.103.031039.
References
- Alvarez ME (2000) Salicylic acid in the machinery of hypersensitive cell death and disease resistance. Plant Mol Biol 44: 429-442 [DOI] [PubMed] [Google Scholar]
- Bi YM, Kenton P, Mur L, Darby R, Draper J (1995) Hydrogen peroxide does not function downstream of salicylic acid in the induction of PR protein expression. Plant J 8: 235-245 [DOI] [PubMed] [Google Scholar]
- Chen Z, Silva H, Klessig DF (1993) Active oxygen species in the induction of plant systemic acquired resistance by salicylic acid. Science 262: 1883-1886 [DOI] [PubMed] [Google Scholar]
- Chivasa S, Carr JP (1998) Cyanide restores N gene-mediated resistance to tobacco mosaic virus in transgenic tobacco expressing salicylic acid hydroxylase. Plant Cell 10: 1489-1498 [DOI] [PMC free article] [PubMed] [Google Scholar]
- Conrath U, Herman S, Klessig DF (1997) Protein dephosphorylation mediates salicylic acid-induced expression of PR-1 genes in tobacco. Plant J 11: 747-757 [Google Scholar]
- Day DA, Neuburger M, Douce R (1985) Biochemical characterisation of chlorophyll-free mitochondria from pea leaves. Aust J Plant Physiol 12: 219-228 [Google Scholar]
- Djajanegara I, Finnegan PM, Mathieu C, McCabe T, Whelan J, Day DA (2002) Regulation of alternative oxidase gene expression in soybean. Plant Mol Biol 50: 735-742 [DOI] [PubMed] [Google Scholar]
- Dry IB, Moore AL, Day DA, Wiskich JT (1989) Regulation of alternative pathway activity in plant mitochondria. Non-linear relationship between electron flux and the redox poise of the ubiquinone pool. Arch Biochem Biophys 273: 148-157 [DOI] [PubMed] [Google Scholar]
- Durner J, Klessig DF (1995) Inhibition of ascorbate peroxidase by salicylic acid and 2,6-dichloroisonicotinic acid, two inducers of plant defense responses. Proc Natl Acad Sci USA 92: 11312-11316 [DOI] [PMC free article] [PubMed] [Google Scholar]
- Garreton V, Carpinelli J, Jordana X, Holuigue L (2002) The as-1 promoter element is an oxidative stress-responsive element and salicylic acid activates it via oxidative species. Plant Physiol 130: 1516-1526 [DOI] [PMC free article] [PubMed] [Google Scholar]
- Gilliland A, Singh DP, Hayward JM, Moore CA, Murphy AM, York CJ, Slator J, Carr JP (2003) Genetic modification of alternative respiration has differential effects on antimycin A-induced versus salicylic acid-induced resistance to tobacco mosaic virus. Plant Physiol 132: 1518-1528 [DOI] [PMC free article] [PubMed] [Google Scholar]
- Hunt MD, Neuenschwander UH, Delaney TP, Weymann KB, Friedrich LB, Lawton KA, Steiner HY, Ryals JA (1996) Recent advances in systemic acquired resistance research: a review. Gene 179: 89-95 [DOI] [PubMed] [Google Scholar]
- Jorgensen TG, Weis-Fogh US, Nielsen HH, Olesen HP (1976) Salicylate- and aspirin-induced uncoupling of oxidative phosphorylation in mitochondria isolated from the mucosal membrane of the stomach. Scand J Clin Lab Investig 36: 649-654 [DOI] [PubMed] [Google Scholar]
- Jupin I, Chua NH (1996) Activation of the CaMV as-1 cis-element by salicylic acid: differential DNA-binding of a factor related to TGA1a. EMBO J 15: 5679-5689 [PMC free article] [PubMed] [Google Scholar]
- Kearns A, Whelan J, Young S, Elthon TE, Day DA (1992) Tissue specific expression of the alternative oxidase in soybean and siratro. Plant Physiol 99: 712-717 [DOI] [PMC free article] [PubMed] [Google Scholar]
- Klessig DF, Malamy J (1994) The salicylic acid signal in plants. Plant Mol Biol 26: 1439-1458 [DOI] [PubMed] [Google Scholar]
- Lee HI, Raskin I (1999) Purification, cloning, and expression of a pathogen inducible UDP-glucose:salicylic acid glucosyltransferase from tobacco. J Biol Chem 274: 36637-36642 [DOI] [PubMed] [Google Scholar]
- Lennon AM, Neuenschwander UH, Ribas-Carbo M, Giles L, Ryals JA, Siedow JN (1997) The effects of salicylic acid and tobacco mosaic virus infection on the alternative oxidase of tobacco. Plant Physiol 115: 783-791 [DOI] [PMC free article] [PubMed] [Google Scholar]
- Leslie CA, Romani RJ (1988) Inhibition of ethylene biosynthesis by salicylic acid. Plant Physiol 88: 833-837 [DOI] [PMC free article] [PubMed] [Google Scholar]
- Maxwell DP, Nickels R, McIntosh L (2002) Evidence of mitochondrial involvement in the transduction of signals required for the induction of genes associated with pathogen attack and senescence. Plant J 29: 269-279 [DOI] [PubMed] [Google Scholar]
- Maxwell DP, Wang Y, McIntosh L (1999) The alternative oxidase lowers mitochondrial reactive oxygen production in plant cells. Proc Natl Acad Sci USA 96: 8271-8276 [DOI] [PMC free article] [PubMed] [Google Scholar]
- McIntosh L, Eichler T, Gray G, Maxwell D, Nickels R, Wang Y (1998) Biochemical and genetic controls exerted by plant mitochondria. Biochim Biophys Acta 1365: 278-284 [Google Scholar]
- Meeuse BJD (1975) Thermogenic respiration in aroids. Annu Rev Plant Physiol 26: 117-126 [Google Scholar]
- Meuwly P, Metraux JP (1993) Ortho-anisic acid as internal standard for the simultaneous quantitation of salicylic acid and its putative biosynthetic precursors in cucumber leaves. Anal Biochem 214: 500-505 [DOI] [PubMed] [Google Scholar]
- Millar AH, Atkin OK, Lambers H, Wiskich JT, Day DA (1995) A critique of the use of inhibitors to estimate partitioning of electrons between mitochondrial respiratory pathways in plants. Physiol Plant 95: 523-532 [Google Scholar]
- Moore AL, Dry IB, Wiskich JT (1988) Measurement of the redox state of the ubiquinone pool in plant mitochondria. FEBS Lett 235: 76-80 [Google Scholar]
- Ordog SH, Higgins VJ, Vanlerberghe GC (2002) Mitochondrial alternative oxidase is not a critical component of plant viral resistance but may play a role in the hypersensitive response. Plant Physiol 129: 1858-1865 [DOI] [PMC free article] [PubMed] [Google Scholar]
- Parsons HL, Yip JY, Vanlerberghe GC (1999) Increased respiratory restriction during phosphate-limited growth in transgenic tobacco cells lacking alternative oxidase. Plant Physiol 121: 1309-1320 [DOI] [PMC free article] [PubMed] [Google Scholar]
- Peterson GL (1977) A simplification of the protein assay method of Lowry et al. which is more generally applicable. Anal Biochem 83: 346-356 [DOI] [PubMed] [Google Scholar]
- Rao MV, Davis KR (1999) Ozone-induced cell death occurs via two distinct mechanisms in Arabidopsis: the role of salicylic acid. Plant J 17: 603-614 [DOI] [PubMed] [Google Scholar]
- Raskin I, Ehmann A, Melander WR, Meeuse BJD (1987) Salicylic acid: a natural inducer of heat production in arum lilies. Science 237: 1601-1602 [DOI] [PubMed] [Google Scholar]
- Raskin I, Turner IM, Melander WR (1989) Regulation of heat production in the inflorescences of an Arum lily by endogenous salicylic acid. Proc Natl Acad Sci USA 86: 2214-2218 [DOI] [PMC free article] [PubMed] [Google Scholar]
- Rhoads DM, McIntosh L (1993) The salicylic acid-inducible alternative oxidase gene aox1 and genes encoding pathogenesis-related proteins share regions of sequence similarity in their promoters. Plant Mol Biol 21: 615-624 [DOI] [PubMed] [Google Scholar]
- Romeis T, Piedras P, Zhang S, Klessig DF, Hirt H, Jones JD (1999) Rapid Avr9- and Cf-9-dependent activation of MAP kinases in tobacco cell cultures and leaves: convergence of resistance gene, elicitor, wound, and salicylate responses. Plant Cell 11: 273-287 [DOI] [PMC free article] [PubMed] [Google Scholar]
- Senaratna T, Touchell D, Bunn T, Dixon K (2000) Acetyl salicylic acid (Aspirin) and salicylic acid induce multiple stress tolerance in bean and tomato plants. Plant Growth Regul 30: 157-161 [Google Scholar]
- Shirasu K, Nakajima H, Rajasekhar VK, Dixon RA, Lamb C (1997) Salicylic acid potentiates an agonist-dependent gain control that amplifies pathogen signals in the activation of defense mechanisms. Plant Cell 9: 261-270 [DOI] [PMC free article] [PubMed] [Google Scholar]
- Slaymaker DH, Navarre DA, Clark D, del Pozo O, Martin GB, Klessig DF (2002) The tobacco salicylic acid-binding protein 3 (SABP3) is the chloroplast carbonic anhydrase, which exhibits antioxidant activity and plays a role in the hypersensitive defense response. Proc Natl Acad Sci USA 99: 11640-11645 [DOI] [PMC free article] [PubMed] [Google Scholar]
- Stange C, Ramirez I, Gomez I, Jordana X, Holuigue L (1997) Phosphorylation of nuclear proteins directs binding to salicylic acid-responsive elements. Plant J 11: 1315-1324 [DOI] [PubMed] [Google Scholar]
- Van den Bergen CW, Wagner AM, Krab K, Moore AL (1994) The relationship between electron flux and the redox poise of the quinone pool in plant mitochondria: interplay between quinol-oxidizing and quinone-reducing pathways. Eur J Biochem 226: 1071-1078 [DOI] [PubMed] [Google Scholar]
- Van Der Straeten D, Chaerle L, Sharkov G, Lambers H, Van Montagu M (1995) Salicylic acid enhances the activity of the alternative pathway of respiration in tobacco leaves and induces thermogenicity. Planta 196: 412-419 [Google Scholar]
- Vanlerberghe GC, McIntosh L (1997) Alternative oxidase: from gene to function. Annu Rev Plant Physiol Plant Mol Biol 48: 703-734 [DOI] [PubMed] [Google Scholar]
- Vanlerberghe GC, Robson CA, Yip JY (2002) Induction of mitochondrial alternative oxidase in response to a cell signal pathway down-regulating the cytochrome pathway prevents programmed cell death. Plant Physiol 129: 1829-1842 [DOI] [PMC free article] [PubMed] [Google Scholar]
- Vanlerberghe GC, Vanlerberghe AE, McIntosh L (1994) Molecular genetic alteration of plant respiration (silencing and overexpression of alternative oxidase in transgenic tobacco). Plant Physiol 106: 1503-1510 [DOI] [PMC free article] [PubMed] [Google Scholar]
- Wagner AM, Moore AL (1997) Structure and function of the plant alternative oxidase: its putative role in the oxygen defence mechanism. Biosci Rep 17: 319-333 [DOI] [PubMed] [Google Scholar]
- Wagner AM, Wagner MJ (1997) Changes in mitochondrial respiratory chain components of petunia cells during culture in the presence of antimycin A. Plant Physiol 115: 617-622 [DOI] [PMC free article] [PubMed] [Google Scholar]
- Whelan J, Smith MK, Meijer M, Yu JW, Badger MR, Price GD, Day DA (1995) Cloning of an additional cDNA for the alternative oxidase in tobacco. Plant Physiol 107: 1469-1470 [DOI] [PMC free article] [PubMed] [Google Scholar]
- Xie Z, Chen Z (1999) Salicylic acid induces rapid inhibition of mitochondrial electron transport and oxidative phosphorylation in tobacco cells. Plant Physiol 120: 217-226 [DOI] [PMC free article] [PubMed] [Google Scholar]
- Yalpani N, Silverman P, Wilson TM, Kleier DA, Raskin I (1991) Salicylic acid is a systemic signal and an inducer of pathogenesis-related proteins in virus-infected tobacco. Plant Cell 3: 809-818 [DOI] [PMC free article] [PubMed] [Google Scholar]
- Yang Y, Shah J, Klessig DF (1997) Signal perception and transduction in plant defense responses. Gene Dev 11: 1621-1639 [DOI] [PubMed] [Google Scholar]
- Yip JY, Vanlerberghe GC (2001) Mitochondrial alternative oxidase acts to dampen the generation of active oxygen species during a period of rapid respiration induced to support a high rate of nutrient uptake. Physiol Plant 112: 327-333 [DOI] [PubMed] [Google Scholar]
- Zhang Q, Wiskich JT, Soole KL (1999) Respiratory activities in chloramphenicol-treated tobacco cells. Physiol Plant 105: 224-232 [Google Scholar]
- Zhang S, Du H, Klessig DF (1998) Activation of the tobacco SIP kinase by both a cell wall-derived carbohydrate elicitor and purified proteinaceous elicitins from Phytophthora spp. Plant Cell 10: 435-450 [DOI] [PMC free article] [PubMed] [Google Scholar]
- Zhang S, Klessig DF (1997) Salicylic acid activates a 48-kD MAP kinase in tobacco. Plant Cell 9: 809-824 [DOI] [PMC free article] [PubMed] [Google Scholar]
- Zhang S, Klessig DF (1998a) The tobacco wounding-activated mitogen-activated protein kinase is encoded by SIPK. Proc Natl Acad Sci USA 95: 7225-7230 [DOI] [PMC free article] [PubMed] [Google Scholar]
- Zhang S, Klessig DF (1998b) Resistance gene N-mediated de novo synthesis and activation of a tobacco mitogen-activated protein kinase by tobacco mosaic virus infection. Proc Natl Acad Sci USA 95: 7433-7438 [DOI] [PMC free article] [PubMed] [Google Scholar]