Diffusion tensor magnetic resonance imaging (DTI) is a relatively new technology that is popular for imaging the white matter of the brain. The goal of this review is to give a basic and broad overview of DTI such that the reader may develop an intuitive understanding of this type of data, and an awareness of its strengths and weaknesses. We have tried to include equations for completeness but they are not necessary for understanding the paper. Wherever possible, pointers will be provided to more in-depth technical articles or books for further reading. We especially recommend the new diffusion MRI textbook [1], the introductory paper on fiber tracts and tumors [2], the white matter atlas book [3], and the review of potential pitfalls in DTI analysis [4]. In the rest of this article we will address basic questions about DTI (the what, why, and how of DTI), followed by a discussion of issues in interpretation of DTI, and finally an overview of more advanced diffusion imaging methods and future directions.
1 Why DTI? A brief history of DTI and its impact on clinical research
The diffusion tensor was originally proposed for use in magnetic resonance imaging (MRI) by Peter Basser in 1994 [5, 6]. Before DTI, diffusion MRI [7, 8] had developed from research in diffusion nuclear magnetic resonance [9]. Prior to the introduction of the diffusion tensor model, to measure anisotropic diffusion the orientation of the axons in a tissue sample had to be known, so only fixed samples such as the axon of the giant squid could be scanned [10]. The introduction of the diffusion tensor model allowed, for the first time, a rotationally invariant description of the shape of water diffusion. The invariance to rotation was crucial because it enabled application of the DTI method to the complex anatomy of the fiber tracts in the human brain [11]. Note however, that the diffusion tensor is not able to fully describe crossing of the fiber tracts [12, 13].
The popularity of DTI has been enormous. It has been applied to a tremendous variety of neuroscientific studies (see reviews in [14, 15, 16]) including schizophrenia [17], traumatic brain injury [18], multiple sclerosis [19, 20], autism [21], and aging [22]. Anatomical investigations have been undertaken regarding for example the structure of the language network [23, 24], the asymmetry of the white matter in twins and siblings [25], and the location, asymmetry, and variability of the fiber tracts [26]. Recent investigations have attempted to model the human “connectome” by analyzing structural versus functional brain connectivity as measured by DTI and functional MRI [27, 28]. DTI has also been applied for neurosurgical planning and navigation. The addition of preoperative DTI to neuronavigation [29, 30, 31, 32] has been shown, in a large prospective study, to increase tumor resection and survival and to decrease neurologic morbidity [33].
2 What is DTI?
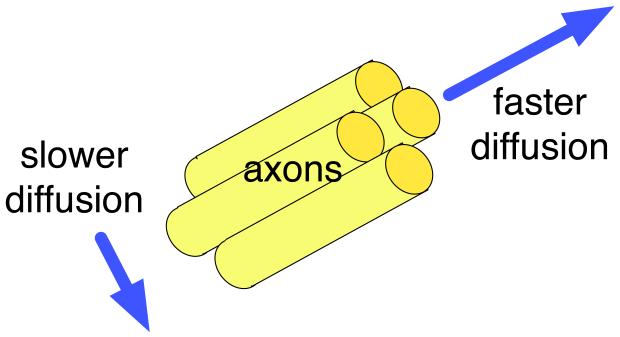
DTI is a sensitive probe of cellular structure that works by measuring the diffusion of water molecules. The measured quantity is the diffusivity or diffusion coefficient, a proportionality constant that relates diffusive flux to a concentration gradient [8] and has units of . Unlike the diffusion1 in a glass of pure water, which would be the same in all directions (isotropic), the diffusion measured in tissue varies with direction (is anisotropic). The measured macroscopic diffusion anisotropy is due to microscopic tissue heterogeneity [6]. In the white matter of the brain, diffusion anisotropy is primarily caused by cellular membranes, with some contribution from myelination and the packing of the axons [34, 35, 11]. Anisotropic diffusion can indicate the underlying tissue orientation (Figure 1).
Figure 1.
Illustration of anisotropic diffusion, in the ideal case of a coherently oriented tissue. This example compares the diffusion measured parallel and perpendicular to the axons in a white matter fiber tract.
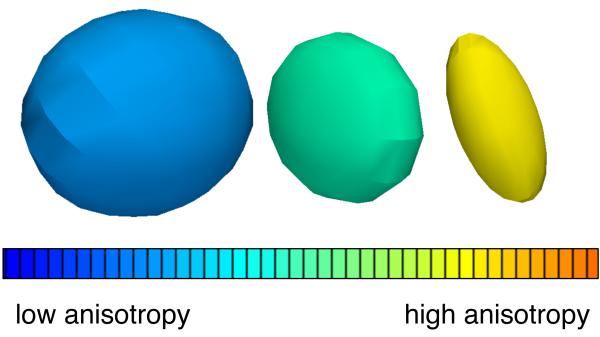
The diffusion tensor (DT) describes the diffusion of water molecules using a Gaussian model. Technically, it is proportional to the covariance matrix of a three-dimensional Gaussian distribution that models the displacements of the molecules. The DT is a 3×3 symmetric, positive-definite matrix, and these matrix properties mean that it has 3 orthogonal (mutually perpendicular) eigenvectors and three positive eigenvalues. The major eigenvector of the diffusion tensor points in the principal diffusion direction (the direction of the fastest diffusion). In anisotropic fibrous tissues the major eigenvector also defines the fiber tract axis of the tissue [6], and thus the three orthogonal eigenvectors can be thought of as a local fiber coordinate system. (Note this interpretation is only strictly true in regions where fiber tracts do not cross, fan, or branch.) The three positive eigenvalues of the tensor (λ1,λ2,λ3) give the diffusivity in the direction of each eigenvector. Together, the eigenvectors and eigenvalues define an ellipsoid that represents an isosurface of (Gaussian) diffusion probability: the axes of the ellipsoid are aligned with the eigenvectors and their lengths are [6]. Figure 2 shows 3 diffusion tensors chosen from different regions of the human brain to illustrate possible shapes of the ellipsoid.
Figure 2.
Three example diffusion tensors, selected from a DTI scan of the human brain to illustrate differences in tensor anisotropy and orientation.
3 How is DTI measured?
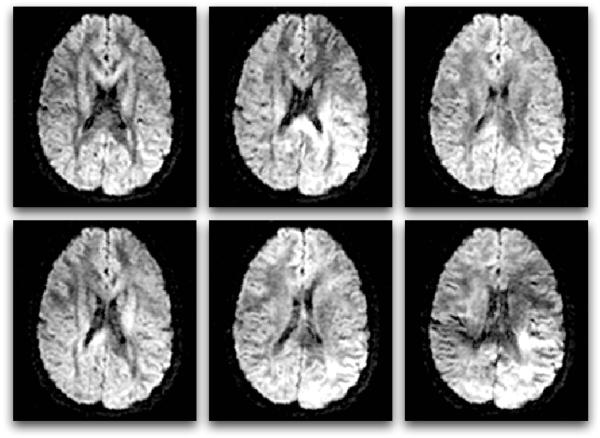
To measure diffusion using MRI, magnetic field gradients are employed to create an image that is sensitized to diffusion in a particular direction. By repeating this process of diffusion weighting in multiple directions, a three-dimensional diffusion model (the tensor) can be estimated. In simplified terms, diffusion imaging works by introducing extra gradient pulses whose effect “cancels out” for stationary water molecules, and causes a random phase shift for molecules that diffuse. Due to their random phase, signal from diffusing molecules is lost. This loss of signal creates darker voxels (volumetric pixels). This means that white matter fiber tracts parallel to the gradient direction will appear dark in the diffusion-weighted image for that direction (Figure 3).
Figure 3.
Six diffusion-weighted images (the minimum number required for tensor calculation). In diffusion MRI, magnetic field gradients are employed to sensitize the image to diffusion in a particular direction. The direction is different for each image, resulting in a different pattern of signal loss (dark areas) due to anisotropic diffusion.
Next, the decreased signal (Sk) is compared to the original signal (S0) to calculate the diffusion tensor (D) by solving the Stejskal-Tanner equation (1) [36]. This equation describes how the signal intensity at each voxel decreases in the presence of Gaussian diffusion:
| (1) |
Here S0 is the original image intensity at the voxel (measured with no diffusion-sensitizing gradient) and Sk is the intensity measured after the application of the kth diffusion-sensitizing gradient in the (unit) direction ĝk. The product represents the diffusion coefficient (diffusivity) in direction ĝk. Note that because the entire set of diffusion-weighted images is used (giving many values for Sk and ĝk), this is actually a system of equations that is solved for D, the diffusion tensor. In order to calculate the 6 independent numbers in the 3×3 symmetric matrix D, at least 7 images are needed: 6 diffusion-weighted images from 6 gradient directions (giving 6 values for Sk) plus one baseline image (giving S0). But in clinical research today a higher number of images are almost always used. The above system of equations can be solved via the least squares method at each voxel.
Equation (1) also contains b, LeBihan’s factor describing the pulse sequence, gradient strength, and physical constants [9]. The b-factor is near for the image S0 which is T2-weighted, and the b-factor is near 1,000 for the diffusion-weighted images Sk in DTI. For rectangular gradient pulses the b-factor is defined by , where γ is the proton gyromagnetic ratio (42 MHz/Tesla), ∣g∣ is the strength of the diffusion sensitizing gradient pulses, δ is the duration of the diffusion gradient pulses, and Δ is the time between diffusion gradient RF pulses [37].
We refer the reader to [8] for information on the MR physics of DTI and [5, 37] for more information on the tensor calculation process. For a comparison of tensor calculation methods (including least squares and weighted least squares) in the presence of noise see [38].
4 How is DTI displayed?
DTI is usually displayed by either condensing the information contained in the tensor into one number (a scalar), or into 4 numbers (to give an R,G,B color and a brightness value). The diffusion tensor can also be viewed using glyphs, which are small 3D representations of the major eigenvector or whole tensor. Finally, DTI is often viewed by estimating the course of white matter tracts through the brain via a process called tractography.
4.1 Scalars derived from DTI
In this section we will describe commonly used scalar quantities, which can be divided into two categories: diffusion magnitude measures and anisotropy measures. We will use λ1≥λ2≥λ3≥0 to refer to the eigenvalues of the symmetric, positive-definite diffusion tensor D. For the original paper that measured and compared several scalar measures, as well as the eigenvalues, in different regions of the human brain see [11].
4.1.1 Measures of Diffusion Magnitude
The simplest and possibly most useful scalar is the average of the tensor’s eigenvalues. This average may be referred to as the mean diffusivity, or MD [39]; the bulk mean diffusivity, or □D□ [40]; or the apparent diffusion coefficient (ADC) map. Note that in clinical imaging ADC maps may be measured using fewer diffusion gradients than needed for the tensor. A similar quantity to the MD is the sum of the eigenvalues, called the trace of the tensor.
The trace and MD relate to the total amount of diffusion in a voxel, which is related to the amount of water in the extracellular space. The trace is clinically useful in early stroke detection because it is sensitive to the initial cellular swelling (cytotoxic edema) which restricts diffusion [41]. In the normal human brain, the trace is high in cerebrospinal fluid, around , and relatively constant in normal brain parenchyma (white and gray matter), between and [11]. For comparison, the self-diffusion coefficient of water (the diffusivity measured in pure water without any tissue) at body temperature of 37□C is [42], which would give a trace of . The MD and trace measured in ventricles or in edema can be higher than in water due to fluid flow or enhanced perfusion, respectively [43].
4.1.2 Measures of diffusion anisotropy
Tensor anisotropy measures are ratios of the eigenvalues that are used to quantify the shape of the diffusion. These measures are useful for describing the amount of tissue organization and for locating voxels likely to contain a single white matter tract (without crossing or fanning). The following measures are normalized and all range from 0 to 1, except for the mode, which ranges from −1 to +1.
The fractional anisotropy, or FA [44], is the most widely used anisotropy measure. Its name comes from the fact that it measures the fraction of the diffusion that is anisotropic. This can be thought of as the difference of the tensor ellipsoid’s shape from that of a perfect sphere. FA is basically a normalized variance of the eigenvalues:
| (2) |
where ^λ is the mean diffusivity. FA is often considered a measure of “white matter integrity” though changes in FA may be caused by many factors.
Three intuitive measures are CL, CP, and CS: the linear, planar, and spherical shape measures [37, 45]. They describe whether the shape of diffusion is like a cigar (linear), pancake (planar), or sphere (spherical).
| (3) |
| (4) |
| (5) |
In voxels with high planar or spherical measure, the principal eigenvector will not always match an underlying fiber tract direction (where tracts cross the eigenvector may point to neither one). But if the largest eigenvalue is much larger than the other two eigenvalues, the linear measure will be large, giving evidence for the presence of a single fiber tract. Note that these measures can be normalized by λ1, by the trace, or by .
While FA measures how far the tensor is from a sphere, another complementary measure discriminates between linear and planar anisotropy. This information is given by the mode, a quantity that is mathematically orthogonal to the FA measure and relates to the skewness of the eigenvalues2 [46].
| (6) |
The parallel diffusivity measure, also called the axial diffusivity, is equal to the largest eigenvalue. The perpendicular diffusivity measure, also called the radial diffusivity, is equal to the average of the two smaller eigenvalues. These measures are interpreted as diffusivity parallel to and perpendicular to a white matter fiber tract, so they make the most sense in regions of coherently oriented axons with no fiber crossings.
Often in scientific studies, the reported measures from the diffusion tensor are not independent. However, complete sets of orthogonal (mathematically independent) scalars have been defined [46, 47].
4.2 Colors derived from DTI
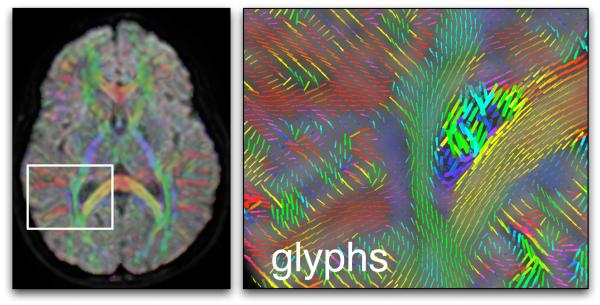
Another type of image can represent the major eigenvector field using a mapping to colors (Figure 5). The color scheme most commonly used to represent the orientation of the major eigenvector works as follows: blue is superior-inferior, red is left-right, and green is anterior-posterior [48]. To enhance visualization of the white matter and suppress information outside of it, the brightness of the color is usually controlled by tensor anisotropy (FA).
Figure 5.
An example using glyphs and colors for DTI visualization. On the left an axial image plane, showing the average diffusion-weighted image with semi-transparent color overlay indicating the major eigenvector orientation, and a white square indicating the zoomed-in area (right image). In both images the color red indicates right-left orientation, blue is superior-inferior, and green is anterior-posterior. The right image contains glyphs representing major eigenvector orientations (and scaled by the largest eigenvalue) in the region of the corpus callosum (yellow and red) and right lateral ventricle. The cingulum can be seen in blue, and the posterior limb of the internal capsule in green.
4.3 Glyphs derived from DTI
Small three-dimensional objects called glyphs can be used to display information from each tensor eigensystem. Example glyphs include “sticks” representing the orientation of the major eigenvector, ellipsoids related to the diffusion isoprobability surfaces [6], and superquadric tensor glyphs [49].
4.4 Tractography
The word tractography refers to any method for estimating the trajectories of the fiber tracts in the white matter. For a clinical and technical overview of tractography in neurological disorders see [15]. For reviews of tractography techniques including explanations of common tractography artifacts and a comparison of methods see [50, 51]. Many methods have been proposed for tractography, and the results will vary enormously depending on the chosen method.
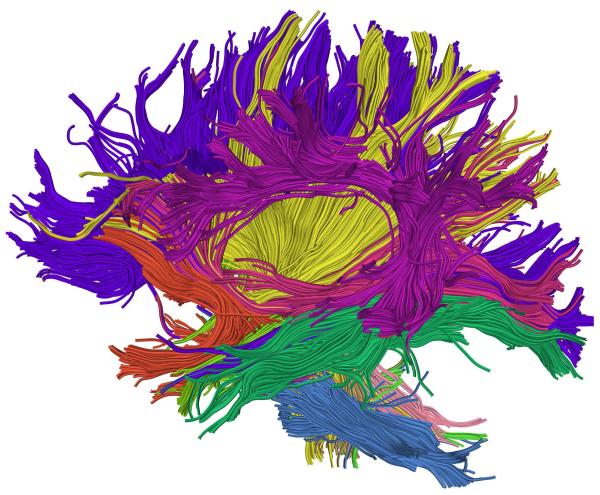
The most common approach is streamline tractography (Figure 6) [52, 53, 54, 55], which is closely related to an earlier method for visualization of tensor fields known as hyperstreamlines [56]. This method produces as output discrete curves or trajectories that are also called “tracts,” “fibers,” “traces,” etc. The streamline tract-tracing approach works by successively stepping in the direction of the principal eigenvector (the direction of fastest diffusion). The eigenvectors are thus tangent to the trajectory that is produced. A fixed step size of one millimeter or less (smaller than a voxel) is generally used for DTI data.
Figure 6.
Example whole-brain streamline DTI tractography. Colors were assigned automatically according to an atlas-based tractography segmentation method [60].
Several computational methods can be used to perform basic streamline tractography. These include Euler’s method (following the eigenvector or tangent for a fixed step size), second order Runge-Kutta (also known as the midpoint method, where the tangent is followed for half a step, then a new tangent is calculated at the midpoint of the interval and used to take the full step), and fourth order Runge-Kutta (where the weighted average of four estimated tangents to the curve is used when taking each step) [57]. The application of the Euler and Runge-Kutta methods to white matter tractography was explored in [52, 53]. Another popular method is called FACT [54]. Some related methods attempt to introduce “inertia” when tracking through regions of planar anisotropy (likely fiber crossings). These methods modulate the incoming tangent direction by the tensor instead of directly using the major eigenvector of the tensor [58, 59, 55, 37].
Figure 6: Example whole-brain streamline DTI tractography. Colors were assigned automatically according to an atlas-based tractography segmentation method [60].
Processing DTI data to display fiber tract(s) of interest requires expert knowledge or an automatic algorithm. After performing streamline tractography the fiber trajectories of interest can be interactively selected by “virtual dissection,” where inclusion/exclusion regions are defined and used to select trajectories [61, 62, 3]. Automated methods for atlas-based tractography segmentation, that use prior knowledge to select trajectories, have also been developed [63, 60, 64, 65, 66, 67, 68].
In addition to streamline tractography, there are many other methods [50, 51]. A few selected examples include probabilistic tractography that outputs connection strengths or probabilities [69, 70], optimization methods that use graph theory or physical models [71, 72], region-growing and wavefront evolution methods [73], tractography using advanced models for fiber crossings [74, 75, 76, 77], and tractography “meta-analysis” methods that perform clustering or fit more sophisticated tract models [60, 78, 79, 80].
Tractography methods can produce false positive and false negative results (see next section), however it is important to note that clinical validations of streamline tractography have demonstrated accurate reconstructions (true positive results). Tract endpoints, especially of the corticospinal or motor tract, have been compared to electrocortical stimulation during neurosurgery [81, 82] with good correspondence. In a study of 238 neurosurgical patients with gliomas involving the motor tract, where patients were randomly assigned to study or control groups, DTI was shown to increase survival and reduce postoperative motor deficits [33].
5 Issues in interpreting DTI data
Here we present two issues that are relevant to the clinical interpretation or meaning of the DTI data. For a more thorough treatment including additional information about scanning and processing pitfalls, we refer the reader to a recent paper by Derek Jones [4].
5.1 Scale of diffusion measurements versus axons
The measured diffusion effects are averaged over a voxel (three-dimensional pixel), complicating the biophysical interpretation of the diffusion tensor [83, 84]. For example, in scientific studies FA is often interpreted as “white matter integrity,” however many factors (e.g. cell death, change in myelination, increase in extracellular or intracellular water, etc.) may cause changes in FA. Overall, this difficulty in interpretation of DTI is due to the fact that the scale at which diffusion is measured with DTI is very different from the size scale of individual axons. To give an idea of the complexity of the human brain and the size/time scales of the diffusion imaging experiment, Table 1 lists relevant quantities such as the number of neurons in the brain (1011) and the distance over which water diffuses during an imaging experiment (1-15 μm, a distance similar to the diameter of an axon).
Table 1.
The scale of DTI and the brain: neuron sizes and quantities, and water diffusion times and distances.
| Quantity | Measurement | Reference |
|---|---|---|
| axon packing density (pyramidal tract) |
Error! | [11] |
| axon packing density (corpus callosum) |
338,000/mm2 | [11] |
|
| ||
| axon diameter (pyramidal tract) | 26 μm | [11] |
| axon diameters in central nervous system |
0.2 to 20 μm | [85] |
| neuron cell body diameter | 50 μm or more | [85] |
|
| ||
| voxel size in diffusion MRI | 2.5×2.5×2.5 mm | |
| typical diffusion time in DTI | 30–100ms | [42, 34] |
| mean water diffusion distance | 1-15 μm (in 50-100 ms) |
[42] |
|
| ||
| number of neurons in human brain |
100 billion (1011) | [85] |
| synaptic connections per axon | up to 1,000 | [85] |
5.2 False positive or negative tractography
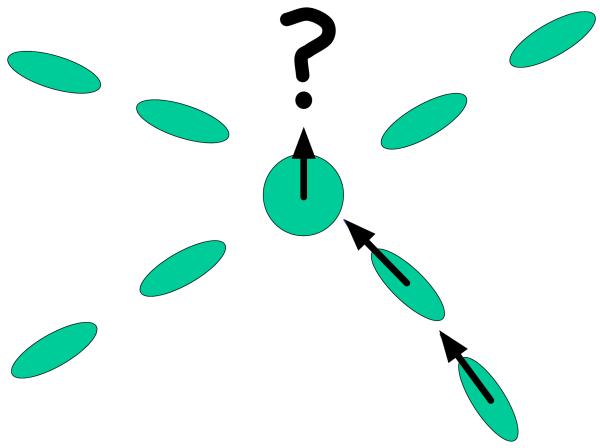
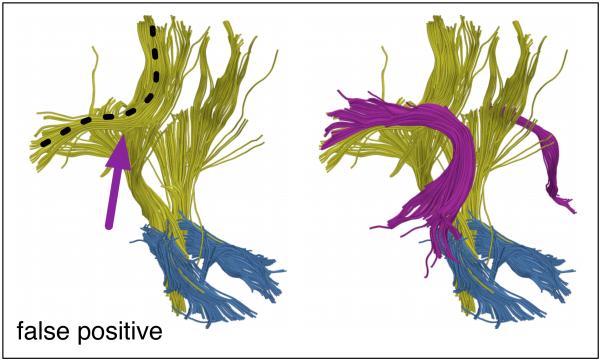
The tensor model is only able to represent one major fiber direction in a voxel, thus DTI tractography can be confounded by regions of crossing fibers, as demonstrated schematically in Figure 7. A significant fraction of WM voxels in the brain contains multiple fiber bundles oriented in different directions, where the diffusion tensor model is not reliable [74]. Other factors can confound tractography. Partial volume effects, where two types of tissue are present in a voxel, can produce a tensor that represents neither tissue well [83]. Also, crossing, “kissing”, and “fanning” fiber tracts [12] are not represented well at the voxel level by the diffusion tensor. Finally, in standard streamline tractography all decisions are made locally, thus errors can accumulate.
Figure 7.
The major eigenvector may not be aligned with a fiber tract in the case of crossing fibers.
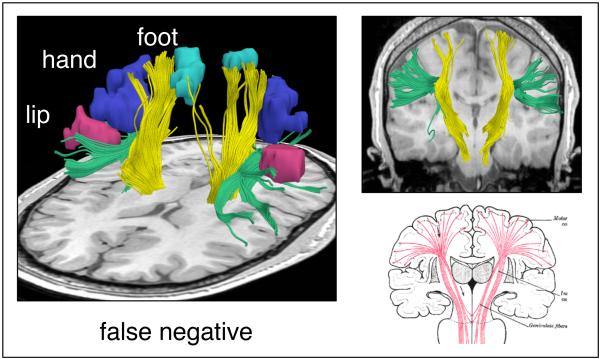
These issues may cause false positive and false negative connections. Common false positive connections include trajectories from the corona radiata that cross the corpus callosum and trajectories from the corona radiata that cross at the pons and ascend in the corona radiata of the other hemisphere. Common false negatives with DTI tractography are the lateral lip/hand connections of the corticospinal tract [50, 74] and lateral connections of the corpus callosum [75].
The particular errors depend strongly on the tractography algorithm employed, and on the type of diffusion data used (DTI versus higher-order models). However, to date there is no perfect method, and it is unlikely that perfect tractography is possible. This is due to the fact that even perfect diffusion MRI data would not solve the “peak selection” problem. At each step a direction must be chosen to follow for the next step, and with a more detailed model than the tensor, this requires some logical heuristic such as choosing the closest direction to the current direction.
6 Advances beyond the diffusion tensor
New diffusion models, scanning paradigms, and analysis methods are continually being developed for diffusion MRI. Here we list some popular advances.
High angular resolution diffusion imaging (HARDI) includes methods that acquire diffusion data using many more than 6 diffusion directions (such as 32 or higher) [86]. These methods generally use a higher b-value than the standard 1,000 for DTI, and/or multiple b-values (multiple “shells” of data). Multi-shell acquisitions enable description of the full diffusion function using measures such as displacement, zero-probability and kurtosis that are highly sensitive to myelin [87, 88]. Another type of multiple b-value acquisition is diffusion spectrum imaging (DSI) [89]. Diffusion models that go beyond DTI have been proposed to extract important biomarkers such as compartmentalization [90, 91, 83, 13] and axon diameter [92]. Higher rank tensor models have been proposed to extend DTI [93]. Employment of multiple pairs of diffusion gradients (double pulsed field gradient diffusion MRI) has been shown to increase sensitivity to small size scales [94, 95]. Diffusion MRI data analysis has benefited from the introduction of novel tractography methods (see Tractography section above), many types of white matter atlas [63, 60, 64, 65, 66, 67, 68], advanced tract-based quantification methods [96, 78, 79, 80], new visualization methods [97], and new scalar measures [46, 98].
7 Conclusion
DTI is an increasingly prevalent and popular imaging modality that has been applied to numerous scientific studies and clinical problems since its invention just over 15 years ago. We expect that the field will benefit from many future advances in diffusion imaging and analysis.
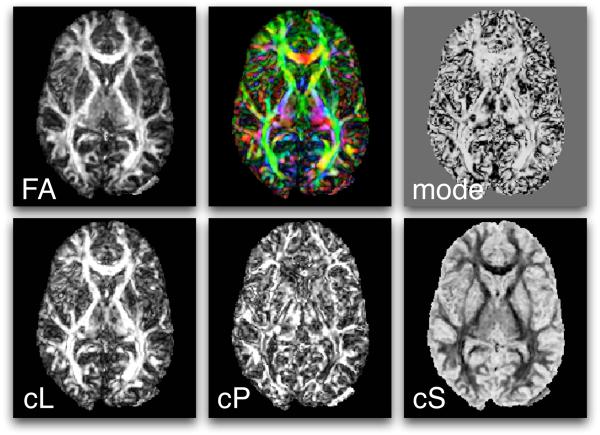
Figure 4.
Scalar measures derived from DTI include FA, mode, CL, CP, and CS. Also shown (top row, middle) is a mapping of the major eigenvector orientation to colors. See the text for more information about the definition of these measures.
Figure 8.
Example false negative streamline tractography error. The motor fibers (yellow) do not reach all functional magnetic resonance (fMRI) motor activations (aqua, blue, and pink) due in part to the superior longitudinal fasciculus (green) that runs perpendicular to the motor tract. In the right column are coronal views of the typical streamline tractography result (top) and expected anatomy (bottom).
Figure 9.
Example false positive streamline tractography error. In the left image, fibers (yellow with black dotted line) have traced parts of two anatomical structures by incorrectly crossing from one to the other (at arrow). In the right image, both structures (arcuate fasciculus in magenta and corona radiata in yellow) can be seen.
Acknowledgments
We acknowledge the following support: R25CA089017 (LJO), NIH R01MH074794 and NIH P41RR013218 (CFW).
Footnotes
Technically this is called self-diffusion due to the absence of a concentration gradient.
Thanks to Gordon Kindlmann for the fully simplified formula expressed as a function of the eigenvalues.
Contributor Information
Lauren J. O’Donnell, Laboratory of Mathematics in Imaging (LMI) and Golby Neurosurgical Brain Mapping Laboratory Department of Radiology, Brigham and Women’s Hospital, Harvard Medical School, Boston, MA.
Carl-Fredrik Westin, Laboratory of Mathematics in Imaging (LMI) Department of Radiology, Brigham and Women’s Hospital, Harvard Medical School, Boston, MA
References
- [1].Johansen-Berg Heidi, Behrens Timothy E.J., editors. Diffusion MRI: from quantitative measurement to in-vivo neuroanatomy. Elsevier; 2009. [Google Scholar]
- [2].Jellison Brian J., Field Aaron S., Medow Joshua, Lazar Mariana, Salamat M. Shariar, Alexander Andrew L. Diffusion Tensor Imaging of Cerebral White Matter: A Pictorial Review of Physics, Fiber Tract Anatomy, and Tumor Imaging Patterns. American Journal of Neuroradiology. 2004;25:356–369. [PMC free article] [PubMed] [Google Scholar]
- [3].Oishi Kenichi, Faria Andreia V., Zijl Peter C.M., Mori Susumu. MRI Atlas of Human White Matter. Elsevier; 2010. [Google Scholar]
- [4].Jones DK, Cercignani M. Twenty-five pitfalls in the analysis of diffusion MRI data. NMR in Biomedicine. 2010;23:803–820. doi: 10.1002/nbm.1543. [DOI] [PubMed] [Google Scholar]
- [5].Basser Peter J., Mattiello James, LeBihan Denis. Estimation of the effective self-diffusion tensor from the NMR spin echo. (Series B).Journal of Magnetic Resonance. 1994;103:247–254. doi: 10.1006/jmrb.1994.1037. [DOI] [PubMed] [Google Scholar]
- [6].Basser Peter J., Mattiello James, LeBihan Denis. MR Diffusion Tensor Spectroscopy and Imaging. Biophysical Journal. 1994;66:259–267. doi: 10.1016/S0006-3495(94)80775-1. [DOI] [PMC free article] [PubMed] [Google Scholar]
- [7].Le Bihan D, Breton E, Lallemand D, Grenier P, Cabanis E, Laval-Jeantet M. MR imaging of intravoxel incoherent motions: application to diffusion and perfusion in neurologic disorders. Radiology. 1986;161:401–407. doi: 10.1148/radiology.161.2.3763909. [DOI] [PubMed] [Google Scholar]
- [8].Le Bihan D, Basser PJ. Diffusion and perfusion magnetic resonance imaging: Applications to functional MRIch. Raven Press; 1995. Molecular diffusion and nuclear magnetic resonance; pp. 5–17. [Google Scholar]
- [9].LeBihan D. Molecular diffusion nuclear magnetic resonance imaging. Magn Reson Q. 1991;7:1–30. [PubMed] [Google Scholar]
- [10].Beaulieu Christian, Allen Peter S. Water diffusion in the giant axon of the squid: Implications for diffusio n-weighted MRI of the nervous system. Magnetic Resonance in Medicine. 1994;32:579–583. doi: 10.1002/mrm.1910320506. [DOI] [PubMed] [Google Scholar]
- [11].Pierpaoli C, Jezzard P, Basser PJ, Barnett A, Di Chiro G. Diffusion tensor MR imaging of the human brain. Radiology. 1996;201:637. doi: 10.1148/radiology.201.3.8939209. [DOI] [PubMed] [Google Scholar]
- [12].Wiegell Mette R., Larsson Henrik B. W., Wedeen Van J. Fiber Crossing in Human Brain Depicted with Diffusion Tensor MR Imaging1. Radiology. 2000;217:897–903. doi: 10.1148/radiology.217.3.r00nv43897. [DOI] [PubMed] [Google Scholar]
- [13].Tuch DS. High angular resolution diffusion imaging reveals intravoxel white matter fiber heterogeneity. Magn. Reson. Med. 2002;48:577–582. doi: 10.1002/mrm.10268. [DOI] [PubMed] [Google Scholar]
- [14].Horsfield Mark A., Jones Derek K. Applications of diffusion-weighted and diffusion tensor MRI to white matt er diseases – a review. NMR in Biomedicine. 2002;15:570–577. doi: 10.1002/nbm.787. [DOI] [PubMed] [Google Scholar]
- [15].Ciccarelli Olga, Catani Marco, Johansen-Berg Heidi, Clark Chris, Thompson Alan. Diffusion-based tractography in neurological disorders: concepts, applications, and future developments. The Lancet Neurology. 2008;7:715–727. doi: 10.1016/S1474-4422(08)70163-7. [DOI] [PubMed] [Google Scholar]
- [16].Assaf Yaniv, Pasternak Ofer. Diffusion Tensor Imaging (DTI)-based White Matter Mapping in Brain Research : A Review. Journal of molecular neuroscience. 2008;34:51–61. doi: 10.1007/s12031-007-0029-0. Anglais. [DOI] [PubMed] [Google Scholar]
- [17].Kubicki Marek, McCarley Robert, Westin C-F, et al. A review of diffusion tensor imaging studies in schizophrenia. Journal of Psychiatric Research. 2007;41:15–30. doi: 10.1016/j.jpsychires.2005.05.005. [DOI] [PMC free article] [PubMed] [Google Scholar]
- [18].Maller Jerome J., Thomson Richard H.S., Lewis Philip M., Rose Stephen E., Pannek Kerstin, Fitzgerald Paul B. Traumatic brain injury, major depression, and diffusion tensor imaging: Making connections. Brain Research Reviews. 2010;64:213–240. doi: 10.1016/j.brainresrev.2010.04.003. [DOI] [PubMed] [Google Scholar]
- [19].Inglese M, Bester M. Diffusion imaging in multiple sclerosis: research and clinical implications. NMR in Biomedicine. 2010;23:865–872. doi: 10.1002/nbm.1515. [DOI] [PMC free article] [PubMed] [Google Scholar]
- [20].Filippi M, Agosta F. Imaging biomarkers in multiple sclerosis. Journal of Magnetic Resonance Imaging. 2010;31:770–788. doi: 10.1002/jmri.22102. [DOI] [PubMed] [Google Scholar]
- [21].Lange Nicholas, DuBray Molly B., Lee Jee Eun, et al. Atypical diffusion tensor hemispheric asymmetry in autism. Autism Research. 2010 doi: 10.1002/aur.162. n/a–n/a. [DOI] [PMC free article] [PubMed] [Google Scholar]
- [22].Westlye Lars T., Walhovd Kristine B., Dale Anders M., et al. Life-Span Changes of the Human Brain White Matter: Diffusion Tensor Imaging (DTI) and Volumetry. Cerebral Cortex. 2010;20:2055–2068. doi: 10.1093/cercor/bhp280. [DOI] [PubMed] [Google Scholar]
- [23].Catani M, Jones DK. Perisylvian language networks of the human brain. Annals of neurology. 2005;57:8–16. doi: 10.1002/ana.20319. others. [DOI] [PubMed] [Google Scholar]
- [24].Glasser Matthew F., Rilling James K. DTI Tractography of the Human Brain’s Language Pathways. Cerebral Cortex. 2008;18:2471–2482. doi: 10.1093/cercor/bhn011. [DOI] [PubMed] [Google Scholar]
- [25].Jahanshad Neda, Lee Agatha D., Barysheva Marina, et al. Genetic influences on brain asymmetry: A DTI study of 374 twins and siblings. NeuroImage. 2010;52:455–469. doi: 10.1016/j.neuroimage.2010.04.236. [DOI] [PMC free article] [PubMed] [Google Scholar]
- [26].Schotten Michel Thiebaut, ffytche Dominic H., Bizzi Alberto, et al. Atlasing location, asymmetry and inter-subject variability of white matter tracts in the human brain with MR diffusion tractography. NeuroImage. 2011;54:49–59. doi: 10.1016/j.neuroimage.2010.07.055. [DOI] [PubMed] [Google Scholar]
- [27].Sporns O, Tononi G, Kotter R. The human connectome: a structural description of the human brain. PLoS Comput Biol. 2005;1:e42. doi: 10.1371/journal.pcbi.0010042. [DOI] [PMC free article] [PubMed] [Google Scholar]
- [28].Honey CJ, Sporns O, Cammoun L, et al. Predicting human resting-state functional connectivity from structural connectivity. Proceedings of the National Academy of Sciences. 2009;106:2035. doi: 10.1073/pnas.0811168106. [DOI] [PMC free article] [PubMed] [Google Scholar]
- [29].Talos Ion-Florin, O’Donnell Lauren, Westin Carl-Fredrik, et al. Diffusion tensor and functional MRI fusion with anatomical MRI for image-guided neurosurgery. Medical Image Computing and Computer-Assisted Intervention-MICCAI. 2003:407–415. [Google Scholar]
- [30].Nimsky C, Ganslandt O, Fahlbusch R. Implementation of fiber tract navigation. Neurosurgery. 2006;58 doi: 10.1227/01.NEU.0000204726.00088.6D. [DOI] [PubMed] [Google Scholar]
- [31].Bello Lorenzo, Gambini Anna, Castellano Antonella, et al. Motor and language DTI Fiber Tracking combined with intraoperative subcortical mapping for surgical removal of gliomas. Neuroimage. 2008;39:369–382. doi: 10.1016/j.neuroimage.2007.08.031. [DOI] [PubMed] [Google Scholar]
- [32].Golby AJ, Kindlmann G, Norton I, Yarmarkovich A, Pieper S, Kikinis R. Interactive Diffusion Tensor Tractography Visualization for Neurosurgical Planning. Neurosurgery. 2010 doi: 10.1227/NEU.0b013e3182061ebb. In Press. [DOI] [PMC free article] [PubMed] [Google Scholar]
- [33].Wu JS, Zhou LF, Tang WJ, et al. Clinical evaluation and follow-up outcome of diffusion tensor imaging-based functional neuronavigation: a prospective, controlled study in patients with gliomas involving pyramidal tracts. Neurosurgery. 2007;61:935. doi: 10.1227/01.neu.0000303189.80049.ab. [DOI] [PubMed] [Google Scholar]
- [34].Beaulieu Christian. The basis of anisotropic water diffusion in the nervous system - a technical review. NMR IN BIOMEDICINE. 2001;15:435–455. doi: 10.1002/nbm.782. [DOI] [PubMed] [Google Scholar]
- [35].Sen Pabitra N., Basser Peter J. A Model for Diffusion in White Matter in the Brain. Biophysical Journal. 2005;89:2927–2938. doi: 10.1529/biophysj.105.063016. [DOI] [PMC free article] [PubMed] [Google Scholar]
- [36].Basser PJ. Inferring microstructural features and the physiological state of tissues from diffusion-weighted images. NMR in Biomedicine. 1995;8:333–344. doi: 10.1002/nbm.1940080707. [DOI] [PubMed] [Google Scholar]
- [37].Westin C-F, Maier SE, Mamata H, Nabavi A, Jolesz FA, Kikinis R. Processing and Visualization of Diffusion Tensor MRI. Medical Image Analysis. 2002;6:93–108. doi: 10.1016/s1361-8415(02)00053-1. [DOI] [PubMed] [Google Scholar]
- [38].Goodlett C, Fletcher PT, Lin W, Gerig G. Quantification of measurement error in DTI: theoretical predictions and validation. Proceedings of the 10th international conference on Medical image computing and computer-assisted intervention-Volume Part I; Springer-Verlag; 2007. pp. 10–17. [DOI] [PubMed] [Google Scholar]
- [39].Le Bihan Denis, Mangin Jean-Francois, Poupon Cyril, et al. Diffusion Tensor Imaging: Concepts and Applications. Journal of Magnetic Resonance Imaging. 2001;13:534–546. doi: 10.1002/jmri.1076. [DOI] [PubMed] [Google Scholar]
- [40].Basser Peter J., Jones Derek K. Diffusion-tensor MRI: theory, experimental design and data analysis – a technical review. NMR in Biomedicine. 2002;15:456–467. doi: 10.1002/nbm.783. [DOI] [PubMed] [Google Scholar]
- [41].Schlaug G, Siewert B, Benfield A, Edelman RR, Warach S. Time course of the apparent diffusion coefficient (ADC) abnormality in human stroke. Neurology. 1997;49:113–119. doi: 10.1212/wnl.49.1.113. [DOI] [PubMed] [Google Scholar]
- [42].Le Bihan Dennis. Looking Into the Functional Architecture of the Brain with Diffusion MRI. Nature Reviews. Neuroscience. 2003;4:469–480. doi: 10.1038/nrn1119. [DOI] [PubMed] [Google Scholar]
- [43].LeBihan D, Breton E, Lallemand D, Grenier P, Cabanis E, Laval–Jeantet M. MR imaging of intravoxel incoherent motions: application to diffusion and perfusion in neurologic disorders. Radiology. 1986;161:401–407. doi: 10.1148/radiology.161.2.3763909. [DOI] [PubMed] [Google Scholar]
- [44].Basser PJ, Pierpaoli C. Microstructural and Physiological Features of Tissues Elucidated by Quantitative-Diffusion-Tensor MRI. J. Magn. Reson. Ser. B. 1996;111:209–219. doi: 10.1006/jmrb.1996.0086. [DOI] [PubMed] [Google Scholar]
- [45].Westin C-F, Peled S, Gudbjartsson H, Kikinis R, Jolesz FA. Geometrical Diffusion Measures for MRI from Tensor Basis Analysis. ISMRM 97; Vancouver, Canada. 1997. [Google Scholar]
- [46].Ennis Daniel B., Kindlmann Gordon. Orthogonal tensor invariants and the analysis of diffusion tensor magnetic resonance images. Magnetic Resonance in Medicine. 2006;55:136–146. doi: 10.1002/mrm.20741. [DOI] [PubMed] [Google Scholar]
- [47].Kindlmann Gordon, Ennis Daniel B., Whitaker Ross T., Westin Carl-Fredrik. Diffusion Tensor Analysis with Invariant Gradients and Rotation Tangents. IEEE Transactions on Medical Imaging. 2007;26:1483–1499. doi: 10.1109/TMI.2007.907277. [DOI] [PubMed] [Google Scholar]
- [48].Pajevic S, Pierpaoli C. Color schemes to represent the orientation of anisotropic tissues from diffusion tensor data: application to white matter fiber tract mapping in the human brain. Magnetic Resonance in Medicine 2000. 1999;42:526–540. [PubMed] [Google Scholar]
- [49].Kindlmann Gordon. Superquadric Tensor Glyphs. IEEE Transactions on Visualization and Computer Graphics/EG Symposium on Visualization; 2004. pp. 147–154. [DOI] [PubMed] [Google Scholar]
- [50].Jones Derek K. Studying connections in the living human brain with diffusion MRI. Cortex. 2008;44:936–952. doi: 10.1016/j.cortex.2008.05.002. Special Issue on “Brain Hodology - Revisiting disconnection approaches to disorders of cognitive function”. [DOI] [PubMed] [Google Scholar]
- [51].Lazar M. Mapping brain anatomical connectivity using white matter tractography. NMR in Biomedicine. 2010;23:821–835. doi: 10.1002/nbm.1579. [DOI] [PMC free article] [PubMed] [Google Scholar]
- [52].Basser PJ, Pajevic S, Pierpaoli C, Duda J, Aldroubi A. In Vivo Fiber Tractography Using DT–MRI Data. Magnetic Resonance in Medicine. 2000;44:625–632. doi: 10.1002/1522-2594(200010)44:4<625::aid-mrm17>3.0.co;2-o. [DOI] [PubMed] [Google Scholar]
- [53].Conturo TE, Lori NF, Cull TS, et al. Tracking Neuronal Fiber Pathways in the Living Human Brain. Neurobiology. 1999;96:10422–10427. doi: 10.1073/pnas.96.18.10422. [DOI] [PMC free article] [PubMed] [Google Scholar]
- [54].Mori Susumu, Crain BJ, Chacko VP, Zijl PCM. Three dimensional tracking of axonal projections in the brain by magnetic resonance imaging. Ann Neurol. 1999;45:265–269. doi: 10.1002/1531-8249(199902)45:2<265::aid-ana21>3.0.co;2-3. [DOI] [PubMed] [Google Scholar]
- [55].Westin C-F, Maier SE, Khidhir B, Everett P, Jolesz FA, Kikinis R. Medical Image Computing and Computer-Assisted Intervention. 1999. Image Processing for Diffusion Tensor Magnetic Resonance Imaging; pp. 441–452. (Lecture Notes in Computer Science). [Google Scholar]
- [56].Delmarcelle T, Hesselink L. Visualization of second order tensor fields and matrix data. Proceedings of IEEE Visualization ’92.1992. pp. 316–323. [Google Scholar]
- [57].Press William H., Teukolsky Saul A., Vetterling William T., Flannery Brian P. Numerical Recipes in C: the Art of Scientific Computingch. Cambridge University Press; 1992. 16.1 Runge-Kutta Method. [Google Scholar]
- [58].Weinstein D, Kindlmann G, Lundberg E. Tensorlines: Advection-Diffusion based Propagation through Diffusion Tensor Fields. Proceedings of IEEE Visualization ’99.1999. pp. 249–253. [Google Scholar]
- [59].Lazar M, Weinstein DM, Tsuruda JS, et al. White matter tractography using diffusion tensor deflection. Human Brain Mapping. 2003;18:306–321. doi: 10.1002/hbm.10102. [DOI] [PMC free article] [PubMed] [Google Scholar]
- [60].O’Donnell LJ, Westin C-F. Automatic Tractography Segmentation Using a High-Dimensional White Matter Atlas. IEEE Transactions on Medical Imaging. 2007;26:1562–1575. doi: 10.1109/TMI.2007.906785. [DOI] [PubMed] [Google Scholar]
- [61].Conturo TE, Lori NF, Cull TS, et al. Tracking neuronal fiber pathways in the living human brain. Proceedings of the National Academy of Sciences of the United States of America. 1999;96:10422. doi: 10.1073/pnas.96.18.10422. [DOI] [PMC free article] [PubMed] [Google Scholar]
- [62].Catani M, Howard RJ, Pajevic S, Jones DK. Virtual in vivo interactive dissection of white matter fasciculi in the human brain. Neuroimage. 2002;17:77–94. doi: 10.1006/nimg.2002.1136. [DOI] [PubMed] [Google Scholar]
- [63].Goodlett C, Davis B, Jean R, Gilmore J, Gerig G. Improved correspondence for DTI population studies via unbiased atlas building. Lecture Notes in Computer Science. 2006;4191:260. doi: 10.1007/11866763_32. [DOI] [PubMed] [Google Scholar]
- [64].Yushkevich PA, Zhang H, Simon TJ, Gee JC. Structure-specific statistical mapping of white matter tracts using the continuous medial representation. IEEE Int. Conf. Computer Vision.2007. [Google Scholar]
- [65].Mori Susumu, Oishi Kenichi, Jiang Hangyi, et al. Stereotaxic white matter atlas based on diffusion tensor imaging in an ICBM template. Neuroimage. 2008;40:570–582. doi: 10.1016/j.neuroimage.2007.12.035. [DOI] [PMC free article] [PubMed] [Google Scholar]
- [66].Maddah M, Grimson WEL, Warfield SK, Wells WM. A unified framework for clustering and quantitative analysis of white matter fiber tracts. Medical image analysis. 2008;12:191–202. doi: 10.1016/j.media.2007.10.003. [DOI] [PMC free article] [PubMed] [Google Scholar]
- [67].Catani M, Schotten T. A diffusion tensor imaging tractography atlas for virtual in vivo dissections. Cortex. 2008;44:1105–1132. doi: 10.1016/j.cortex.2008.05.004. [DOI] [PubMed] [Google Scholar]
- [68].Hagler DJ, Jr, Ahmadi ME, Kuperman J, et al. Automated white-matter tractography using a probabilistic diffusion tensor atlas: application to temporal lobe epilepsy. Human brain mapping. 2009;30:1535. doi: 10.1002/hbm.20619. [DOI] [PMC free article] [PubMed] [Google Scholar]
- [69].Behrens TEJ, Woolrich MW, Jenkinson M, et al. Characterisation and Propagation of Uncertainty in Diffusion Weighted MR imaging. Magn. Reson Med. 2003;50:1077–1088. doi: 10.1002/mrm.10609. [DOI] [PubMed] [Google Scholar]
- [70].Behrens TEJ, Johansen-Berg H, Woolrich MW, et al. Non-invasive mapping of connections between human thalamus and cortex using diffusion imaging. Nature Neuroscience. 2003;6:750–757. doi: 10.1038/nn1075. [DOI] [PubMed] [Google Scholar]
- [71].O’Donnell Lauren, Haker Steven, Westin Carl-Fredrik. New Approaches to Estimation of White Matter Connectivity in Diffusion Tensor MRI: Elliptic PDEs and Geodesics in a Tensor-Warped Space. In: Dohi T, Kikinis R, editors. Medical Image Computing and Computer-Assisted Intervention (MICCAI) Tokyo, Japan: 2002. pp. 459–466. [Google Scholar]
- [72].Kreher BW, Mader I, Kiselev VG. Gibbs tracking: A novel approach for the reconstruction of neuronal pathways. Magnetic Resonance in Medicine. 2008;60:953–963. doi: 10.1002/mrm.21749. [DOI] [PubMed] [Google Scholar]
- [73].Melonakos John, Mohan Vandana, Niethammer Marc, Smith Kate, Kubicki Marek, Tannenbaum Allen. Finsler tractography for white matter connectivity analysis of the cingulum bundle. Proceedings of the 10th international conference on Medical image computing and computer-assisted intervention - Volume Part IMICCAI’07; Berlin, Heidelberg. Springer-Verlag; 2007. pp. 36–43. [DOI] [PMC free article] [PubMed] [Google Scholar]
- [74].Behrens TEJ, Berg H. Johansen, Jbabdi S, Rushworth MFS, Woolrich MW. Probabilistic diffusion tractography with multiple fibre orientations: What can we gain? NeuroImage. 2007;34:144–155. doi: 10.1016/j.neuroimage.2006.09.018. [DOI] [PMC free article] [PubMed] [Google Scholar]
- [75].Wedeen VJ, Wang RP, Schmahmann JD, et al. Diffusion spectrum magnetic resonance imaging (DSI) tractography of crossing fibers. NeuroImage. 2008;41:1267–1277. doi: 10.1016/j.neuroimage.2008.03.036. [DOI] [PubMed] [Google Scholar]
- [76].Qazi Arish A., Radmanesh Alireza, O’Donnell Lauren, et al. Resolving crossings in the corticospinal tract by two-tensor streamline tractography: method and clinical assessment using fMRI. Neuroimage. 2008 doi: 10.1016/j.neuroimage.2008.06.034. [DOI] [PMC free article] [PubMed] [Google Scholar]
- [77].Malcolm JG, Shenton ME, Rathi Y. Filtered multi-tensor tractography. IEEE Trans. on Medical Imaging. 2010;29:1664–1675. doi: 10.1109/TMI.2010.2048121. [DOI] [PMC free article] [PubMed] [Google Scholar]
- [78].Yushkevich Paul A., Zhang Hui, Simon Tony J., Gee James C. Structure-specific statistical mapping of white matter tracts. NeuroImage. 2008;41:448–461. doi: 10.1016/j.neuroimage.2008.01.013. [DOI] [PMC free article] [PubMed] [Google Scholar]
- [79].O’Donnell Lauren, Golby Alexandra J, Westin C-F. Tract-based morphometry for white matter group analysis. NeuroImage. 2009;45:832–844. doi: 10.1016/j.neuroimage.2008.12.023. [DOI] [PMC free article] [PubMed] [Google Scholar]
- [80].Sherbondy Anthony, Rowe Matthew, Alexander Daniel. MicroTrack: An Algorithm for Concurrent Projectome and Microstructure Estimation. In: Jiang Tianzi, Navab Nassir, Pluim Josien, Viergever Max., editors. Medical Image Computing and Computer-Assisted Intervention â□□ MICCAI 2010. Springer; 2010. pp. 183–190. [DOI] [PubMed] [Google Scholar]
- [81].Kamada K, Todo T, Ota T, et al. The motor-evoked potential threshold evaluated by tractography and electrical stimulation. Journal of Neurosurgery: Pediatrics. 2009;111 doi: 10.3171/2008.9.JNS08414. [DOI] [PubMed] [Google Scholar]
- [82].Bello L, Castellano A, Fava E, et al. Intraoperative use of diffusion tensor imaging fiber tractography and subcortical mapping for resection of gliomas: technical considerations. Journal of Neurosurgery: Pediatrics. 2010;28 doi: 10.3171/2009.12.FOCUS09240. [DOI] [PubMed] [Google Scholar]
- [83].Alexander AL, Hasan KM, Lazar M, Tsuruda JS, Parker DL. Analysis of partial volume effects in diffusion-tensor MRI. Magnetic Resonance in Medicine. 2001;45:770–780. doi: 10.1002/mrm.1105. [DOI] [PubMed] [Google Scholar]
- [84].Basser PJ, Jones DK. Diffusion-tensor MRI: theory, experimental design and data analysis–a technical review. NMR in Biomedicine. 2002;15:456–467. doi: 10.1002/nbm.783. [DOI] [PubMed] [Google Scholar]
- [85].Kandel Eric R., Schwartz James H., Jessel Thomas M. Principles of Neural Science. McGraw-Hill; 2000. ch. 2. [Google Scholar]
- [86].Tuch David S. Q-ball imaging. Magnetic Resonance in Medicine. 2004;52:1358–1372. doi: 10.1002/mrm.20279. [DOI] [PubMed] [Google Scholar]
- [87].Bar-Shir Amnon, Duncan Ian D., Cohen Yoram. QSI and DTI of excised brains of the myelin-deficient rat. NeuroImage. 2009;48:109–116. doi: 10.1016/j.neuroimage.2009.06.019. [DOI] [PubMed] [Google Scholar]
- [88].Wu EX, Cheung MM. MR diffusion kurtosis imaging for neural tissue characterization. NMR in Biomedicine. 2010;23:836–848. doi: 10.1002/nbm.1506. [DOI] [PubMed] [Google Scholar]
- [89].Wedeen VJ, Hagmann P, Tseng WI, Reese TG, Weisskoff RM. Mapping complex tissue architecture with diffusion spectrum magnetic resonance imaging. Magnetic Resonance in Medicine. 2005;54:1377–1386. doi: 10.1002/mrm.20642. [DOI] [PubMed] [Google Scholar]
- [90].Assaf Yaniv, Basser Peter J. Composite hindered and restricted model of diffusion (CHARMED) MR imaging of the human brain. NeuroImage. 2005;27:48–58. doi: 10.1016/j.neuroimage.2005.03.042. [DOI] [PubMed] [Google Scholar]
- [91].Peled Sharon, Friman Ola, Jolesz Ferenc, Westin Carl-Fredrik. Geometrically constrained two-tensor model for crossing tracts in DWI. Magnetic Resonance Imaging. 2006;24:1263–1270. doi: 10.1016/j.mri.2006.07.009. [DOI] [PMC free article] [PubMed] [Google Scholar]
- [92].Assaf Yaniv, Blumenfeld-katzir Tamar, Yovel Yossi, Basser Peter J. AxCaliber: a method for measuring axon diameter distribution from diffusion MRI. Magn Reson Med. 2008;59:1347–54. doi: 10.1002/mrm.21577. [DOI] [PMC free article] [PubMed] [Google Scholar]
- [93].Ã□zarslan Evren, Vemuri Baba C., Mareci Thomas H. Higher Rank Tensors in Diffusion MRI. In: Weickert Joachim, Hagen Hans., editors. Visualization and Processing of Tensor Fields. Springer; Berlin Heidelberg: 2006. pp. 177–187. [Google Scholar]
- [94].Ozarslan E, Basser PJ. Microscopic anisotropy revealed by NMR double pulsed field gradient experiments with arbitrary timing parameters. The Journal of chemical physics. 2008;128:154511. doi: 10.1063/1.2905765. [DOI] [PMC free article] [PubMed] [Google Scholar]
- [95].Shemesh N, Ã□zarslan E, Komlosh ME, Basser PJ, Cohen Y. From single-pulsed field gradient to double-pulsed field gradient MR: gleaning new microstructural information and developing new forms of contrast in MRI. NMR in Biomedicine. 2010;23:757–780. doi: 10.1002/nbm.1550. [DOI] [PMC free article] [PubMed] [Google Scholar]
- [96].Smith Stephen M., Jenkinson Mark, Johansen-Berg Heidi, et al. Tract-based spatial statistics: Voxelwise analysis of multi-subject diffusion data. NeuroImage. 2006;31:1487–1505. doi: 10.1016/j.neuroimage.2006.02.024. [DOI] [PubMed] [Google Scholar]
- [97].Kindlmann Gordon, Westin Carl-Fredrik. Diffusion Tensor Visualization with Glyph Packing. IEEE Transactions on Visualization and Computer Graphics (Proceedings Visualization / Information Visualization 2006); 2006. pp. 1329–1335. [DOI] [PubMed] [Google Scholar]
- [98].Savadjiev P, Kindlmann G, Bouix S, Shenton ME, Westin C-F. Local White Matter Geometry from Diffusion Tensor Gradients. Neuroimage. 2010;49:3175–3186. doi: 10.1016/j.neuroimage.2009.10.073. [DOI] [PMC free article] [PubMed] [Google Scholar]


