Abstract
We have built new asymmetric stents for minimally invasive endovascular treatment of cerebral aneurysms. Each asymmetric stent consists of a commercial stent with a micro-welded circular mesh patch. The blood flow modification in aneurysm-vessel phantoms due to these stents was evaluated using x-ray angiographic analysis. However, the density difference between the radiographic contrast and the blood gives rise to a gravity effect, which was evaluated using an initial optical dye-dilution experiment. For the radiographic evaluations, curved-vessel phantoms instead of simple straight side-wall aneurysm phantoms were used in the characterization of meshes/stents. Six phantoms (one untreated, one treated with a commercial stent, and four treated with different asymmetric stents) with similar morphologies were used for comparison. We calculated time-density curves of the aneurysm region and then calculated the peak value (Pk) and washout rate (1/τ) after analytical curve fitting. Flow patterns in the angiograms showed reduction of vortex flow and slow washout in the dense mesh patch treated aneurysms. The meshes reduced Pk down to 21% and 1/τ down to 12% of the values for the untreated case. In summary, new asymmetric stents were constructed and their evaluation demonstrates that they may be useful in the endovascular treatment of aneurysms.
Keywords: aneurysm, cerebral aneurysm, angiography, time-density, blood flow, flow evaluation, flow modification, stent, asymmetric stent, interventional neuroradiology
1. INTRODUCTION
Intracranial aneurysms are abnormal bulges in the cerebral arteries, which can progressively expand and eventually rupture to cause hemorrhagic stroke. Current treatment methods for cerebral aneurysms include open-skull surgery to clip the neck of the aneurysm and minimally invasive endovascular procedures. Among treatments, interventional endovascular procedures are evolving rapidly and becoming more preferred because of their minimal invasiveness. For these endovascular procedures, x-ray angiography is the imaging modality of choice to provide guidance during the course of an interventional procedure because good image quality can be provided with better spatial and temporal resolution as well as full field of view when compared with other image modalities, such as MRA (magnetic resonance angiography) and ultrasound. A common endovascular treatment of aneurysms uses filling the aneurysm with Guglielmi detachable coils (GDC coils).1,2 During the treatment of an aneurysm using coils, physicians use x-ray angiograms to determine the packing of coils in the aneurysm body and the extent of unpacked neck remnant1,2 as a means to evaluate the results of the treatment. However, problems may occur when using GDC coils to fill the aneurysm, such as, possible herniation of coil into the main vessel, incomplete filling of the neck of the aneurysm followed by re-growth, difficulties in dealing with wide neck aneurysms and giant aneurysms. Moreover, blood flow assessment during an endovascular treatment of a cerebral aneurysm may also be of value in evaluation of treatment because the formation and growth of aneurysms is flow related;3,4 unfortunately, during a coiling procedure, quantitative evaluation of blood flow may be difficult due to the interference of the radio-opaque platinum coils filling the aneurysm.
Stents recently are also being used to assist the treatment of aneurysms. A deployed stent with some struts blocking the aneurysm orifice can help to prevent the potential protrusion of the coils into the main vessel channel.5 Studies6,7 also have been performed showing treatment of the aneurysm with a stent alone. However, current commercially available stents alone may not modify the standard vortex blood flow (Figure 1A) in the aneurysm sufficiently to promote remodeling of the vessel lumen because most have only a few fine struts crossing the orifice and still leaving large areas which allow strong blood flow into the aneurysm. On the other hand, to achieve the ideal coverage of the aneurysm orifice and blood flow modification, one might suppose that fully covered stents such as those used to treat abdominal aorta aneurysms8 could be used. However, the vascular anatomy in the cerebral circulation is quite different from that of the aorta. Many tiny branching vessels, called perforators,9,10 arise from each of the major cerebral arteries. The inside lumen diameters of most of the perforators are only in the range of 50 to 300 microns, and a blockage of any one of these tiny vessels might cause severe damage to brain tissue. Therefore, to reduce the blood flow into the aneurysm while minimizing the probability11 of blockage of the perforators, we have proposed the asymmetric stent12,13 as a new treatment of cerebral aneurysms. The asymmetric stent design (Figure 1B) consists of a low porosity part to be placed at the orifice of the aneurysm and a high porosity part to provide support to hold the stent in place. We expect that the asymmetric stent, with the low-porosity mesh covering the aneurysm orifice, can modify the vortex flow in an aneurysm to the extent that stasis of blood is induced, enabling thrombosis and growth of an endothelial layer covering the orifice.
Figure 1.
A new approach to treat cerebral aneurysms. A. Standard vortex blood flow in cerebral aneurysm. B. New design of asymmetric stent, which can modify the blood flow in the aneurysm region.
We have previously reported the radiographic visibility and feasibility of positioning the asymmetric stents under the guidance of a high-resolution micro-angiographic detector12 and a preliminary optical dye-dilution flow study comparing the mesh/stent with simulated coils13. Although x-ray angiography has been used to evaluate blood flow14 - 17 for decades, there are only a few involving evaluation of aneurysmal blood flow16,17. However, the density of iodinated contrast is substantially greater than that of blood, and we have observed in previous studies18,19 that this density difference can result in the contrast separating out or pooling in low flow conditions. Clough et al. have also reported this gravity effect on their lung blood flow perfusion studies.20 We believe that consideration of and evaluation of this gravity effect is important when quantifying blood flow in aneurysm using x-ray angiograms.
In this study, four asymmetric stents with high and low porosity regions (Figure 1B) were created for the first time, and they were deployed into silicone-elastomer, aneurysm-vessel phantoms21. Flow modification effects of these stents were evaluated using x-ray angiograms. In the following sections of this paper, we will present pictures of the newly built asymmetric stents, and we will demonstrate the feasibility of using x-ray angiograms to evaluate blood flow in the untreated and treated aneurysms. Finally, the characterization of different stent/mesh asymmetric stents will point to what we believe will be a promising future for these new devices.
2. MATERIALS AND METHODS
Two studies were performed: an evaluation of the gravity effect of contrast media on blood flow analysis using optical dye-dilution experiments and a characterization of asymmetric stents with different types of meshes using x-ray angiography. We did all the studies in vitro using silicone-elastomer (Sylgard® 186, Dow Corning Corp.) vessel phantoms21, which were placed in a pulsatile flow loop. Qualitative analysis involved observing the flow pattern changes in the aneurysm region in the dynamic images. Quantitative analysis of the flow characteristics was performed using a time-density approach14 – 19. The details of the experimental set-ups and the time-density method are described below in this section.
2.1. Materials used in the study on gravity effect
We first observed a significant gravity effect on contrast media when we were using a simple straight side-wall aneurysm model, which had been used as an idealized model to evaluate blood flow in aneurysms6,7,17. This straight vessel geometry also occurs in animal models, in which aneurysms are created at the carotid arteries of canines.22 Interestingly, in a study done by Tienjin et al.16 using clinical data of human patients, no gravity effect for the contrast media was reported. This lack of gravity effect may be due to the fact that clinical cerebral aneurysms are usually on tortuous, not straight, vessels, and so the blood flow characteristics are probably very different from those on straight vessels in the ideal or animal models. To investigate these differences, we performed studies using curved- and straight- vessel aneurysm phantoms19,21 (Figure 2). The curved-vessel phantom consists of a vessel with an 80° curve with the aneurysm on the outside radius.
Figure 2.
Drawings of the geometries of the two vessel phantoms used in the gravity effect study: A. Straight vessel, B. 80° curved vessel phantom with the aneurysm on the outside radius.
An optical dye-dilution experiment13 was performed while the aneurysm was positioned horizontally with respect to gravity (i.e. the plane of Figure 2 was horizontal). Optical dye that matched the physical properties of the fluid circulated in the flow loop allowed visualization of the actual flow characteristics of the simulated blood. The evaluation of the gravity effect of contrast media was achieved by comparing the flow characteristics observed for injections of optical dye mixed into contrast media with those of optical dye alone. The contrast media used was OXILAN™-300 (Cook Imaging Corp.) with physical density of 1.32 g/cc.
2.2. Materials used in the mesh charaterization study
The asymmetric stents consisted of a commercial stent (PENTA™, Guidant/Vascular Intervention) as the support structure and a circular stainless steel mesh patch micro-welded (Laser welder, Equi Lasers Inc.) to the stent. An example of an asymmetric stent is shown in Figure 3.
Figure 3.

An example of the newly built asymmetric stents. A. A circular 250 mesh patch micro-welded on a commercially available PENTA™ stent. B. Zoomed view of the micro-welded mesh.
The modified stents were re-crimped onto balloons and deployed into the elastomer vessel phantoms using a standard balloon-expansion technique. Full coverage of the aneurysm orifice by the mesh patch was confirmed optically under the microscope for each of the phantoms treated with asymmetric stents. Two other vessel phantoms were used as controls in this study for comparison, one untreated aneurysm phantom and one aneurysm phantom treated with the unmodified commercial PENTA™ stent. All the phantoms were similar in morphology with 3 mm diameter vessel and 11 mm aneurysm dome, which were made to simulate the typical clinical cerebral vessel and aneurysm sizes. Based on our results in the gravity effect study, we chose to use the 80° curved geometry for all the phantoms. The shape was chosen to be close to the cerebral vascular anatomy and was positioned to minimize the pooling of contrast media due to the gravity effect.
In table 1, we list four different types of meshes used in this study. The porosity is defined as the fractional part of the mesh area that is open: i.e. P = Ao/At, where P is porosity, Ao is the area of the openings and At is the total area. The permeability is a measure of the ability of a certain material to transfer fluid. We calculated the permeability, κ, here 1 using a simplified approximation derived from Poiseuille’s equation for a one dimensional flow: .23 We explored the correlation between the flow modification and the porosity and permeability of meshes.
Table 1.
List of stainless meshes to be used as a low porosity/permeability patch for the asymmetric stents.
| Mesh type | Lines per inch | Wire diameter (μm) | Width of opening (μm) | % Porosity | Permeability (μm2) |
|---|---|---|---|---|---|
| 200 × 200 | 200 | 53.3 | 73.7 | 33.6% | 57.0 |
| 250 × 250 | 250 | 40.6 | 61.0 | 36.0% | 41.8 |
| 400 × 400 | 400 | 27.9 | 35.6 | 31.4% | 12.4 |
| 500 × 500 | 500 | 25.4 | 25.4 | 25.0% | 5.04 |
2.3. Set-up of the pulsatile flow loop
In both of the studies, the vessel phantoms were placed in a pulsatile flow loop as shown in Figure 4. We used 40/60 glycerin/water as simulated blood with 1.1 g/cc physical density and 4.4 cPs viscosity at room temperature. The other advantage of using 40/60 glycerin/water is that the refractive index of this mixture happens to match with that of the silicone elastomer quite well. Thus, the phantoms are optically transparent when filled with this fluid allowing easy confirmation of the coverage of aneurysm orifice and facilitating the optical dye-dilution experiment. The set-up of the optical experiment is described in section 2.4. To simulate physiological flow conditions, we chose flow parameters to be 81 beats/min pulse rate and 320 ml/min average flow rate. The pulsatile flow was generated using a peristaltic pumping system (MasterFlex®, Cole-Parmer Instrument Co.). This type of pump generates a forward flow velocity only (i.e. no backward flow) ranging from the maximum chosen to a minimum of about 26% maximum velocity as we measured using a flowmeter (TS410, Transonic Systems Inc.). The Reynold’s number under this flow condition was calculated to be 560.
Figure 4.
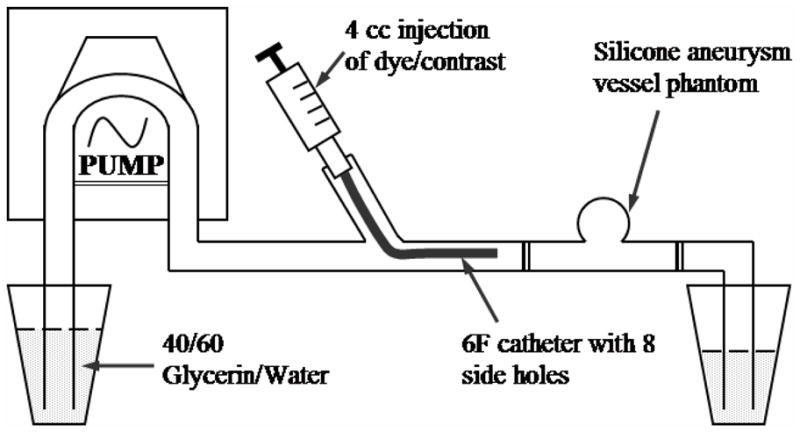
Schematic drawing of the pulsatile flow loop set-up.
The dye/contrast dilution experiments were performed by injecting 4 cc of optical dye or radiographic contrast media into the vessel proximal end via a 6F catheter while images were being acquired at 30 frames/sec either by a video camera or an x-ray imaging intensifier system (section 2.4). Eight side holes (about 1 mm in diameter) were purposely drilled near the catheter tip in order to achieve good mixture of the dye/contrast with the glycerin/water fluid.
2.4. Image acquisition systems
We have previously reported our optical dye-dilution studies13,18,19. For the optical dye studies, the optical microscope/video camera system (Figure 5A) was used. A view box was used as a light source, and the aneurysm phantoms were placed on top of the view box, so that the acquired transmission images were comparable to those obtained for the x-ray imaging system (Figure 5B). A linearity calibration was performed for the CCD video camera system prior to quantitative analysis. This optical set-up was also used to study the gravity effect of the contrast media. For the optical dye studies, the physical density of the dye was matched to that of the simulated blood, so that measured quantities corresponded to those of the actual blood flow.
Figure 5.
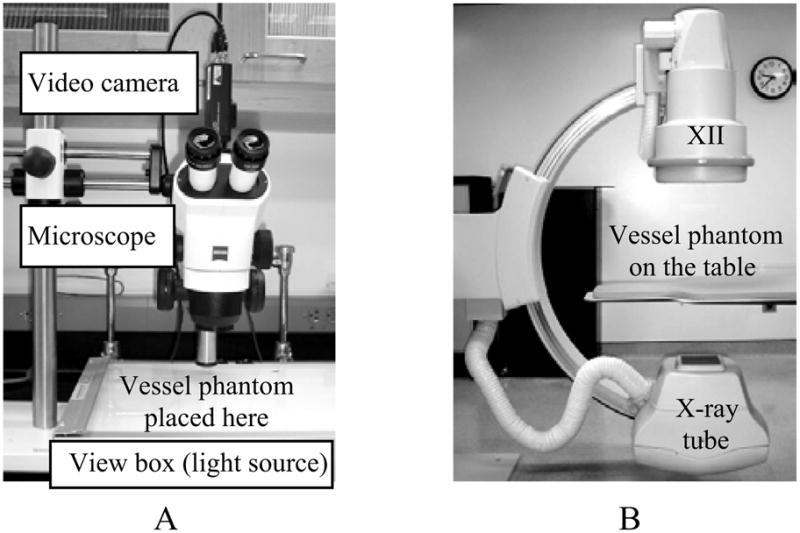
The image acquisition systems. A. Optical microscope/video camera system. B. Interventional angiographic system (Infinix™, Toshiba Corp.), XII: X-ray image intensifier.
For the mesh characterization studies, we used a standard x-ray angiographic system (Figure 5B), and the x-ray parameters were set at: 70 kVp, 80 mA, 4 ms, with 93 cm SID (source to image distance), magnification of 1.2, and minimal scattering material in the beam.
2.5. Time-density analysis
We analyzed the flow properties quantitatively using time-density curves which were derived from the image sequences in the aneurysm region. As illustrated in Figure 6, a region of interest (ROI) was defined to include the whole aneurysm (ROI-1). The average gray scale in the ROI-1 was then calculated as a function of time to generate time-density curves. From the time-density curves, we calculated the peak value (Pk) from a polynomial fit around the peak region and the washout time constant (τ) from an exponential fit of the washout part of the curves. For all the runs, the same time interval was used for the exponential fit. The peak values and washout time constant appear to be related to the flow in the aneurysm, i.e. the stronger the flow the more contrast media flow into the aneurysm and thus the larger the peak value, and similarly, the faster the flow the faster the washout of the contrast media from the aneurysm region. When gravity gave rise to pooling, measured washout times would be increased. Correlations between the flow properties (Pk and τ) derived from the time-density curves and the mesh properties (porosity and permeability) were then compared and discussed in order to characterize the asymmetric stents as related to flow modification.
Figure 6.
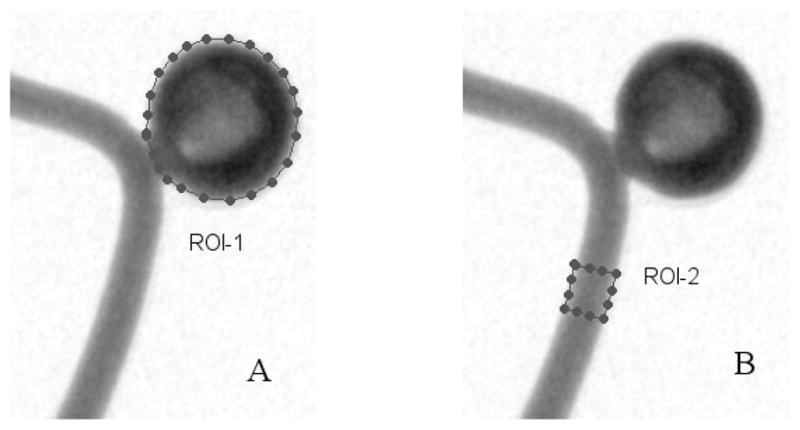
User indication of the ROIs. A. ROI-1: The aneurysm region, B. ROI-2: The in-flow region.
2.6. Minimizing the variations of hand injection
We used hand injection in all the studies, which is not uncommon in clinical neurovascular cases. Although all injections were done by the same person after practicing and variations due to the injections were small, we employed methods here described to minimize these variations to facilitate comparisons.
2.6.1 De-convolution of the in-flow profile
ROIs were drawn on the proximal part of the vessel (in-flow region) close to the aneurysm (Figure 6, ROI-2) and on the aneurysm (ROI-1). Time-density curves were obtained for both regions, the in-flow and aneurysm profiles respectively. Variations were seen in the in-flow profiles. The influence of the injection variations was removed from the time-density curves of the aneurysm region by deconvolving. The deconvolution proceeded as follows:
- Obtain the Fourier transforms of the in-flow profile fIn(t) and aneurysm profile fAneu(t):

(Eq. 1a) 
(Eq. 1b) - Divide the Fourier transform of the aneurysm profile by the Fourier transform of the in-flow profile (where the subscript Dc represents “Deconvolution”):
(Eq. 2) - Perform the inverse Fourier transform:

(Eq. 3)
We used the following techniques to acquire and process the data: (1) The injection technique was practiced, so that the injection profiles were smooth and were not of a square-wave form to give smooth data in the Fourier domain. (2) For the optical experiment, the odd and even lines in the interlaced video image were used to obtain 60 fields/sec data effectively doubling the temporal sampling. (3) Running mean averaging was employed to smooth the time-density curves, reducing effects due to the pulsatile flow. (4) High frequency noise in the deconvolution result was eliminated by exponential extrapolation.
This deconvolution technique was used in the optical experiments on gravity effect.
2.6.2 Averaging repeated runs
In the radiographic studies for the characterization of the meshes, the injection was found to be quite reproducible, so a simple average of three repeated runs was used.
3. RESULTS AND DISCUSSION
3.1. Pooling of contrast media in the aneurysm
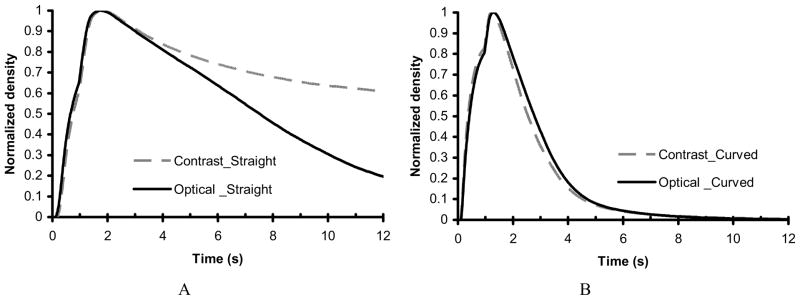
Figure 7A and 7B show the time-density curves for the straight and curved vessel phantoms, respectively, comparing an injection of a mixture of contrast media and optical dye with an injection of optical dye only. The time-density curves shown here were generated using running-mean smoothing. The aneurysm washout time for the curved vessel is shorter than that for the straight vessel. This result is probably due to the strong pressure-driven flow into the aneurysm for the curved vessel as compared to the weak shear-driven flow into the aneurysm for the straight vessel. We also can see that the two curves for the curved vessel are very close while the two curves for the straight phantom are separated. The plateau-like behavior in the time-density curve for contrast media in the straight vessel is due to pooling of contrast media (gravity effect) at the bottom of the aneurysm. There appears to be minimal pooling of the contrast media in the aneurysm on the curved vessel; therefore, the flow of the contrast media is expected to reflect the flow of the simulated blood represented by the flow of the optical dye alone.
Figure 7.
Smoothed time-density curves of the untreated phantoms comparing mixture with contrast media versus the optical dye alone. A. Straight vessel phantom. B. Curved vessel phantom.
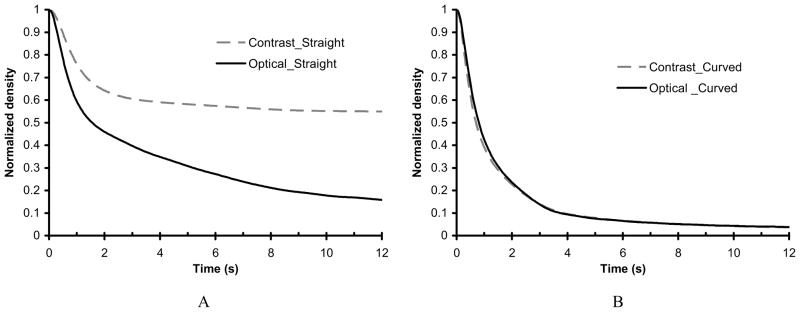
Although the two curves seem similar, variations may occur due to the hand injections. To reduce these variations, we deconvolved the time-density curves as described in section 2.6.1. The deconvolved time-density curves are shown in Figure 8. A summary of the washout time constant (τ) data obtained for each of these curves are summarized in Table 2. The two time-density curves for the curved vessel are still very similar while the two curves for the straight vessel are clearly different. The similarity of the curves (with and without contrast) indicate that accurate flow evaluation can be achieved from radiographic data when no or minimal gravity effect (pooling of contrast media) is present. Moreover, qualitative observation and quantitative measures can indicate when the gravity effect is present. This also may be useful in evaluation of the flow in the aneurysm. Therefore, we decided to use x-ray angiographic studies instead of optical dye experiments to evaluate the blood flow modification in our mesh characterization study. The ability to evaluate blood flow modification using radiographic contrast will be important to future clinical studies.
Figure 8.
Deconvolved time-density curves of the untreated phantoms comparing mixture with contrast media versus the optical dye alone. A. Straight vessel phantom. B. Curved vessel phantom.
Table 2.
Summary of the flow parameters from the deconvolved time-density curves
| Geometry of aneurysm-vessel phantom | Mixture with contrast media | Optical dye alone | ||
|---|---|---|---|---|
| Washout time constant (s), average of three runs | Standard deviation (s) | Washout time constant (s), average of three runs | Standard deviation (s) | |
| Straight vessel | 49.33 | 2.26 | 7.98 | 1.37 |
| Curved vessel | 4.55 | 0.11 | 4.45 | 0.05 |
3.2. Flow modification by the assymetric stents
3.2.1 Qualitative results
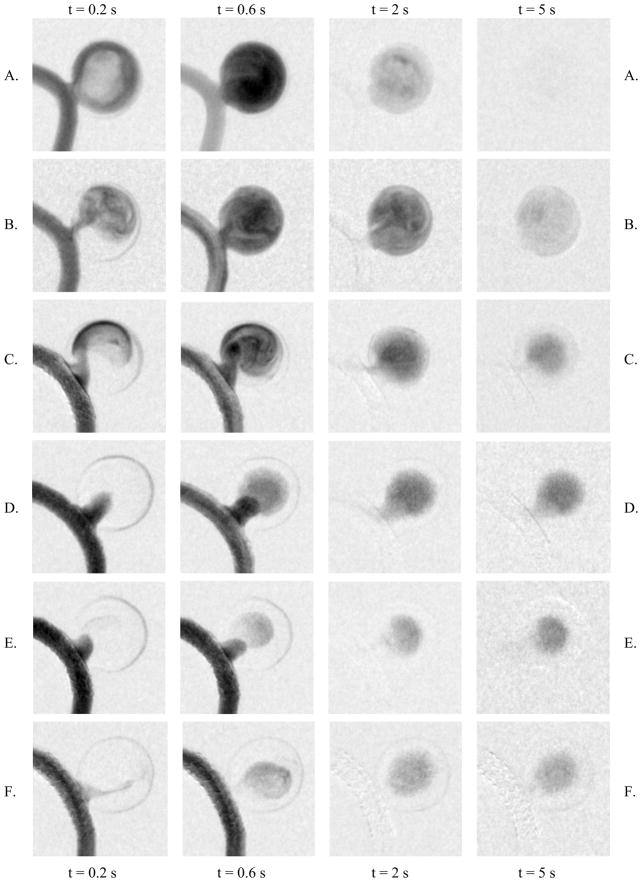
Sample images to demonstrate the flow pattern changes are shown in Figure 9. We selected four images in time sequences from one run for each of the phantoms: (1) at t = 0.2 s, which demonstrates the arrival property of the flow, (2) at t = 0.6 s, when filling of the contrast media into the aneurysm almost reaches the maximum, (3) at t = 2 s, which demonstrates the washout flow property, and (3) at t = 5 s, when the final stage of the washout is reached. From the images of the untreated phantom, we can see a strong vortex flow in the aneurysm, full filling of the contrast media, and an almost complete washout of the contrast media from the aneurysm within only 5 s. With the treatment of the PENTA™ stent, we can see a jet-like pattern due to the re-directed flow by the stent struts, an almost complete filling of the contrast media, and a delayed washout compared with the untreated case. Although a modification of flow by the commercial stent was observed in the dynamic sequences, the flow in the aneurysm still appeared to be strong and the jet-like flow impinged on the aneurysm wall. Extrapolating to the clinical situation, stenting could result in a high impulse jet to an already weakened wall which might ultimately lead to hemorrhage. For the aneurysm treated with asymmetric stent with 200 mesh, vortex flow could still be observed, but the flow enters the aneurysm across the entire orifice, i.e., not as a jet. We observed reduced flow of the contrast media across the 200 mesh relative to that in the untreated phantom. For the cases with the denser meshes (250, 400, and 500), no vortex flow of the contrast media could be observed. Although weak vortex flow might be present in these aneurysms, they are so weak that they are masked by the gravity effects of the heavy contrast media. In other words, the contrast media does not appear to track the actual flow pattern due to the gravity effect, specifically pooling of contrast media. For these meshes, the contrast media appears to ooze through the meshes in a pulsed manner and perfusing throughout the aneurysm. The images indicate that the denser the mesh, the less contrast media passes through the mesh, and from the washout images it appears that the contrast media is pooling.
Figure 9.
Flow patterns in the aneurysm region: A. untreated aneurysm, B. treated with PENTA™ stent, C. treated with 200 mesh/stent, D. treated with 250 mesh/stent, E. treated with 400 mesh/stent, and F. treated with 500 mesh/stent.
3.2.2 Quantitative results
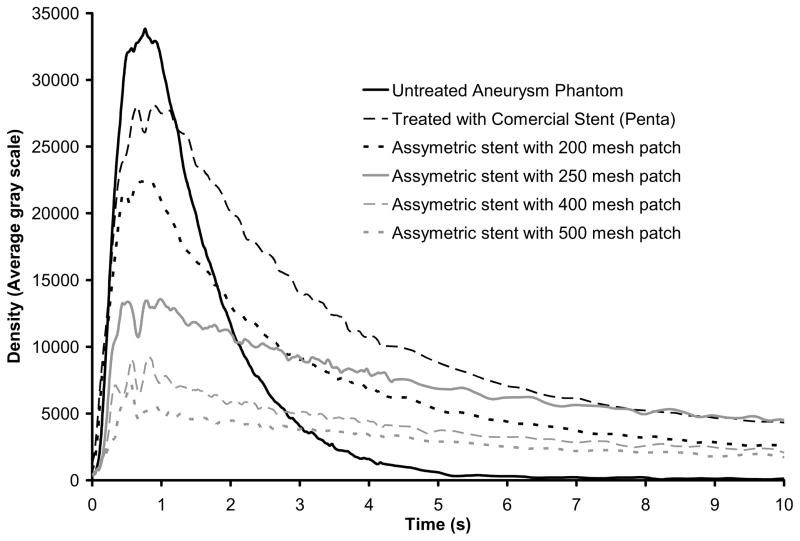
The time-density curves calculated for all six phantoms are shown in Figure 10. Each of the curves represents an average of three repeated runs. The peak and washout rate for each case are presented in Table 3 in which values are presented as fractions of the values for the untreated case. The time-density curve for the untreated aneurysm indicates that full washout occurs, i.e., no pooling of contrast media in the aneurysm. The washout time constant for the untreated aneurysm is 0.98 s, i.e. the washout rate is 1.02 s−1. For the highly porous commercial stent, the peak value drops to 83% of the untreated, and the washout flow rate is 33% of that of the untreated case. For the cases with the mesh patches, the peak value (Pk) and the washout rate (1/τ) are reduced further as the meshes get denser. From the washout properties of these curves, it appears that they fall into three groups: (1) the untreated case where no pooling occurs, and events, e.g. washout and aneurysmal flow, are substantially more rapid than the others; (2) the cases with the commercial stent and 200 mesh where there are similar delayed washout properties, caused by the slower flow in the aneurysm with minimal pooling of contrast media; (3) the 250, 400, and 500 mesh treated aneurysms where there is the pooling of the contrast media leading to a very long washout time even though much less contrast media flows into the aneurysm.
Figure 10.
Time-density curves showing flow modification in aneurysms treated with asymmetric stents.
Table 3.
Summary of the flow parameters for characterization of asymmetric mesh/stents
| Flow parameter | Untreated | PENTA™ | 200 mesh | 250 mesh | 400 mesh | 500 mesh |
|---|---|---|---|---|---|---|
| Relative peak (Pk) | 1 | 0.83 | 0.66 | 0.40 | 0.26 | 0.21 |
| Relative washout (1/τ) | 1 | 0.33 | 0.34 | 0.15 | 0.15 | 0.12 |
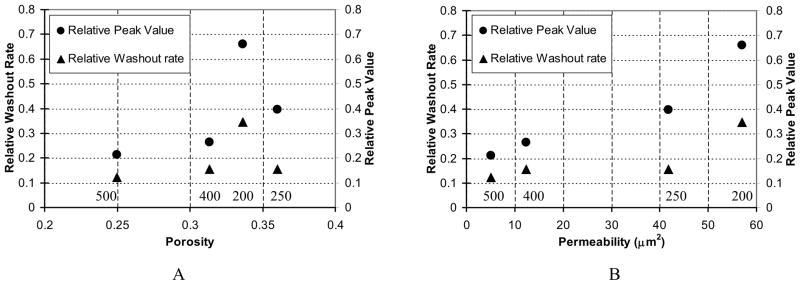
In Figure 11, we present the fractional peak values and washout rates as functions of the mesh properties, porosity, and permeability. The mesh types are indicated above the horizontal axes of the graphs as 200, 250, 400, and 500. While porosity seems to correlate with flow properties for the 250, 400, and 500 mesh cases, the 200 case indicates that porosity may not be a good criterion to characterize mesh effect on flow modification. Note that the 200 mesh has wider openings than the 250 mesh, although having a slightly lower porosity (Table 1). On the other hand, permeability correlated quite well with the calculated parameters related to flow modification. We can see that the lower the permeability, the lower the peak value in the time-density curves. The r value of the correlation between peak value and permeability is 0.95. The correlation between washout rate and permeability is 0.82; the similar washout rates of the cases for 250, 400, and 500 meshes are due to the pooling of contrast media in the aneurysm. Thus, we view permeability to be a more useful reference parameter when characterizing mesh properties.
Figure 11.
Correlations between flow parameters and mesh properties (parameters are shown relative to those of the untreated aneurysm). A. Flow parameters versus porosity. B. Flow parameters versus permeability.
4. CONCLUSION
In this work, new asymmetric stents were created, and flow modification by the asymmetric stents was evaluated using x-ray angiography for the first time. The flow modification by the asymmetric stents demonstrated in the angiograms is substantial. The results are promising for the future use of this approach in the endovascular treatment of aneurysms and in improving and possibly supplanting the use of GDC coils.
Acknowledgments
The work is supported by NIH Grants R01NS38746 and R01EB02873, and an equipment grant from the Toshiba Corp. We also thank the Guidant Corp. for supplying stents used in the work.
References
- 1.Murayama Y, Nien YL, Duckwiler GR, et al. Guglielmi detachable coil embolization of cerebral aneurysms: 11 year’s experience. J Neurosurg. 2003;98:959–966. doi: 10.3171/jns.2003.98.5.0959. [DOI] [PubMed] [Google Scholar]
- 2.Hayakawa M, Murayama Y, Duckwiler GR, et al. Natural history of the neck remnant of a cerebral aneurysm treated with the Guglielmi detachable coil system. J Neurosurg. 2000;93:561–568. doi: 10.3171/jns.2000.93.4.0561. [DOI] [PubMed] [Google Scholar]
- 3.Burleson AC, Strother CM, Turitto VT. Computer modeling of intracranial saccular and lateral aneurysms for the study of their hemodynamics. Neurosurgery. 1995;37:774–782. doi: 10.1227/00006123-199510000-00023. [DOI] [PubMed] [Google Scholar]
- 4.Fukuda S, Hashimoto N, Naritomi H, et al. Prevention of rat cerebral aneurysm formation by inhibition of nitric oxide synthase. Circulation. 2000;101:2532–2538. doi: 10.1161/01.cir.101.21.2532. [DOI] [PubMed] [Google Scholar]
- 5.Szikora I, Guterman LR, Well KM, et al. Combined use of stents and coils to treat experimental wide-necked carotid aneurysms: preliminary results. AJNR Am J Neuroradiol. 1994;15:1091–1102. [PMC free article] [PubMed] [Google Scholar]
- 6.Lieber BB, Stancampiano AP, Wakhloo AK. Alteration of hemodynamics in aneurysm models by stenting: Influence of stent porosity. Ann Biomed Eng. 1997;25:460–469. doi: 10.1007/BF02684187. [DOI] [PubMed] [Google Scholar]
- 7.Lieber BB, Livescu V, Hopkins LN, Wakhloo AK. Particle image velocimetry assessment of stent design influence on intra-aneurysm flow. Ann Biomed Eng. 2002;30:768–777. doi: 10.1114/1.1495867. [DOI] [PubMed] [Google Scholar]
- 8.Hall SW. Endovascular repair of abdominal aortic aneurysms. AORN Journal. 2003;77:631–642. doi: 10.1016/s0001-2092(06)61257-x. [DOI] [PubMed] [Google Scholar]
- 9.Sarki N, Rhoton AL., Jr Microsurgical anatomy of the upper basilar artery and the posterior circle of willis. J Neurosurg. 1977;46:563–578. doi: 10.3171/jns.1977.46.5.0563. [DOI] [PubMed] [Google Scholar]
- 10.Rosner SS, Rhoton AL, Jr, Ono M, Barry M. Microsurgical anatomy of the anterior perforating arteries. J Neurosurg. 1984;61:468–485. doi: 10.3171/jns.1984.61.3.0468. [DOI] [PubMed] [Google Scholar]
- 11.Yang C-YJ, Rudin S, Wang Z, Wu Y. Determination of the probability for blocking small side-branch perforator vessels during cerebrovascular stent deployment. Radiology (Supl); Science Program and 87th Scientific Assembly and Annual Meeting of RSNA; Nov. 25–Nov. 30, 2001; Chicago. Nov, 2001. p. 221.p. 159. exhibit 0253PH-p. [Google Scholar]
- 12.Rudin S, Wu Y, Kypianou I, Ionita C, Wang Z, Ganguly A, Bednarek DR. Micro-angiographic detector with fluoroscopic capability. Proc SPIE. 2000;4682:344–354. [Google Scholar]
- 13.Rudin S, Wang Z, Kyprianou I, Hoffmann KR, Wu Y, Meng H, Guterman LR, Nemes B, Bednarek DR, Hopkins LN. Measurement of flow modification in a phantom aneurysm model: comparison of coils and asymmetric (longitudinally and axially) stent – initial findings. Radiology. doi: 10.1148/radiol.2311021741. (in print) [DOI] [PubMed] [Google Scholar]
- 14.Shpilfoygel SD, Close RA, Valentino DJ, Duckwiler GR. X-ray videodensitometric methods for blood flow and velocity measurement: A critical review of literature. Med Phys. 2000;27:2008–2023. doi: 10.1118/1.1288669. [DOI] [PubMed] [Google Scholar]
- 15.Hoffmann KR, Doi K, Fencil LE. Determination of instantaneous and average blood flow rates from digital angiograms of vessel phantoms using distance-density curves. Invest Radiol. 1991;26:207–212. doi: 10.1097/00004424-199103000-00001. [DOI] [PubMed] [Google Scholar]
- 16.Tenjin H, Fumio A, Nakahara Y, et al. Evaluation of intraaneurysmal blood velocity by time-density curve analysis and digital subtraction angiography. AJNR Am J Neuroradiol. 1998;19:1303–1307. [PMC free article] [PubMed] [Google Scholar]
- 17.Sadasivan C, Lieber BB, Gounis MJ, Lopes DK, Hopkins LN. Angiographic Quantification of Contrast Medium Washout from Cerebral Aneurysms after Stent Placement. AJNR Am J Neuroradiol. 2002;23:1214–1221. [PMC free article] [PubMed] [Google Scholar]
- 18.Wang Z, Kyprianou I, Rudin S, Ionita C, Wu Y, Bednarek DR, Hoffmann KR. Difference in flow characteristics between contrast media and blood during x-ray angiography. Med Phys; AAPM Annual Meeting; Montreal. July 2002; 2002. p. 1354. Abstract (No. WE-D-518-05) [Google Scholar]
- 19.Wang Z, Kyprianou I, Wu Y, Rudin S, Bednarek DR, Hoffmann KR. Evaluation of the effect of iodinated contrast media pooling on quantifying cerebral aneurysmal blood flow using x-ray angiograms. Med Phys; AAPM Annual Meeting; August, 2003; San Diego, CA. 2003. p. 1462. Abstract (No. PO-I-17) [Google Scholar]
- 20.Clough AV, Haworth ST, Roerig DL, et al. Influence of gravity on radiographic contrast material-based measurements of regional blood flow distribution. Acad Radiol. 2003;10 doi: 10.1016/s1076-6332(03)80036-3. [DOI] [PubMed] [Google Scholar]
- 21.Wang Z, Wu Y, Rudin S, Bednarek DR, Nazareth DP, Yang CJ. Neurovascular phantoms for evaluation of a high-resolution ROI micro-angiographic camera. World Congress on Medical Physics and Biomedical Engineering; July 23–28, 2000; Chicago. published in proceedings CDROM, paper TH-CXH-11. [Google Scholar]
- 22.Germia G, Haklin M, Brennecke L. Embolization of experimentally created aneurysms with intravascular stent devices. AJNR Am J Neuroradiol. 1994;15:1223–1231. [PMC free article] [PubMed] [Google Scholar]
- 23.Ionita CN, Hoi Y, Rudin S, Meng H. Particle image velocimetry (PIV) evaluation of flow modification in aneurysm phantoms using asymmetric stents. Proc SPIE. 2004 Feb;5369:5369–36. doi: 10.1117/12.534274. [DOI] [PMC free article] [PubMed] [Google Scholar]


