

Abstract
Although vastly outnumbered, inhibitory interneurons critically pace and synchronize excitatory principal cell populations to coordinate cortical information processing. Precision in this control relies upon a remarkable diversity of interneurons primarily determined during embryogenesis by genetic restriction of neuronal potential at the progenitor stage. Like their neocortical counterparts, hippocampal interneurons arise from medial and caudal ganglionic eminence (MGE and CGE) precursors. However, while studies of the early specification of neocortical interneurons are rapidly advancing, similar lineage analyses of hippocampal interneurons have lagged. A “hippocampocentric” investigation is necessary as several hippocampal interneuron subtypes remain poorly represented in the neocortical literature. Thus, we investigated the spatiotemporal origins of hippocampal interneurons using transgenic mice that specifically report MGE- and CGE-derived interneurons either constitutively or inducibly. We found that hippocampal interneurons are produced in two neurogenic waves between E9–E12 and E12–E16 from MGE and CGE, respectively, and invade the hippocampus by E14. In the mature hippocampus, CGE-derived interneurons primarily localize to superficial layers in strata lacunosum moleculare and deep radiatum, while MGE-derived interneurons readily populate all layers with preference for strata pyramidale and oriens. Combined molecular, anatomical, and electrophysiological interrogation of MGE/CGE-derived interneurons revealed that MGE produces parvalbumin-, somatostatin-, and nitric oxide synthase-expressing interneurons including fast-spiking basket, bistratified, axo-axonic, oriens-lacunosum moleculare, neurogliaform, and ivy cells. In contrast, CGE-derived interneurons contain cholecystokinin, calretinin, vasoactive intestinal peptide, and reelin including non-fast-spiking basket, Schaffer collateral-associated, mossy fiber-associated, trilaminar, and additional neurogliaform cells. Our findings provide a basic blueprint of the developmental origins of hippocampal interneuron diversity.
Introduction
Information processing within cortical circuits requires precision in the timing and extent of action potential generation among excitatory principal neuron ensembles. Such coordination is largely orchestrated by relatively few highly divergent GABAergic inhibitory interneurons with distinct molecular, anatomical, and electrophysiological properties (Freund and Buzsáki, 1996; Somogyi and Klausberger, 2005). This remarkable diversity allows interneuron networks to provide exquisite spatiotemporal control over information transfer within cortical circuits (McBain and Fisahn, 2001; Klausberger and Somogyi, 2008). Moreover, specific interneuron subtypes are implicated in regulating neuronal proliferation and migration during corticogenesis (Owens and Kriegstein, 2002) as well as postnatal maturation of cortical circuitry (Hensch, 2005; Bonifazi et al., 2009). Indeed several developmentally regulated neurological disorders such as schizophrenia are associated with deficits in the numbers and function of distinct interneuron cohorts (Lewis et al., 2005; Di Cristo, 2007). Thus, a thorough appreciation of interneuron diversity is critical to understanding cortical network development, function, and disease.
Although distinct interneurons require weeks of postnatal maturation to fully attain their subtype-defining characteristics, genetic restriction of neuronal potential at the progenitor stage is a major determinant of interneuron diversity (Wonders and Anderson, 2006; Batista-Brito and Fishell, 2009). Therefore, a complete mapping of the origins of distinct interneuron classes is fundamental to comprehending interneuron diversity. Investigations using cell transplantation, lineage analysis, and fate-mapping strategies have provided unprecedented insight into neocortical interneuron diversity delineating the precise origins, birth dates, and genetic programs governing early specification and migration of distinct neocortical interneuron subpopulations (Wichterle et al., 2001; Xu et al., 2004, 2005, 2010; Butt et al., 2005, 2008; Fogarty et al., 2007; Miyoshi et al., 2007, 2010; Du et al., 2008; Batista-Brito et al., 2009; Gelman et al., 2009; Sousa et al., 2009; Wang et al., 2010). Like their neocortical counterparts, hippocampal interneurons arise from precursors in the medial and caudal ganglionic eminences (MGE/CGE) in the basal telencephalon (Pleasure et al., 2000; Butt et al., 2005; Wonders and Anderson, 2006). However, despite an extensive literature concerning hippocampal interneuron diversity and function, fate mapping of hippocampal interneuron precursors has significantly lagged that of neocortical interneurons. A “hippocampocentric” investigation is necessitated by the fact that several cohorts of neurochemically distinct hippocampal interneurons are poorly represented in the existing neocortical literature. Furthermore, many hippocampal interneurons are classified according to laminar position and axonal projection, making it difficult to identify neocortical homologs to infer developmental origins. Such stratification of a given interneuron critically dictates its afferent/efferent connectivity, hence governing participation during discrete patterns of hippocampal network activity (Klausberger and Somogyi, 2008). Finally, recent work revealing that neocortical neurogliaform interneurons arise from CGE progenitors (Miyoshi et al., 2010) while most hippocampal neurogliaform cells originate from MGE precursors (Tricoire et al., 2010) points to potential differences between the neocortex and hippocampus.
Here, we performed a longitudinal developmental analysis of the precursors of different mouse hippocampal interneuron subpopulations. We used a multiparametric approach combining genetically inducible fate-mapping strategies, including birth dating, with immunohistochemical, electrophysiological, anatomical, and molecular analyses to directly compare and contrast MGE- and CGE-derived hippocampal interneurons.
Materials and Methods
Animals.
All experiments were conducted in accordance with animal protocols approved by the National Institutes of Health. Breeding, tamoxifen treatment, and genotyping were performed as described previously (Tricoire et al., 2010). For staging of embryos, noon on the day of the appearance of a vaginal plug was treated as embryonic day 0.5 (E0.5), and the day of birth was considered postnatal day 0 (P0). For migration studies using inducible lines (Mash1CreER:RCE and Olig2CreER:ZEG), pregnant females were administered 4 mg of tamoxifen (Sigma-Aldrich) in corn oil (20 mg/ml) by oral gavage on E10.5, E12.5, E14.5, or E16.5.
Immunofluorescence.
All primary antibodies used in the study are described in Table 1 in a total volume of 100 μl (for each primer pair, the sense and antisense primers were positioned on two different exons). A second round of PCR was then performed using 2 μl of the first PCR product as a template. In the second round, each cDNA was amplified individually with a second pair of primers internal to the primer pair used in the first PCR (nested primers) (Table 2) and positioned on two different exons. As a control for our ability to detect transcript when present the RT-PCR protocol was tested on 100 pg of total RNA purified from mouse whole brain and all transcripts were detected (data not shown). The sizes of the PCR-generated fragments were as predicted by the mRNA sequences (Table 2). Routinely, a control for mRNA contamination from surrounding tissue was performed by placing a patch pipette in the slice without establishing a seal and following the removal of the pipette its contents was processed as described above. PCR product was never obtained using this protocol. Moreover, in separate controls VGluT1 mRNA, which is always detected by our standard scPCR protocol for pyramidal cell harvests, was detected in <10% (17 of 175) of interneuron harvests indicating the potential for false-positive signals from surrounding pyramidal cells is minimal for this scPCR protocol [for example, see Vullhorst et al. (2009), their Fig. 3]. Finally, to determine the potential degree of contamination by pericellular glial cells attached to targeted interneurons, we probed for several glial markers in separate control interneuron harvests. Again the lack of significant detection of GFAP (0 of 10), NG2 (0 of 10), MBP (1 of 10), and S100β (0 of 10) in these interneuron harvests, all of which were positive for GAD65/67 (10 of 10), further indicates limited surrounding tissue contaminant detection with this protocol.
Table 1.
List of primary antibodies
| Antigen | Antigen details | Host | Clonality | Dilution | Supplier | Catalog no. | Purification method | Reference/specificity |
|---|---|---|---|---|---|---|---|---|
| CCK | Gastrin-17 | Mouse | Monoclonal | 1:1000 | Dr. G. Ohning (CURE, University of California, Los Angeles, Los Angeles, CA) | 9303 | Ascites fluids | Recognizes gastrin and CCK, but gastrin is absent of telencephalon (Ohning et al., 1996) |
| CR | Recombinant rat calretinin | Rabbit | Polyclonal | 1:1000 | Millipore | AB5054 | Antiserum | Western blot shows a single band at 32 kDa molecular weight (manufacturer). Labeling pattern as published in previous reports (Fonseca et al., 1995) |
| CoupTFII | Recombinant human COUP-TF II (amino acids 43–64) | Mouse | Monoclonal | 1:200 | Perseus Proteomics; clone H7147 | PP-H7147-00 | Ascites fluids | Tested by Western blot and KO animal (Qin et al., 2007) |
| GFP | Recombinant GFP | Chicken | Polyclonal | 1:2000 | Aves Labs | GFP-1020 | IgY fraction | No immunohistochemistry signal can be detected from the GFP-negative Cre+;Z/EG−/− mouse tissue |
| PV | Purified frog muscle parvalbumin | Mouse | Monoclonal | 1:1000 | Sigma-Aldrich; clone PARV-19 | P3088 | Ascites fluids | Labeling pattern as with rabbit antiserum (Swant; PV-28) (Kubota et al., 2011) |
| PV | Rat muscle parvalbumin | Rabbit | Polyclonal | 1:1000 | Swant | PV-28 | Antiserum | No labeling in KO mouse (Schwaller et al., 1999) |
| M2R | Amino acids 225–359 | Rat | Monoclonal | 1:500 | Millipore; clone M2-2-B3 | MAB367 | Protein A purified | Levey et al., 1995 |
| nNOS | Recombinant human neuronal nitric oxide synthase | Rabbit | Polyclonal | 1:1000 | Millipore | AB5380 | Peptide affinity chromatography | Labeling pattern as published with other antibodies (Fuentealba et al., 2008) |
| Reelin | Recombinant reelin amino acids 164–496 | Mouse | Monoclonal | 1:1000 | Millipore; clone G10 | MAB5364 | Protein A purified | Recognizes the H epitope near the N terminus of the protein (de Bergeyck et al., 1998). No staining in the reeler mouse (de Bergeyck et al., 1997) |
| SOM | Synthetic cyclic (1–14) somatostatin conjugated to bovine thyroglobulin | Rat | Monoclonal | 1:200 | Millipore; clone YC7 | MAB354 | Culture supernatant | Labeling pattern as published with other antibodies (Eyre et al., 2009) |
| SOM | Same as the rat antibody | Rabbit | Polyclonal | 1:500 | Dako | A0566 | Antiserum | Labeling pattern as published with the rat antibody (our observation) |
| VIP | Porcine VIP | Guinea pig | Polyclonal | 1:1000 | Peninsula Laboratories | T-5030 | Antiserum | Labeling pattern as published with other antibodies (Eyre et al., 2009) |
Table 2.
Sequences of PCR primers
| Marker | GenBank no. | First PCR primers | Size | Second PCR primers | Size |
|---|---|---|---|---|---|
| 5HT3AR | NM_013561.2 | Sense, 889: TCAGACACACTGCCAGCAAC | 485 | Sense, 981: GACCATCTTCATTGTGCGGC | 337 |
| (Htr3a) | Antisense, 1356: TATCCCACCCGCAGCCAG | Antisense, 1300: GAAGTGGCGGATGGAGGA | |||
| CCK | NM_031161.3 | Sense, 16: TGTCTGTGCGTGGTGATGGC | 554 | Sense, 192: ATACATCCAGCAGGTCCGCAA | 237 |
| Antisense, 546: GCATAGCAACATTAGGTCTGGGAG | Antisense, 408: CAGACATTAGAGGCGAGGGGT | ||||
| CNP | NM_009923.2 | Sense, −52: CCCCGGAGACATAGTACCCGCAA | 437 | Sense, −22: GACGGCGGTGCGCCCACT | 318 |
| Antisense, 364: GCTCCCGCTCGTGGTTGGTAT | Antisense, 275: GCCTCGGAGAAGTCTGCCCGA | ||||
| CoupTFII | NM_009697.3 | Sense, 605: AGCCTAACAACATCATGGGC | 404 | Sense, 686: ACATCCCCTTCTTCCCTGAC | 318 |
| (Nr2f2) | Antisense, 989: GCTTTCCACATGGGCTACAT | Antisense, 984: CCACATGGGCTACATCAGAC | |||
| CR | NM_007586.1 | Sense, 63: TTGATGCTGACGGAAATGGGTA | 265 | Sense, 141: GCTGGAGAAGGCAAGGAAGG | 151 |
| (Calb2) | Antisense, 327: CAAGCCTCCATAAACTCAGCG | Antisense, 271: ATTCTCTTCGGTCGGCAGGAT | |||
| Enk | NM_001002927.2 | Sense, 92: CTAAATGCAGCTACCGCCTG | 407 | Sense, 119: CAGGCGACATCAATTTCCTG | 202 |
| (Penk) | Antisense, 479: GTTGTCTCCCGTTCCCAGTA | Antisense, 301: TACCGTTTCATGAAGCCTCC | |||
| GAD65 | NM_008078.2 | Sense, 99: CCAAAAGTTCACGGGCGG | 375 | Sense, 219: CACCTGCGACCAAAAACCCT | 248 |
| (Gad2) | Antisense, 454: TCCTCCAGATTTTGCGGTTG | Antisense, 447: GATTTTGCGGTTGGTCTGCC | |||
| GAD67 | NM_008077.4 | Sense, 83: ATGATACTTGGTGTGGCGTAGC | 253 | Sense, 159: CAATAGCCTGGAAGAGAAGAGTCG | 177 |
| (Gad1) | Antisense, 314: GTTTGCTCCTCCCCGTTCTTAG | Antisense, 314: GTTTGCTCCTCCCCGTTCTTAG | |||
| GFAP | NM_010277.3 | Sense, 523: AAGCCACCCTGGCTCGTGTG | 407 | Same as first PCR | 304 |
| Antisense, 910: CTGTTCGCGCATTTGCCGCT | Antisense, 807: TTGGCTTGGCGGAGCAGCTC | ||||
| Lhx6 | NM_008500.2 | Sense, 150: TGCCATGGCTCAGTCAGACGCA | 473 | Sense, 199: GACGAAGGTAGAGCCTCCCCATGT | 206 |
| Antisense, 599: CCTTCTCCTCAACGAGGCCGAATT | Antisense, 383: TGCCTCAGCGATGTGCGACACA | ||||
| MBPa | NM_010777.3 | Sense, 399: ATGGCATCACAGAAGAGACC | 354, 422, 442 | Same as first PCR | |
| Antisense, 721: CATGGGAGATCCAGAGCGGC | 479, 574 | Same as first PCR | |||
| NG2 | NM_139001.2 | Sense, 4841: CAGCACAGGCGCTGACCCTC | 408 | Sense, 4873: ACCGGGTGGTAAGAGGCCCC | 340 |
| (Cspg4) | Antisense, 5229: TGCCGACTGCGCTGAGATGC | Antisense, 5193: AGGTTGGCGGCATCAAGGGC | |||
| nNOS | NM_008712.2 | Sense, 1668: CCTGGGGCTCAAATGGTATG | 373 | Sense, 1742: CCTGTCCCTTTAGTGGCTGGTA | 236 |
| (Nos1) | Antisense, 2021: CACAATCCACACCCAGTCGG | Antisense, 1957: GATGAAGGACTCGGTGGCAGA | |||
| Npas1 | NM_008718.2 | Sense, 945: CATCCTTGCTTGTGAGAGCA | 436 | Sense, 1024: TTTGTTCATGGACAGGATGC | 227 |
| Antisense, 1361: AGGGTCCTTGTCCTTGTCCT | Antisense, 1231: TCCAGGGGTGTTTGACTACC | ||||
| Npas3 | NM_013780.2 | Sense, 730: GCCAGTTCAGCATCTTCCTC | 472 | Sense, 937: ATCATGGGTCTGGTGGTTGT | 204 |
| Antisense, 1155: TCAGCAAGTCCAGGTGACTG | Antisense, 1121: TACATCTTCGGCATGGATGA | ||||
| NPY | NM_023456.2 | Sense, 16: CGAATGGGGCTGTGTGGA | 297 | Sense, 38: CCCTCGCTCTATCTCTGCTCGT | 220 |
| Antisense, 289: AAGTTTCATTTCCCATCACCACAT | Antisense, 236: GCGTTTTCTGTGCTTTCCTTCA | ||||
| PV | NM_013645.3 | Sense, 104: GCCTGAAGAAAAAGAACCCG | 275 | Sense, 122: CGGATGAGGTGAAGAAGGTGT | 163 |
| (Pvalb) | Antisense, 275: AATCTTGCCGTCCCCATCCT | Antisense, 265: TCCCCATCCTTGTCTCCAGC | |||
| S100b | NM_009115.3 | Sense, 48: CAGTACTCCGGGCGAGAGGGT | 405 | Sense, 112: ACAACGAGCTCTCTCACTTCCTGG | 248 |
| Antisense, 431: AGGGGGTTGGGGTTTCATCCCC | Antisense, 336: GCTGTGCCTCCTCTTGTGACCCTC | ||||
| SOM | NM_009215.1 | Sense, 1: ATGCTGTCCTGCCGTCTCCA | 250 | Sense, 41: GCATCGTCCTGGCTTTGGG | 170 |
| (Sst) | Antisense, 231: GCCTCATCTCGTCCTGCTCA | Antisense, 191: GGGCTCCAGGGCATCATTCT | |||
| VGluT1 | NM_182993.2 | Sense, 597: CCCTTAGAACGGAGTCGGCT | 593 | Sense, 621: ACGACAGCCTTTTGCGGTTC | 367 |
| (Slc17a7) | Antisense, 1169: TATCCGACCACCAGCAGCAG | Antisense, 968: CAAAGTAGGCGGGCTGAGAG | |||
| VGluT3b | NM_182959.3 | Sense, 42: AGGAGTGAAGAATGCCGTGGGAGAC | 574 | Sense, 94: GATGGGACCAATGAAGAGGAAGAT | 384 |
| (Slc17a8) | Antisense, 594: ACCCTCCACCAGACCCTGCAAA | Antisense, 453: TGAAATGAAGCCACCGGGAATTTGT | |||
| VIP | NM_011702.2 | Sense, 219: TTATGATGTGTCAAGAAATGCCAG | 424 | Sense, 253: GGAGTTTTCACCAGCGATTACAG | 225 |
| Antisense, 618: TTTTATTTGGTTTTGCTATGGAAG | Antisense, 455: CTCACTGCTCCTCTTTCCATTCA |
Note: Position 1, first base of the start codon. The name of the gene is listed in parentheses when it differs from the usual name of the marker.
aFrom Ye et al. (2003).
bFrom Dal Bo et al. (2004).
Figure 3.

Immunohistochemical markers primarily associated with MGE-derived interneurons. A, B, Representative images illustrating the coexpression of GFP with PV (i), SOM (ii), nNOS (iii), and reelin (iv) in the Nkx2-1Cre:RCE (A) and GAD65-GFP (B) lines. The filled arrowheads indicate interneurons coexpressing GFP and the indicated marker. C, Histogram showing the contribution of GFP+ cells from Nkx2-1Cre:RCE (warm colors) and GAD65-GFP (cool colors) lines to the populations of PV, SOM, nNOS, and reelin immunolabeled interneurons in CA1 [n = 135, 150, 990, and 295, respectively, in the Nkx2-1Cre:RCE. Note that group data reported for GFP+/nNOS+ cells in Nkx2-1:RCE were previously reported by Tricoire et al. (2010); n = 236, 505, 385, and 901, respectively, in the GAD65-GFP line]. D, Number of cells coexpressing GFP with PV, SOM, nNOS, and reelin in the Nkx2-1Cre:RCE line presented as a percentage of the total number of GFP+ cells (n = 395, 417, 1992, and 504, respectively, in the Nkx2-1Cre:RCE). Scale bar: 25 μm.
Quantitative single-cell RT-PCR.
cDNA were generated as described above and subjected to 14 preamplification cycles in the presence of a mix of specific TaqMan gene assays before aliquoting for individual measurement with the same specific gene assays by real-time PCR. Each 10 μl cDNA synthesis reaction was combined with 25 μl of preamplification master mix (Applied Biosystems), 12.5 μl of pooled assays mix (each assay at 0.2×; final concentration, 0.05×), and 2.5 μl of RNase-free water. Pooled assays mix was prepared from individual 20× stock gene assays (primers plus probe) and diluted in 1× Tris-EDTA buffer. Gene assays for PV (ID: Mm00443100_m1), CCK (ID: Mm00446170_m1), VGluT1 (ID: Mm00812886_m1), GAD65 (ID: Mm00484623_m1), and β-actin (TaqMan endogenous control) were purchased from Applied Biosystems. Each 20× gene assay contains two unlabeled PCR primers at 18 μm each, and a FAM (6-carboxyfluorescein) dye-labeled TaqMan MGB probe at 5 μm, except for β-actin control, which contains PCR primers at 3 μm and VIC dye-labeled probe at 5 μm. Gene assays were selected with primer sequences on two different exons. Thermocycling was performed as follows: 95°C, 10 min; 12 cycles of (95°C, 15 s; 60°C, 4 min). This procedure preamplifies cDNA without introducing amplification bias to the sample. For each real-time PCR, 5 μl aliquots of the preamplification reaction were combined to 10 μl gene expression master mix (Applied Biosystems), 1 μl of 20× gene assay, and 4 μl of RNase-free water. Real-time PCR was performed on StepOne instrument as follows: 50°C, 2 min; 95°C, 10 min; 60 cycles of (95°C, 15 s; 60°C, 1 min). Each gene was tested in duplicate and two cells were analyzed in parallel and subjected to analysis using the StepOne software. Cycle threshold (Ct) values were determined for each probe and then normalized relative to the Ct value for β-actin in the same sample serving as an endogenous control. In this way, ΔCt(probed transcript) = Ct(actin) − Ct(probed transcript) provides a relative abundance measure for a given mRNA species in the sample, with positive ΔCt values indicating the transcript is in greater abundance than that of actin, while negative ΔCt values indicate levels lower than that of actin. As the amount of transcript doubles with each cycle, the relative abundance of a given mRNA species within the sample in relation to actin is then determined by 2ΔCt.
Unsupervised cluster analyses.
Unsupervised clustering was performed in Matlab (MathWorks) using 10 electrophysiological parameters (see above), 16 molecular parameters (GAD65, GAD67, PV, CR, NPY, VIP, SOM, CCK, nNOS, VGluT3, 5-HT3, CoupTFII, Lhx6, and Npas1 and 3), and embryonic origin (designated as +1 or −1 for MGE and CGE origin, respectively). For each parameter, experimental observations were standardized by centering to the mean and dividing by the SD. For both Ward and K-means aggregating methods (Ward, 1963; MacQueen, 1967; Hartigan and Wong, 1979), euclidean distance was first calculated between experimental standardized datasets. The K-means algorithm was run starting from 1000 different random initial positions of the K cluster centroids. The best value of K was determined by comparison with the partition obtained from the Ward's algorithm using the adjusted Rand index as a measure of agreement (Rand, 1971; Hubert and Arabie, 1985). The significance of the classification obtained with the K-means method was further validated by comparison with randomized databases as described by Karagiannis et al. (2009). Briefly, a randomized dataset was built by permuting randomly and independently over all of the cells the observations of one or several parameters and leaving the observation of other features unaffected. This operation did not alter the mean values and the SDs of the randomized parameters but disrupted the structured correlations between the measurements of the different features. Clustering of the randomized dataset was performed using the same parameters as for the K-means clustering of the original dataset. The quality of different clustering was quantitatively assessed by means of silhouette analyses (Rousseeuw, 1987). Given a data point i in a cluster A, let a(i) denote the average Euclidean distance between i and other data points in the cluster A and let b(i) denote the average Euclidean distance between i and points in the second closest cluster. The silhouette value S(i) was then computed for each cell using the following formula S(i) = [b(i) − a(i)]/Max[a(i), b(i)]. The global silhouette width S′ for a given partitioning P is defined as the average S(i) over all the cells of the dataset and is used as an overall measure of quality of a possible clustering. For each set of randomized parameters, the silhouette width of the clusterings of 20 independent different randomized databases were computed and compared with the silhouette width of the K-means clustering of the original, nonrandomized dataset. The effective loss of quality was assessed by calculating the quantity [average(S′(randomized)) − S′(original)]/S′(original). Comparisons were performed using Student's t tests. In testing the effect of the number of randomized parameters on the silhouette width, two distinct sequences were used. Either the parameters to be scrambled were randomly picked among the list of 37 parameters, or scrambled parameters were picked in a predefined manner, starting with parameters that least altered silhouette width individually and continuing with parameters with increasing influence on silhouette width.
Results
Time course of interneuron migration toward and within the hippocampus
To begin our study, we examined the migratory routes and time course of hippocampal invasion by cells derived from MGE and CGE progenitors throughout embryonic and postnatal development. To delineate the MGE- and CGE-derived cohorts of interneurons, we first used transgenic mouse lines that selectively and constitutively GFP label cells derived from either of these two progenitor regions. Nkx2-1 is a homeodomain transcription factor that is expressed in the MGE, but absent from the CGE, that is responsible for MGE patterning and interneuron specification (Xu et al., 2004, 2008; Fogarty et al., 2007; Butt et al., 2008). Accordingly, we used Nkx2-1Cre:RCE transgenic mice to examine MGE-derived interneurons (Sousa et al., 2009; Tricoire et al., 2010). For examination of CGE-derived interneurons, we took advantage of GAD65-GFP transgenic mouse line that specifically labels interneurons derived from the CGE progenitor pool (López-Bendito et al., 2004).
Consistent with previous reports (Lavdas et al., 1999; Rubin et al., 2010), interneurons derived from the MGE and CGE follow similar routes of migration from their site of genesis to the hippocampus, tangentially migrating through both the marginal zone (MZ) and the intermediate/subventricular zone (IZ/SVZ) streams (Fig. 1A–C,F–H). The first interneurons enter the hippocampus on or slightly after E14.5 with peak invasion occurring between E15 and E18. Indeed, peak densities for interneurons of both MGE and CGE lineages occurred at a late embryonic stage, E18, reaching maximal values of 23,033 ± 988 and 10,271 ± 552.9 cells/mm3 for MGE- and CGE-derived GFP+ interneurons, respectively (Fig. 1K,L). Interestingly, it appears that CGE-derived interneurons are added at a slower rate with a minor temporal delay compared with MGE-derived interneurons (Fig. 1K,L) consistent with reports in the neocortex (Miyoshi et al., 2007, 2010; Rubin et al., 2010). Postnatally, both interneuron cohorts exhibit a dramatic reduction in cell densities with MGE-derived interneurons falling to 12,097 ± 265 cells/mm3 and CGE-derived interneurons falling to 3889 ± 223 cells/mm3 within 5 d after birth representing 48% and 62% decreases, respectively, from the levels at P0 (Fig. 1K,L). The density of interneurons from both origins continues to decrease ultimately falling to 1501.4 ± 62.5 and 3585 ± 143.4 cells/mm3 for CGE and MGE interneurons, respectively. Upon arrival at the hippocampus, interneurons of both lineages can be observed to populate all layers with a majority of the migrating interneurons following the MZ stream into stratum lacunosum moleculare (s.l.m.). The interneurons invade the CA1 region on or around E15.5 and by E17.5 can be found in all hippocampal regions (CA1, CA3, and dentate gyrus).
Figure 1.

Migration of MGE- and CGE-derived interneurons into the hippocampus during development. A–E, Representative images illustrating the migration of GFP-labeled MGE-derived interneurons in the Nkx2-1Cre:RCE line between E13.5 and P30. F–J, Representative images illustrating the migration of GFP-labeled CGE-derived interneurons in the GAD65-GFP line between E13.5 and P30. All sections were counterstained with DAPI (blue). Interneurons of both MGE and CGE origin follow similar routes of tangential migration along the marginal zone (MZ) and intermediate/subventricular zone (SVZ) from the ganglionic eminences to the hippocampus (HP). Scale bar: (in J) 200 μm (all panels). K, L, Histograms illustrating the density of MGE- and CGE-derived GFP+ interneurons within the hippocampus in the Nkx2-1Cre:RCE and GAD65-GFP lines, respectively, at the times indicated. Total number of cells counted (from left to right) were as follows: for the Nkx2-1Cre:RCE, n = 0, 24, 7493, 8428, 16,256, 14,912, 14,513, 15,610, 10,011, 7810, and 6177; and for GAD65-GFP, n = 0, 40, 406, 2292, 3048, 4284, 9995, 5611, 4591, 2403, and 1776. Error bars indicate SEM.
In general, our migration studies illustrate a rapid increase in hippocampal interneuron density from E14.5 to E18, followed by a dramatic decrease between P0 and P30. Interestingly, comparison of CGE-derived interneuron densities between the hippocampus and neocortex reveals almost identical results across all embryonic and postnatal time points examined (López-Bendito et al., 2004). While some of the postnatal reduction in interneuron density reflects dilution due to expanding brain volume, earlier work has demonstrated a peak in neuronal death between P4 and P8, with continued loss during the first 2 postnatal weeks indicating another potential factor contributing to the dramatic reduction in interneuron density (Verney et al., 2000). Throughout development, CGE-derived interneurons primarily populated superficial layers of the hippocampus concentrating in s.l.m. and deep stratum radiatum (s.r.), whereas MGE-derived interneurons distributed throughout all layers similar to MGE/CGE patterning in the neocortex (Butt et al., 2005; Lee et al., 2010; Miyoshi et al., 2010; Rubin et al., 2010).
The constitutive expression of GFP in cells of the GAD65-GFP and Nkx2-1 transgenic mice after exiting the CGE and MGE progenitor pools allows for a global investigation of large numbers of interneurons born throughout embryogenesis. However, recent work has illustrated that the ultimate identity of an interneuron within a given cortical circuit is influenced both by birth location and date (Butt et al., 2005; Miyoshi et al., 2007, 2010). Thus, to investigate any potential role for birth date on migration to and invasion of interneurons into the hippocampus, we used temporally inducible genetic fate mapping (Joyner and Zervas, 2006). The Mash1CreER driver line contains a tamoxifen-inducible form of Cre recombinase regulated by expression of the transcription factor Mash1. Although Mash1 is expressed throughout the entire ventral telencephalon (Guillemot et al., 1993), this particular driver line when crossed with the Cre-dependent EGFP reporter (RCE:loxP) labels interneurons of the lateral ganglionic eminence (LGE) and CGE, but not the MGE (Miyoshi et al., 2010). Importantly, the LGE does not contribute appreciable numbers of cortical interneurons (Wichterle et al., 2001; Nery et al., 2002; Yozu et al., 2005), allowing use of the Mash1CreER:RCE mouse to investigate CGE-derived hippocampal interneurons of known birth date by providing temporally limited tamoxifen exposure at different times during embryonic development. To similarly examine temporally distinct cohorts of MGE-derived interneurons, the Olig2CreER:ZEG mouse line can be used. In this line, tamoxifen-induced activity of Cre recombinase, under the control of the Olig2 locus, drives the expression of GFP reporter Z/EG selectively in MGE-derived interneurons (Miyoshi et al., 2007; Tricoire et al., 2010). In both lines, a single tamoxifen administration to pregnant females allows for ∼24 h of CreER activity allowing for birth dating of GFP+ interneurons in the pups to within 1 d of tamoxifen treatment (Miyoshi et al., 2007, 2010; Tricoire et al., 2010). For these studies, tamoxifen was administered at either E10.5 and E12.5 or E12.5, E14.5, and E16.5 for Olig2CreER:ZEG and Mash1CreER:RCE, respectively, to cover the beginning and peak time points for neurogenic waves arising from MGE and CGE (Miyoshi et al., 2007, 2010) (see below). Tissue from the pups was then examined 2, 3, or 4 d later to create “snapshots” of the migration from the MGE and CGE, as well as postnatally to look at the integration of labeled interneurons into the mature circuit.
For interneurons born in the CGE (Mash1CreER:RCE) labeled by tamoxifen administration on E12.5, migration to the hippocampus required ∼72 h, while those labeled by tamoxifen treatment on E14.5 and E16.5 arrived in the hippocampus within 48 h despite a longer migratory route imposed by the rapidly increasing size of the brain (Fig. 2A–G). Embryonically, CGE-derived interneurons tamoxifen fate mapped at E14.5 were the most concentrated, reaching 6687.8 ± 343 cells/mm3 by E18.5, while cells revealed by tamoxfien administration on E12.5 and E16.5 had maximum densities of 5295 ± 243 and 4107 ± 272 cells/mm3, respectively, at the same stage of development (Fig. 2G). This prevalence of E14.5 cells was not evident in the juvenile hippocampus as cell densities for E12.5, E14.5, and E16.5 tamoxifen fate-mapped interneurons decreased to similar values (320 ± 175, 454 ± 123, and 279 ± 79 cells/mm3, respectively) by P30 (Fig. 2G).
Figure 2.

Time course of MGE- and CGE-derived interneuron migration to the hippocampus from the ganglionic eminences. A–F, Representative images illustrating the migration of GFP+ CGE-derived interneurons generated on E12.5 in the Mash1CreER:RCE line. The time points indicate the duration between tamoxifen administration (E12.5 for all panels) and when tissue was collected. Sections were counterstained with DAPI (blue). The yellow arrowhead indicates the hippocampal anlage (HP). The migration from their site of genesis on E12.5 in the CGE to hippocampus lasts ∼72 h. Scale bar: (in D) 200 μm (all panels). G, H, Histograms illustrating the normalized density of CGE- and MGE-derived hippocampal interneurons from the Mash1CreER:RCE and Olig2CreER:ZEG lines for tamoxifen administrations between E10.5 and E16.5 as indicated. Data are normalized to the peak density observed for all tamoxifen injection time points within each mouse line (E14.5 + 96 h for Mash1CreER:RCE and E12.5 + 48 h for Olig2CrER:ZEG). The duration of migration for interneurons generated later in development is shorter than those born early despite the fact that the enlarging brain has resulted in a longer path of migration. Total number of cells counted (from left to right) were as follows: for the Mash1CreER:RCE, n = 0, 2248, 2713, 2419, 1746, 988, 3516, 3016, 5144, 3402, 1888, 1462, 2282, 2896, 2340, 1455, 1072, 583; and for the Olig2CreER:ZEG, n = 0, 0, 146, 151, 73, 44, 211, 174, 156, 94, 73, 59.
In the Olig2 mouse line, considerably fewer GFP+ interneurons were generated for a given tamoxifen pulse due to poor recombination efficiency in this transgenic line (Miyoshi et al., 2007). Nonetheless, the same general trends as observed for temporally distinct cohorts of CGE-derived interneurons were evident. E10.5 tamoxifen fate-mapped MGE-derived interneurons required 4 d to migrate to the hippocampus, reaching a concentration of 253 ± 49 cells/mm3 by E14.5 (Fig. 2H). In contrast, interneurons born later in the MGE, revealed by tamoxifen treatment on E12.5, reached the hippocampus within 48 h at a concentration of 573 ± 123 cells/mm3 (Fig. 2H). For these MGE-derived interneurons, we again observed a rapid reduction in interneuron densities to 42 ± 22 and 77 ± 31.6 cells/mm3 for E10.5 and E12.5 tamoxifen fate-mapped interneurons, respectively, by P30 (Fig. 2H). Similar to results from the Nkx2-1Cre:RCE and GAD65-GFP mice, fate-mapped interneurons from both the CGE and MGE localize to all layers of the hippocampus and invade CA1 1 d before CA3 and DG.
Overall, our interneuron migration times from both ganglionic eminences to the hippocampus (48–72 h) are longer than reported for migration to the neocortex (24–48 h) (Wichterle et al., 2001; Miyoshi et al., 2007; Miyoshi and Fishell, 2011), likely reflecting the greater distance that must be traveled. The increased migration rate we observed for cells born later in development also occurs for neocortically destined interneurons (Miyoshi et al., 2010) and may result from a shift in the balance between attractive and repulsive guidance cues within the MZ and IZ/SVZ migratory paths (López-Bendito et al., 2008; Chédotal and Rijli, 2009; Marin et al., 2010).
CCK-, CR-, VIP-, and M2R-expressing interneurons have a distinct origin from PV-, SOM-, and nNOS-expressing interneurons
Classically, hippocampal GABAergic interneuron subtypes have been distinguished to a large degree based on unique neurochemical signatures observed with immunostaining (Freund and Buzsáki, 1996; McBain and Fisahn, 2001; Mátyás et al., 2004; Somogyi and Klausberger, 2005). Thus, we next explored the developmental origin of molecularly distinct interneuron cohorts by immunostaining hippocampal sections from 1- to 2-month-old Nkx2-1Cre:RCE and GAD65-GFP mice probing for well established markers that cover much of the overall known diversity across hippocampal interneurons (Figs. 3, 4). For these studies, we examined the overlap between a given marker and GFP, focusing on cells within the CA1 subfield where interneuron diversity has been best characterized and laminar location aids in identifying specific interneuron subtypes (for review, see Klausberger and Somogyi, 2008). In MGE-derived interneurons of the Nkx2-1Cre:RCE line, the markers PV, SOM, and nNOS strongly colocalized with GFP in largely non-overlapping populations of cells located predominantly in stratum pyramidale (s.p.), stratum oriens (s.o.), and s.l.m., respectively (Fig. 3). Indeed, 86% of PV+, 68% of SOM+, and 73% of nNOS+ interneurons were GFP labeled in Nkx2-1Cre:RCE mice (Fig. 3A,C). Moreover, PV+, SOM+, and nNOS+ interneurons combined accounted for >90% of MGE-derived interneurons representing 30% (n = 395), 24% (n = 417), and 37%, respectively, of the total GFP+ cohort of CA1 cells in Nkx2-1Cre:RCE mice (Fig. 3D). In stark contrast, PV+, SOM+, and nNOS+ cells were rarely observed to colocalize with CGE-derived GFP+ cells of GAD65-GFP mice, confirming that MGE and CGE give rise to neurochemically distinct interneuron cohorts (Fig. 3B,C). Instead, CGE-derived GFP+ interneurons commonly stained for CR, CCK, M2R, and VIP, which accounted for 19, 27, 6, and 12% of GFP+ interneurons in GAD65-GFP mice, respectively (Fig. 4B,D). Conversely, 20, 53, 36, and 39% of CR+, CCK+, M2R+, and VIP+ interneurons, respectively, also stained for GFP in the GAD65-GFP mouse line (Fig. 4C) [note: our quantitative data for GFP and VIP colocalization reported here includes counts previously reported by Cea-del Rio et al. (2010)]. Of these markers, only CR exhibited any significant, albeit minor (2% of GFP+ cells), overlap with MGE-derived GFP+ cells in Nkx2-1Cre:RCE mice, further confirming that MGE and CGE give rise to neurochemically distinct hippocampal interneuron cohorts (Fig. 4A,C). It is important to note that our overall counts significantly underestimate the colocalization of GFP and CR in interneurons because of the staining of large numbers of CR-containing Cajal-Retzius cells within s.l.m. (Marchionni et al., 2010), which have distinct embryonic origins from GABAergic interneurons and hence are not GFP labeled in our mouse lines (Soriano et al., 1994; Soriano and Del Río, 2005). Thus, while in total only 15% of all CR+ cells were GFP labeled in GAD65-GFP mice, this number more than doubles to 39% when considering s.r. in isolation.
Figure 4.
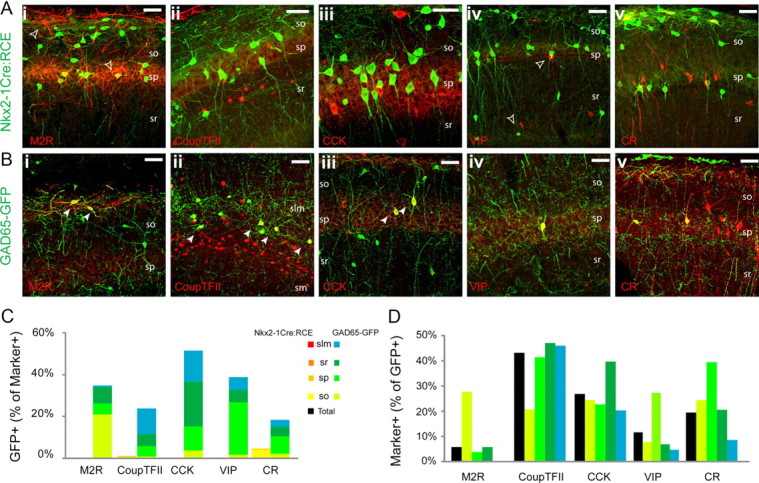
Immunohistochemical markers primarily associated with CGE-derived interneurons. A, B, Representative images illustrating the coexpression of GFP with M2R (i), CoupTFII (ii), CCK (iii), VIP (iv), and CR (v) in the Nkx2-1Cre:RCE (A) and GAD65-GFP (B) lines. The filled arrowheads indicate interneurons coexpressing GFP and the indicated marker. The open arrowheads indicate cells expressing the indicated marker but not GFP. C, Histogram showing the contribution of GFP+ cells from Nkx2-1Cre:RCE (warm colors) and GAD65-GFP (cool colors) lines to the populations of M2R-, CR-, CCK-, VIP-, and CoupTFII-immunolabeled interneurons in CA1 (n = 76, 151, 242, 144, and 216, respectively, in the Nkx2-1Cre:RCE; n = 133, 854, 281, 163, and 1376, respectively, in the GAD65-GFP). D, Number of cells coexpressing GFP with M2R, CR, CCK, VIP, and CoupTFII in the GAD65-GFP line presented as a percentage of the total number of GFP+ cells [n = 867, 798, 545, 556, 767, respectively, in the GAD65-GFP; note that group data concerning GFP+/VIP+ cells in GAD65-GFP mice includes counts previously reported as supplemental data in Cea-del Rio et al. (2010)]. Scale bar: 25 μm.
In general, our findings to this point are consistent with reports in the neocortex where MGE and CGE give rise to non-overlapping populations of neurochemically distinct interneurons. Indeed, similar to our current findings, MGE-derived neocortical interneurons comprise PV+ and SOM+ subgroups with a very minor contribution to CR+ cells that are likely a subset of the SOM+ cohort (Xu et al., 2004, 2006; Butt et al., 2005; Cobos et al., 2005; Flames et al., 2007; Fogarty et al., 2007; Miyoshi et al., 2007). In contrast, the CGE contributes CCK+, VIP+, and the majority of CR+ neocortical interneurons, also consistent with our current observations (López-Bendito et al., 2004; Xu et al., 2004; Miyoshi et al., 2010; Rubin et al., 2010). In addition, we confirmed that hippocampal nNOS+ interneurons primarily derive from MGE consistent with the MGE origin of NPY+ hippocampal cells as NPY and nNOS commonly colocalize in hippocampal interneurons (Pleasure et al., 2000; Price et al., 2005; Fogarty et al., 2007; Fuentealba et al., 2008). Indeed, we have previously shown that NPY+/nNOS+ neurogliaform and Ivy cells of the hippocampus have an MGE lineage (Tricoire et al., 2010). Our results also demonstrate a CGE origin for all M2R+ hippocampal interneurons. As M2R immunoreactivity is associated with a subset of projection interneurons in the hippocampus, such as the stratum oriens hippocampo-subiculum projecting trilaminar cell (Sik et al., 1995; Hájos et al., 1998; Ferraguti et al., 2005; Jinno et al., 2007), our findings indicate a CGE origin for M2R+ projection cells.
Recently, the CGE has also been demonstrated to give rise to a relatively large population of reelin+ neocortical interneurons that do not overlap with the VIP/CR-expressing cohort (Miyoshi et al., 2010; Rubin et al., 2010). Although many SOM+ interneurons coexpress reelin (Pesold et al., 1999; Ramos-Moreno et al., 2006; Fuentealba et al., 2010; Miyoshi et al., 2010), the CGE gives rise to a distinct population of reelin+/SOM− neocortical interneurons. In the hippocampus, we similarly found reelin immunoreactivity in GFP+ cells for both MGE- and CGE-derived interneurons but with distinct laminar localizations (Fig. 3A–D). MGE-derived GFP+/reelin+ cells in Nkx2-1Cre:RCE mice strongly localized to s.o. (82% of the total reelin+/GFP+ group), likely representing SOM/reelin-coexpressing cells (Fuentealba et al., 2010; Miyoshi et al., 2010). In addition, a smaller population (18%) of MGE-derived reelin+/GFP+ cells were present in s.l.m., which are likely to represent MGE-derived neurogliaform cells (Fuentealba et al., 2010; Tricoire et al., 2010). GFP+/reelin+ cells in GAD65-GFP mice were found almost exclusively in s.l.m. (79% of GFP+/reelin+), likely also representing neurogliaform cells but of CGE origin (Fuentealba et al., 2010; Tricoire et al., 2010). In addition, reelin, like CR, labeled many GFP-negative Cajal-Retzius cells in s.l.m., leading to an underestimate of the contribution of GFP+ interneurons to the overall reelin-labeled cohort of cells (Fig. 3B,C).
Finally, we examined the expression pattern of CoupTFII, which has recently been associated with CGE-derived cortical interneurons (Kanatani et al., 2008; Fuentealba et al., 2010; Miyoshi et al., 2010; Tricoire et al., 2010). Consistent with these reports, we also found CoupTFII immunoreactivity to commonly label GFP+ interneurons from GAD65-GFP mice (43% of GFP+ cells) with only minimal colocalization in Nkx2-1Cre:RCE mice (Fig. 4A–D).
CCK-, CR-, VIP-, and M2R-expressing interneurons are generated later than PV-, SOM-, and nNOS-expressing interneurons
As mentioned above, birth date has been shown to influence fate determination of cortical interneurons (Butt et al., 2005; Miyoshi et al., 2007, 2010). Thus, to examine any potential temporal order to the generation of neurochemically distinct MGE- and CGE-derived interneurons, we combined inducible genetic fate mapping with immunolabeling for our panel of interneuron markers in the Olig2CreER:ZEG and Mash1CreER:RCE double-transgenic mice (Figs. 5, 6). Once again, pregnant females were administered a single dose of tamoxifen by gavaging at different time points during gestation and then tissue from 3- to 4-week-old offspring was probed for a given marker to examine the colocalization of the marker with GFP in the CA1 area of the hippocampus. For the MGE-derived cohort, tamoxifen was administered to Olig2CreER:ZEG mothers between E9.5 and E15.5 (Miyoshi et al., 2007). However, we did not observe any GFP-labeled interneurons in the hippocampus after treatment later than E13.5 despite the presence of GFP+ cells in the neocortex, which confirmed that tamoxifen was successfully administered. This indicates that hippocampal MGE-derived interneurons are generated earlier and within a narrower temporal window than their neocortical homologs. For the CGE-derived cohort, tamoxifen was administered to Mash1CreER:RCE mothers between E10.5 and E16.5 (Miyoshi et al., 2010). However, as very few GFP-labeled cells were observed in the hippocampus for E10.5 and E11.5 treatments, we limited our characterization to interneurons fate-mapped from E12.5 to E16.5. It is important to note that, although the MGE generates significantly more cortical interneurons than the CGE (Miyoshi et al., 2010), the Olig2CreER:ZEG mouse line yields considerably lower numbers of GFP-positive cells than with the Mash1CreER:RCE line for the same dose of tamoxifen due to the weak recombination efficiency within the Olig2 line (Miyoshi et al., 2007).
Figure 5.
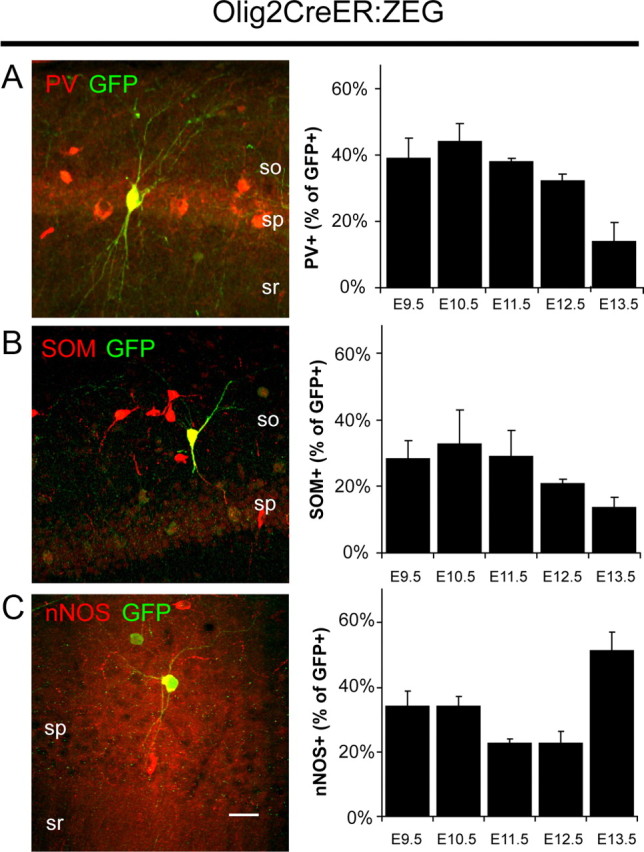
Inducible genetic fate mapping of MGE-derived interneurons. A–C, Left, Representative examples of PV (A), SOM (B), and nNOS (C) expression in fate-mapped interneurons in the mature hippocampus of Olig2CreER:ZEG mice treated with tamoxifen at E9.5 (for PV and SOM) or E10.5 (for nNOS). Scale bar: 25 μm. Right, Contribution of PV+ (A), SOM+ (B), and nNOS+ (C) interneurons to the cohort arising from MGE between E9.5 and E13.5 [for PV, n = 179, 141, 121, 177, and 50, respectively; for SOM, n = 89, 104, 73, 97, and 37; for nNOS, n = 79, 79, 124, 79, and 39; group data for GFP+/nNOS+ cells were previously reported by Tricoire et al. (2010)]. Error bars indicate SEM.
Figure 6.

Inducible genetic fate mapping of CGE-derived interneurons. A–F, Left, Representative examples of M2R (A), CCK (B), VIP (C), CoupTFII (D), reelin (E), and CR (F) expression in fate-mapped interneurons in mature hippocampus of Mash1CreER:RCE mice treated with tamoxifen at E12.5 (for M2R), E15.5 (for VIP and CR), or E16.5 (for CCK, CoupTFII, and reelin). Scale bar: 25 μm. Right, Contribution of M2R+ (A), CCK+ (B), VIP+ (C), CoupTFII+ (D), reelin+ (E), and CR+ (F) interneurons to the cohort arising from CGE between E12.5 and E16.5 (for M2R, n = 168, 188, 236, 290, and 185, respectively; for CCK, n = 167, 225, 234, 209, and 203, respectively; for VIP, n = 187, 211, 205, 312, and 193, respectively; for CoupTFII, n = 168, 201, 217, 296, and 217, respectively; for reelin, n = 142, 294, 161, 303, and 262, respectively; for CR, n = 164, 266, 248, 350, and 233, respectively). Error bars indicate SEM.
Consistent with our findings in the Nkx2-1Cre:RCE line, PV+, SOM+, and nNOS+ interneurons represented the major populations of GFP+ fate-mapped interneurons found in the Olig2CreER:ZEG line. Although all three of these interneuron cohorts were observed for each tamoxifen time point, a subtle temporal order to their generation was evident (Fig. 5A–C). Whereas nNOS interneurons were generated in a bimodal manner with early (E9.5–E10.5) [note: data shown in Fig. 5C are replotted from the study by Tricoire et al. (2010)] and late (E13.5) peaks, PV+ and SOM+ cells emerged from the MGE primarily at early tamoxifen injection time points (E9.5 and E10.5) with their production dramatically falling off by E13.5.
In general, the Mash1CreER:RCE line revealed a delayed production of CGE-derived hippocampal interneurons relative to the MGE consistent with findings in the neocortex (Miyoshi et al., 2007, 2010; Lee et al., 2010; Rubin et al., 2010). Examination of specific subpopulations arising from the CGE indicated that CCK+, VIP+, and M2R+ interneurons are primarily generated at early time points (tamoxifen fate mapped at E12.5 and E13.5) with production falling through the E16.5 tamoxifen time point when CR+ cells become the dominant population emerging from the CGE (Fig. 6A–C,F). In contrast, reelin-expressing interneurons are produced consistently throughout this developmental period representing ∼40% of CGE-derived interneurons at all time points examined (Fig. 6E). Similarly, CoupTFII-expressing cells were consistently observed to emerge from CGE progenitors throughout development (Fig. 6D), as expected for a marker that labels multiple cohorts of CGE-derived interneurons (Kanatani et al., 2008).
Overall, the temporal profiles of hippocampal PV+, SOM+, VIP+, and reelin+ interneuron generation are similar to those of the neocortex but with a slight shift toward earlier embryonic stages (Miyoshi et al., 2007, 2010; Batista-Brito et al., 2009). In contrast, CR+ interneurons, which often coexpress VIP in the neocortex (Cauli et al., 1997), are generated at much later stages if they are destined for the hippocampus.
Combined electrophysiological, molecular, and anatomical characterization of MGE- and CGE-derived hippocampal interneurons
While immunostaining patterns are useful for broadly parsing major interneuron subgroups, the ultimate identification of a given interneuron requires combined knowledge of its molecular, electrophysiological, and anatomical properties. Thus, we next investigated MGE- and CGE-derived interneurons using patch-clamp recording techniques in combination with post hoc scPCR and morphological inspection of GFP+ interneurons in acute brain slices from Nkx2-1Cre:RCE and GAD65-GFP mice (Figs. 7, 8). Electrophysiological profiles included 20 features of intrinsic excitability and firing properties that were assayed while the scPCR protocol was designed to detect simultaneously the transcripts of 16 common interneuron markers, including most of those assayed by immunocytochemistry above (see Materials and Methods).
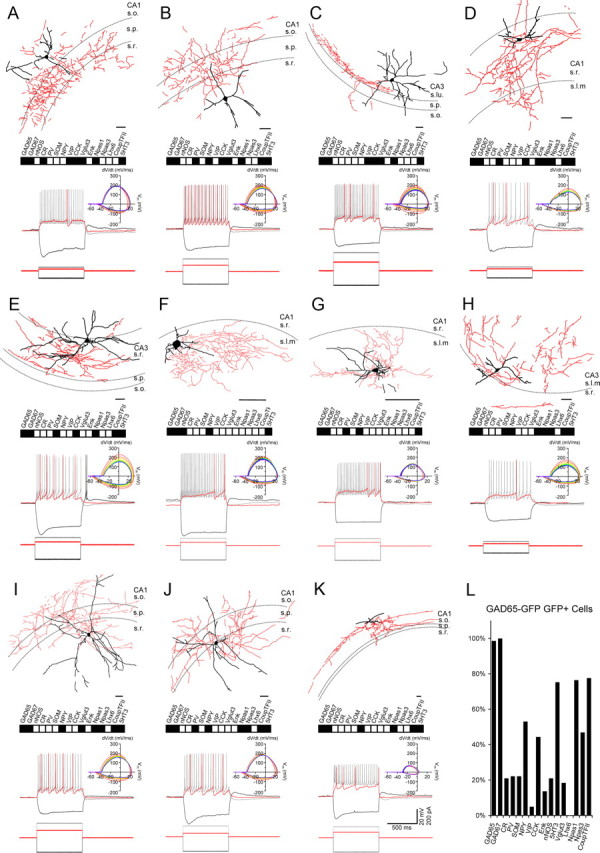
Figure 7.

Representative MGE-derived hippocampal interneurons. A–K, Neurolucida reconstructions of GFP+ interneurons recorded in slices from P15–P30 Nkx2-1Cre:RCE pups (dendrites and soma in black; axon in red). Scale bar: 100 μm. The dashed lines indicate the approximate boundaries of s.o., s.p., s.r., and s.l.m. Under each drawing is shown the molecular profile obtained from single-cell PCR analysis for the recorded cell with filled boxes indicating transcripts detected. Also shown are the electrophysiological responses of the cells to the indicated square wave current pulses (bottom) from a resting potential near −60 mV. Depolarizing current pulses and corresponding responses are for near threshold and 2× threshold stimulation (scale bars shown in K are for all traces). Phase plots of the APs arising from 2× threshold stimulation are shown at right, with the first AP phase plot colored red and subsequent APs progressing from warm to cool colors ending in violet. L, Histogram summarizing the frequency of occurrence for the 16 transcripts probed by scPCR among the MGE cohort of recorded cells.
Figure 8.
Representative CGE-derived hippocampal interneurons. A–K, Neurolucida reconstructions of GFP+ interneurons recorded in slices from P15–P30 GAD65-GFP pups (dendrites and soma in black; axon in red). Scale bar: 100 μm. The dashed lines indicate the approximate boundaries of strata oriens (s.o.), pyramidale (s.p.), radiatum (s.r.), lacunosum moleculare (s.l.m.), and lucidum (s.lu.). Under each drawing is shown the molecular profile obtained from single-cell PCR analysis for the recorded cell with filled boxes indicating transcripts detected. Also shown are the electrophysiological responses of the cells to the indicated square wave current pulses (bottom) from a resting potential near −60 mV. Depolarizing current pulses and corresponding responses are for near-threshold and 2× threshold stimulation (scale bars shown in K are for all traces). Phase plots of the APs arising from 2× threshold stimulation are shown at right, with the first AP phase plot colored red and subsequent APs progressing from warm to cool colors ending in violet. L, Histogram summarizing the frequency of occurrence for the 16 transcripts probed by scPCR among the CGE cohort of recorded cells.
In the Nkx2-1Cre:RCE mice, we obtained complete scPCR and electrophysiological profiles for 61 recorded interneurons throughout the different layers of CA1 and CA3; anatomical reconstructions, scPCR results, and basic electrophysiological properties of cells that represent the major subtypes observed are illustrated in Figure 7A–K. Consistent with our staining data, we frequently encountered putative fast-spiking PV+ perisomatic targeting basket cells (Fig. 7A) as expected from the MGE origin of the neocortical counterpart of this cell (Butt et al., 2005; Miyoshi et al., 2007). Similar to fast-spiking basket cells (FS-BCs) from an electrophysiological perspective, we also regularly recorded another group of MGE-derived fast-spiking cells displaying anatomy consistent with previously described SOM+/PV+ bistratified cells (BiCs) with axons that target the apical and basolateral dendritic domains of pyramidal cells while mostly avoiding the somatic region targeted by basket cells (Buhl et al., 1994a, 1996; Halasy et al., 1996; Maccaferri et al., 2000; Klausberger et al., 2004). The dendritic arbors of these BiCs could be oriented primarily horizontally around cell bodies located in s.o. (O-BiCs) (Fig. 7B) or more vertically along the s.o.-to-s.l.m. axis from cell bodies located in s.p. (Fig. 7C). On rare occasion, we also encountered fast-spiking cells with axonal arbors containing terminal boutons concentrated in the half of s.p bordering s.o. and in the half of s.o. adjoining s.p. suggestive of PV+ axo-axonic cells (Fig. 7D) (Li et al., 1992; Buhl et al., 1994a,b; Maccaferri et al., 2000; Klausberger et al., 2003; Ganter et al., 2004). As in our previous investigation (Tricoire et al., 2010), we often recorded late-spiking, weakly accommodating, NPY/nNOS transcript containing Ivy and NGF cells throughout all CA layers (Fig. 7I–K) (Vida et al., 1998; Price et al., 2005; Fuentealba et al., 2008, 2010). Another easily recognizable population arising from the MGE progenitor pool was the oriens-lacunosum moleculare (O-LM) interneuron (Fig. 7E), a prominent SOM+ interneuron subgroup of the hippocampus (McBain et al., 1994; Sik et al., 1995; Maccaferri et al., 2000; Losonczy et al., 2002). Compared with the cells described above, O-LM interneurons had slower accommodating firing properties, and more pronounced membrane sag upon hyperpolarization. Similar electrophysiological properties were observed in a group of morphologically diverse MGE-derived cells found throughout s.o., s.p., and s.r. that could not be easily matched to any previously reported hippocampal subtypes (Fig. 7F–H). One of these cells, depicted in Figure 7F, strongly resembles an s.r.–s.l.m. border (R-LM) cell previously described as a perforant path-associated (PPA) interneuron with axon concentrated in s.l.m. that extends into the molecular layer of the dentate and subiculum (Hájos and Mody, 1997; Vida et al., 1998). This categorization is uncertain as PPA interneurons are suggested to immunostain for CCK (Klausberger et al., 2005), which we never observed in GFP+ cells of Nkx2-1Cre:RCE mice. We note, however, that the CCK+ cells described as PPA interneurons appear distinct from those originally described having considerable axon concentration in s.r. as well as s.l.m. [compare Vida et al. (1998), their Fig. 5A, with Klausberger et al. (2005), their Figs. 3, 4]. The axonal projection of the cell displayed in Figure 7G might lead to the mistaken classification as a “trilaminar” interneuron (Sik et al., 1995). Indeed, this s.o. interneuron did project to the subiculum; however, as already noted, trilaminar interneurons are M2R immunoreactive (Hájos et al., 1998; Ferraguti et al., 2005; Jinno et al., 2007), which we only observed in CGE-derived cells (Figs. 4, 6), discounting this MGE-derived cell as a candidate trilaminar cell. Similarly, the cell depicted in Figure 7H is reminiscent of a Schaffer collateral associated cell (SCA); however, SCA cells immunostain positive for CCK (Vida et al., 1998; Cope et al., 2002; Klausberger et al., 2005), which we only observed in CGE-derived interneurons (Figs. 4, 5).
Surprisingly, we frequently detected CCK transcript within MGE-derived interneurons in our scPCR analysis despite never observing CCK immunoreactivity in MGE-derived interneurons. It is possible that the molecular profiles determined by scPCR analysis were confounded by inadvertent collection of contaminant tissue while advancing the recording electrode through slices to target GFP+ interneurons for recording. However, separate control recordings revealed that the potential for false-positive signals from contamination by neighboring pyramidal or glial cells in our standard scPCR protocol was <10% (see Materials and Methods), which is far too low to account for the frequency of CCK transcript detection in MGE-derived interneurons (Fig. 7K). Thus, while CCK protein detection with immunocytochemistry nicely segregates between MGE- and CGE-derived interneurons, CCK transcript detection with standard scPCR appears much less informative of interneuron identity. Indeed, a similar disconnect between CCK protein and transcript detection has previously been observed when comparing immunocytochemical and microarray analyses of cortical PV+ fast-spiking basket cells (Sugino et al., 2006). Other frequently detected transcripts from MGE-derived cells included GAD65, GAD67, PV, SOM, NPY, nNOS, and Lhx6 (Fig. 7K). Of these, only Lhx6 was exclusively detected in MGE-derived interneurons occurring in >80% of the cells recorded in Nkx2-1Cre:RCE mice consistent with the strong expression of this transcription factor in postmitotic neurons generated from MGE precursors (Grigoriou et al., 1998; Alifragis et al., 2004; Liodis et al., 2007).
A total of 81 GFP+ interneurons were recorded in GAD65-GFP mice with representative examples illustrated in Figure 8A–K. In this CGE-derived cohort of cells, we commonly observed another population of perisomatic targeting interneurons (Fig. 8A,B) with properties typical of CCK basket cells that exhibit higher input resistance, prominent sag upon hyperpolarization, and slow accommodating firing properties compared with the fast-spiking MGE-derived basket cells described above (Vida et al., 1998; Cope et al., 2002; Somogyi et al., 2004; Klausberger et al., 2005; Daw et al., 2009, 2010; Cea-del Rio et al., 2010; Lee et al., 2010). Another easily discerned cell from the CGE was the mossy fiber-associated (MFA) cell whose axon targets the proximal apical dendrites of CA3 pyramidal cells within stratum lucidum where the mossy fiber afferents of dentate granule cells reside (Fig. 8C) (Vida and Frotscher, 2000; Losonczy et al., 2004; Pelkey et al., 2005). As for CCK basket cells, MFA interneurons immunostain for CCK (Losonczy et al., 2004) consistent with the coexpression of GFP and CCK in GAD65-GFP and Mash1CreER:RCE mice (Figs. 4, 6). An additional prominent cell group frequently encountered among CGE-derived cells resembled SCA interneurons (Fig. 8D) and their CA3 counterparts [here termed associational commissural-associated (ACA) interneurons (Fig. 8E)]. SCA cells are also CCK immunoreactive and typically reside in s.r. with a major axonal projection that aligns with the CA3 pyramidal cell afferent outputs within s.r. of CA1 (Vida et al., 1998; Cope et al., 2002; Lee et al., 2010; Cea-del Rio et al., 2011). Within s.l.m., we readily encountered GFP+ late-spiking NGF cells in the GAD65-GFP mouse (Fig. 8F,G), consistent with the partial CGE origin of hippocampal NGF interneurons (Fuentealba et al., 2010; Tricoire et al., 2010). Apart from origin, the MGE- and CGE-derived NGF differed by a more variable expression of nNOS transcript and a complete lack of CCK transcript in CGE-derived NGF cells compared with MGE-derived NGF cells, all of which expressed both nNOS and CCK transcripts. Interestingly, neocortical NGF cells are known to be CGE-derived (Miyoshi et al., 2010) and also have a more variable nNOS transcript expression profile than we observed for MGE-derived hippocampal NGF cells (Karagiannis et al., 2009). Moreover, Price et al. (2005) observed a strong correlation between the presence of nNOS and CCK transcripts within a sample of hippocampal NGF cells as well as a population that lacked both transcripts similar to our MGE and CGE subgroups, respectively. Among all the transcripts examined, GAD65, GAD67, NPY, CCK, Npas1, Npas3, CoupTFII, and 5-HT3 were frequently observed in the CGE cohort of interneurons (Fig. 8L). Of these, 5-HT3 most faithfully reported CGE origin as it was never observed in MGE-derived interneurons and could be found in >75% of the CGE-derived cohort consistent with a recently reported 5-HT3A-GFP mouse strain that selectively labels CGE-derived cortical interneurons (Vucurovic et al., 2010). Indeed, although several of the CGE-derived interneurons we recorded were not readily identifiable with previously described hippocampal interneurons they did typically express 5-HT3 transcript (Fig. 8H–K).
Unsupervised cluster analysis of MGE/CGE-derived hippocampal interneurons
While inspection of individual recorded interneurons from basic anatomical, electrophysiological, and molecular perspectives yielded successful classification within previously established subgroups for some of our recorded cells, this approach proved futile for many of the cells obtained within both the MGE and CGE datasets. Moreover, this tactic clearly revealed that cells that group together based on some similarities, such as common spiking behavior, do not necessarily share other features, such as expression of a given transcript. In practical terms, it would be useful to group together cells that share a large number of, but not necessarily all, features with minimal investigator bias. Thus, to independently probe the diversity of MGE- and CGE-derived hippocampal interneurons, we attempted a polythetic classification scheme in which individual groups are not defined on the basis of any single character, but rather on a combination of characters, by subjecting our dataset to unsupervised cluster analyses using the electrophysiological, molecular, and lineage parameters of the recorded cells (Cauli et al., 1997; Karagiannis et al., 2009). Practically, cell origin was set at 1 for GFP+ interneurons recorded from Nkx2-1Cre:RCE mice and −1 for cells from the GAD65-GFP line. To include all 142 recorded cells, we did not consider anatomy in the clustering as axonal recovery was limited for some cells in the dataset. The hierarchical tree shown in Figure 9A reveals the presence of six distinct clusters that emerged when our dataset was first subjected to Ward's clustering algorithm (1 through 6 with n = 19, 19, 36, 29, 18, and 21 cells in each cluster, respectively). Interestingly, clusters 1 and 2 were comprised entirely of MGE-derived interneurons, while clusters 4, 5, and 6 contained only CGE-derived cells, indicating strong segregation of interneuron subtype according to cell origin despite equal weighting of this parameter in the cluster analysis. To validate Ward's classification, we additionally performed a K-means cluster analysis of the dataset (MacQueen, 1967; Hartigan and Wong, 1979; Karagiannis et al., 2009). Unlike Ward's method in which aggregate members of a given cluster cannot exit the cluster after being linked to their nearest neighbors, suboptimal attribution of a given cell to a particular cluster is dynamically corrected with each iteration of the K-means clustering algorithm such that a given cell may visit multiple clusters over successive iterations until an optimal affiliation is reached (see Materials and Methods). While this self-correcting aspect of the K-means algorithm potentially yields better discrimination between interneuron classes, it does require that the number of clusters be predetermined. Based on the clusters evidenced by Ward's method, we first ran the K-means algorithm with K = 6 clusters. In comparing the clusters obtained with the two methods when K = 6, we found that 90% of the cells (128 of 142) grouped together by Ward's clustering were similarly grouped when passed through the K-means algorithm (Fig. 9B), resulting in a similarity index of 0.8 as assessed by the adjusted Rand index (Rand, 1971) (see Materials and Methods). Importantly, this similarity index represented a peak as the same measure decreased when the dataset was evaluated with K = 5 or 7 clusters, validating the choice of 6 clusters. As for Ward's clustering groups, two of the K-means determined clusters contained only MGE-derived interneurons, while three of the clusters comprised only CGE-derived interneurons, further establishing the discriminative power of embryonic origin in parsing interneuron subtypes.
Figure 9.

Unsupervised cluster analyses of hippocampal GABAergic interneurons based on developmental, electrophysiological, and molecular properties. A, Ward's clustering applied to the sample of 142 recorded MGE- and CGE-derived interneurons. In this dendrogram, the x-axis represents individual cells, and the y-axis represents the average euclidean within-cluster linkage distance. B, Comparison of Ward and K-means clustering algorithms. The clustering generated by the K-means algorithm is mostly consistent with the Ward clustering when considering six clusters as revealed by this matching table describing the intersectional relations between K-means and Ward clusters. The numbers at the bottoms and ends of columns and rows, respectively, display the numbers of cells within the corresponding cluster. Entries of the table indicate how many cells of a K-means cluster are contained within a given Ward cluster. C, Histogram summarizing the frequency of occurrence of each of the 16 transcripts probed by scPCR within each cluster obtained with the K-means clustering (K = 6). See D for cluster color code. D, Silhouette plot resulting from the K-means clustering with K = 6 clusters. Within each cluster along the horizontal axis, cells were ranked in decreasing order of their silhouette values. The vertical axis represents the silhouette values S(i) for each individual data point (see Materials and Methods).
The distribution of mRNAs detected in and electrophysiological features of the six clusters determined by K-means clustering are illustrated in Figure 9C and Table 3, respectively. Members of cluster 1 arise from the MGE, frequently express PV and SOM transcripts, and have the fastest membrane time constants and firing frequencies compared with cells of other clusters. These features are consistent with the MGE-derived putative PV+ fast-spiking basket, bistratified, and axo-axonic cells shown in Figure 7A–D, all of which were grouped within cluster 1. SOM transcript was detected in all cluster 2 cells, which exhibited slower membrane time constants and firing properties compared with all other MGE-derived cells in clusters 1 and 3. Cluster 2 cells, exemplified by the cells depicted in Figure 7E–H, also responded with more prominent membrane sag upon membrane hyperpolarization compared with other MGE-derived cells. Cluster 3 was the only group to contain cells from both MGE and CGE. Regardless of origin, the cells were characterized by NPY transcript expression, and a late-spiking phenotype with just above threshold current injections as illustrated by the NGF and Ivy cells depicted in Figures 7I–K and 8, F and G, all of which were grouped in cluster 3. The inability of cluster analyses to dissociate MGE- and CGE-derived NGF and Ivy cells despite providing cell lineage as a parameter is consistent with the strongly overlapping properties of these cells (Tricoire et al., 2010). CGE-derived cells of clusters 4–6 all exhibited significantly greater spike adaptation than cells of clusters 1–3. Cells of clusters 4 and 5 had similar electophysiological signatures with high input resistance and slow membrane time constants, with cells of cluster 5 more likely to express CR transcript. Anatomical inspection of cells grouped into cluster 4 (Fig. 8D,E) typically revealed dendrite-targeting cells that resemble SCA/ACA interneurons. In contrast, cluster 5 cells often had little local axon (Fig. 8K) suggestive of GABAergic projection cells or interneuron-targeting interneurons (Acsády et al., 1996; Gulyás et al., 1996). Cluster 6 cells had the highest incidence of CCK transcript typically in combination with VGluT3 and VIP, suggestive of putative CCK basket cells (Somogyi et al., 2004; Klausberger et al., 2005). Indeed, anatomically, cells belonging to cluster 6 (Fig. 8A,B) typically exhibited perisomatic targeting local axon as expected for CCK+ basket cells. In addition, MFA cells (Fig. 8C) were grouped into cluster 6.
Table 3.
Electrophysiological properties of the different identified interneuron clusters
| Cluster 1 (n = 15) | Cluster 2 (n = 23) | Cluster 3 (n = 34) | Cluster 4 (n = 33) | Cluster 5 (n = 19) | Cluster 6 (n = 18) | Comparison | |
|---|---|---|---|---|---|---|---|
| Resting potential (mV) | −57 ± 5 | −64 ± 7 | −70 ± 10 | −57 ± 10 | −59 ± 10 | −54 ± 6 | 3<<1,2,4,5,6 |
| Input resistance (MΩ) | 116 ± 63 | 216 ± 124 | 302 ± 139 | 431 ± 193 | 401 ± 212 | 219 ± 98 | 1<<2,3,4,5,6, |
| Time constant (ms) | 13 ± 8 | 46 ± 18 | 25 ± 8 | 44 ± 15 | 38 ± 13 | 22 ± 9 | 1<<3,6<<<2,4,5 |
| Sag index | 0.84 ± 0.06 | 0.79 ± 0.09 | 0.88 ± 0.06 | 0.80 ± 0.10 | 0.80 ± 0.07 | 0.71 ± 0.15 | 1,2,4,5,6<3 |
| Frequency at 2× threshold (Hz) | 70 ± 26 | 19 ± 9 | 27 ± 10 | 17 ± 7 | 18 ± 6 | 27 ± 13 | 2,4,5<<3,6<<<1 |
| Adaptation ratio at 2× threshold | 0.88 ± 0.13 | 0.64 ± 0.22 | 0.80 ± 0.12 | 0.56 ± 0.17 | 0.44 ± 0.17 | 0.46 ± 0.17 | 4,5,6<2<<<3<1 |
| First spike threshold (mV) | −32 ± 4 | −38 ± 3 | −34 ± 4 | −35 ± 3 | −36 ± 3 | −38 ± 4 | 2,4,5,6<3,1 |
| Second spike threshold (mV) | −32 ± 4 | −37 ± 3 | −34 ± 4 | −35 ± 3 | −35 ± 4 | −37 ± 4 | 1,2,3,4,5,6 |
| First spike amplitude (mV) | 47 ± 7 | 62 ± 8 | 52 ± 9 | 62 ± 6 | 48 ± 10 | 59 ± 8 | 1,3,5<2,4,6 |
| Second spike amplitude (mV) | 48 ± 8 | 61 ± 7 | 52 ± 9 | 61 ± 6 | 48 ± 10 | 60 ± 7 | 1,5<3<<2,4,6 |
| First spike half-width (ms) | 0.54 ± 0.11 | 0.74 ± 0.11 | 1.06 ± 0.20 | 0.81 ± 0.09 | 1.04 ± 0.15 | 0.72 ± 0.10 | 1<<<2,6<<4<<<3,5 |
| Second Spike half-width (ms) | 0.54 ± 0.11 | 0.77 ± 0.12 | 1.08 ± 0.21 | 0.86 ± 0.10 | 1.12 ± 0.14 | 0.77 ± 0.10 | 1<<<2,6<<4<<<3,5 |
| First time to repolarize (ms) | 3.1 ± 1.2 | 4.3 ± 1.6 | 9.6 ± 4.1 | 10.8 ± 7.8 | 20.4 ± 12.7 | 11.5 ± 6.8 | 1<2<<<3,4,6< 5 |
| Second time to repolarize (ms) | 3.1 ± 1.1 | 4.7 ± 1.5 | 9.9 ± 3.7 | 13.1 ± 7.7 | 23.2 ± 10.1 | 16.3 ± 10.0 | 1<<2<<<3,4,6<<5 |
| First maximal decay slope (mV/ms) | −112 ± 24 | −96 ± 17 | −55 ± 13 | −79 ± 16 | −50 ± 12 | −83 ± 14 | 1<2<4,6<<<3,5 |
| Second maximal decay slope (mV/ms) | −113 ± 26 | −91 ± 18 | −55 ± 13 | −74 ± 15 | −46 ± 10 | −78 ± 14 | 1<<2<<4,6<<<3<<5 |
| First AHP amplitude (mV) | 25 ± 3 | 21 ± 3 | 20 ± 3 | 19 ± 3 | 13 ± 3 | 14 ± 3 | 5,6<<<4<<2,3<<1 |
| Second AHP amplitude (mV) | 25 ± 4 | 22 ± 3 | 21 ± 4 | 20 ± 4 | 15 ± 4 | 15 ± 3 | 5,6<<<2,3,4<<1 |
| First AHP half-width (ms) | 29 ± 16 | 55 ± 36 | 72 ± 31 | 124 ± 76 | 85 ± 41 | 63 ± 31 | 1<2,3,4,5,6 |
| Second AHP half-width (ms) | 27 ± 15 | 76 ± 47 | 69 ± 33 | 129 ± 50 | 116 ± 63 | 82 ± 32 | 1<<<2,3,6<4,5 |
n, Number of cells.
< indicates significantly smaller with p ≤ 0.05.
<< indicates significantly smaller with p ≤ 0.01.
<<< indicates significantly smaller with p ≤ 0.001.
To further evaluate the significance of the groupings obtained from the unsupervised cluster analyses and examine which measured parameters most heavily influenced cluster identification, we examined the effect of randomization on the cluster analysis. Importantly, randomization was performed in such a way that disrupted the structural correlations between the different measurements describing a given cell without changing the overall mean or SD of each parameter across the dataset. For example, the expression of a given transcript was randomized across all cells without changing the total number of cells that the transcript was detected in. To quantify the effect of randomization, we used silhouette analysis to describe the quality of the clusters obtained with the K-means algorithm (K = 6) before and after randomization (see Materials and Methods) (Rousseeuw, 1987; Karagiannis et al., 2009). For each cell, the silhouette value (S, between −1 and +1) gives a quantitative estimation of how well a cell is sorted in its cluster with higher S indicating stronger affiliation with its cluster, negative S suggesting a potential misclassification, and S around 0 indicating the cell lies equally far away from more than one cluster. For the original nonrandomized dataset, almost all cells exhibit positive S values within their assigned cluster (Fig. 9D) leading to a global S value (S′) describing the entire dataset of 0.14. The significant reduction in S′ to 0.046 following complete randomization of all parameters reflects a 67% decrease in the overall quality of the clusterings. To determine which of the measurements we obtained for each recording exhibited the greatest influence on the quality of the clusterings obtained using the K-means algorithm, we investigated the effect of randomizing each parameter in isolation and in specific combinations on S′ (Fig. 10A–D). Among the commonly used interneuron marker transcripts examined, SOM and nNOS randomization yielded the largest decrease in S′, while for electrophysiological properties randomizing time constants and spike kinetic/frequency parameters produced the strongest decrease in S′ (Fig. 10A,B). As expected given the lack of overlap between CGE and MGE cells within five of the six clusters, cell origin also had high discriminative power, particularly when randomized in combination with the transcription factors and 5-HT3 that essentially serve as proxies for cell origin (Fig. 10A,C). In contrast, parameters that were very common to all cells (e.g., GAD65/67 expression) or rarely detected at all (e.g., Enk) had little effect on S′, revealing poor discriminative power. In total, the silhouette analyses of clustering quality further validate the original clusters obtained from our dataset as the findings make it unlikely that the clusters resulted from accidental random correlations between the various parameters measured to describe MGE- and CGE-derived interneurons.
Figure 10.

Influence of developmental, molecular, and electrophysiological properties on the quality of the K-means clustering. A, B, Histograms illustrating the changes in global silhouette value (S′) for the entire dataset following randomization of individual molecular (A) and electrophysiological (B) parameters. The dashed lines indicate S′ for the intact dataset without any randomization. C, Histogram illustrating the effect of randomizing certain combinations of parameters on S′. Scrambled combinations included origin with transcription factors (origin, Lhx6, CoupTFII, Npas1 and 3) with or without 5-HT3; the five most influential interneuron markers that yielded the largest silhouette decrease when individually randomized (PV, SOM, NPY, CCK, nNOS); all frequently used interneuron markers (GADs, CR, PV, SOM, NPY, CCK, VIP, nNOS); all mRNAs probed; and all electrophysiological properties examined. Error bars of the scrambled silhouette width are evaluated by SD over 10 independent randomizations. D, Progressive change in S′ observed upon cumulatively increasing the number of scrambled parameters. On the “random” curve (triangles), scrambled parameters were randomly picked among the list of 37 parameters used in the clustering. On the “sorted” curve (squares), scrambled parameters were chosen in an orderly manner, first randomizing the parameter that least altered S′ (VIP) and continuing with parameters exhibiting increasing discriminative power (last one: SOM).
Quantitative scPCR comparison of MGE- and CGE-derived basket cells
Upon comparing the parsing of interneuron populations based on immunostaining (Figs. 3–6) versus transcript detection (Fig. 9C) for frequently used interneuron markers, obvious incongruities emerge. For example, while CCK immunostaining was restricted to CGE-derived interneurons, CCK mRNA transcript was readily observed in both MGE- and CGE-derived cells. Such incongruity is reflected in the poor discriminative power of transcripts for markers that have proved highly specific for immunolabeling nonoverlapping interneuron populations like PV and CCK (Fig. 10A). While we cannot entirely rule out the possibility that scPCR molecular profiles are confounded by signals from contaminant tissue, our control recordings (see Materials and Methods) indicate that such false-positive signals are negligible in our dataset. Alternatively, the discrepant molecular profiles could reflect differences in the threshold limits of immunodetection versus transcript detection by scPCR. Indeed, it has been shown that the detection threshold of our scPCR approach is ∼25 mRNA molecules, which is in the range of low abundance mRNA species perhaps leading to very low levels of protein that fall below immunodetection limits (Tsuzuki et al., 2001). If this is true, then MGE- and CGE-derived basket cells should contain different amounts of PV and CCK transcripts. Therefore, in a final series of experiments, we performed quantitative scPCR to compare the PV and CCK mRNA content of electrophysiologically and morphologically identified MGE-derived PV+ FS-BCs with CGE-derived CCK+ basket (non-FS-BCs) and SCA cells (Fig. 11A–E). As controls, we also examined CA1 pyramidal cells and additionally probed GAD65 and VGluT1 mRNA levels. In total, four FS-BCs recorded in Nkx2-1Cre:RCE mice were compared with five SCA/non-FS-BCs recorded in GAD65-GFP mice as well as five pyramidal cells from both lines. For all steps, cells were processed in pairs (FS-BC vs SCA/non-FS-BC, pyramidal vs FS-BC, and pyramidal vs non-FS-BC), and normalization was performed using actin mRNA in each harvest. As expected, CCK transcript was detected in all CGE-derived non-FS-BC and SCA cells, while PV transcript was successfully amplified in all four tested MGE-derived FS-BCs. As in our previous dataset, we regularly detected CCK in FS-BCs (four of four cells); however, the level of CCK mRNA was markedly less than that detected in both non-FS-BCs run in parallel (Fig. 11A–E). Similarly, the level of CCK transcript detected in FS-BCs was typically less than that found in pyramidal cells, which exhibited levels comparable with CGE-derived non-FS-BCs/SCAs (Fig. 11A,D, middle and right panels) consistent with CCK immunodetection in many pyramids (Morino et al., 1994). PV transcript was found in only one of five non-FS-BC/SCAs and one of five pyramidal cells at levels considerably lower than that detected in FS-BCs relative to actin (Fig. 11D, right panel). Importantly, GAD65 mRNA was not detected in any of the pyramids but was found in all interneurons at roughly the same levels, confirming that the differences observed for other transcripts (CCK and PV) are specific to those mRNA species (Fig. 11D,E). In contrast VGluT1 mRNA was found in all pyramids and most interneurons (seven of nine) (Gallopin et al., 2006; Andjelic et al., 2009), but with an obvious enrichment in the pyramidal cell cohort, further confirming the validity of our quantitative approach. Whether this interneuron VGluT1 signal revealed with the more sensitive PCR assay reflects low-level contamination or true expression remains debatable. However, the enrichment of VGluT1 relative to CCK in pyramidal cell harvests further argues against pyramidal cell contamination as the source of CCK message in FS-BC harvests as CCK was enriched relative to VGluT1 in FS-BC harvests (Fig. 11D,E). Together, these results suggest that discrepancies between the molecular signatures generated by scPCR versus immunostaining for characterizing interneuron diversity reflect differences in the limits of threshold detection of the two methods. Thus, caution is warranted when directly comparing and attempting to extrapolate interneuron identities based on the two strategies, particularly for standard “digital” scPCR.
Figure 11.
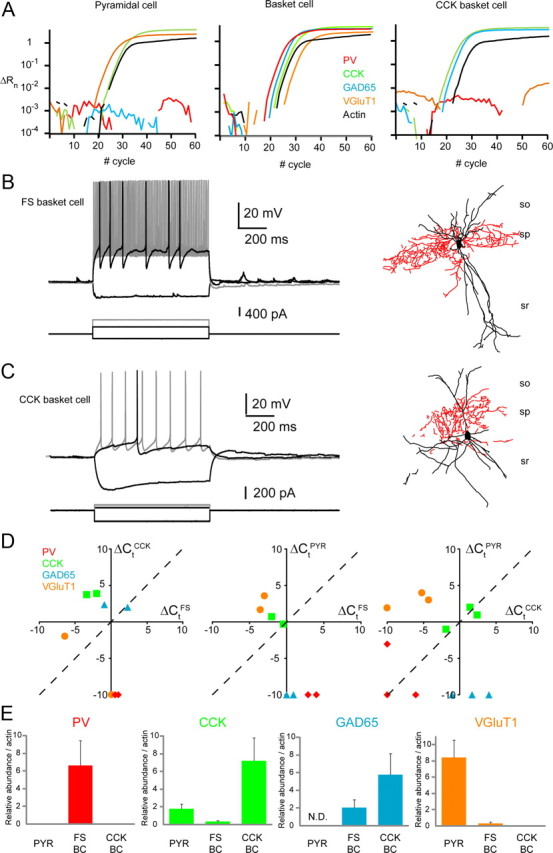
Quantitative scPCR comparisons between PV+ fast-spiking basket cells and CCK+ SCA/non-fast-spiking basket cells. A, Amplification plots for PV (red), CCK (green), GAD65 (blue), VGluT1 (yellow), and actin (black) for harvests from a representative pyramidal cell (left), fast-spiking basket cell (middle), and non-fast-spiking basket cell (right). Relative fluorescence intensities (ΔRn) were plotted against PCR cycle numbers on a logarithmic scale. B, C, Electrophysiological (left) and morphological (right) profiles of the fast-spiking (B) and non-fast-spiking (C) basket cells that were recorded for the quantitative scPCR analysis in A. D, Pairwise comparisons of the relative abundance of PV, CCK, GAD65, and VGluT1 in individual pyramidal (PYR), fast-spiking basket (FS), and non-fast-spiking basket/SCA (CCK) neurons (n = 5, 4, and 5, respectively). Cells were tested in pairs and plotted versus each other on the same graph. Data were normalized to actin mRNA levels by plotting ΔCt(probed transcript) = Ct(actin) − Ct(probed transcript). Each point represents the ΔCt for the indicated transcript of a cell pair processed in parallel. The dashed line represents same ΔCt value for the two cell types tested such that data points above the dashed line indicate higher abundance in the cell whose ΔCt is plotted on the y-axis, while points below the line indicate higher expression within the cell whose ΔCt is plotted along the x-axis. At left, two CCK cells (y-axis) are plotted against two FS cells (x-axis); the middle panel shows the data for two PYR (y-axis) FS (x-axis) pairs processed in parallel; the right panel illustrates findings for three PYR (y-axis)/CCK (x-axis) cell pairs. When the transcript was not detected, ΔCt value was set arbitrarily at −10. E, Histograms of mean target mRNA abundance relative to actin mRNA calculated from the ΔCt values plotted in D (see Materials and Methods) for PYR (n = 5), FS-BC (n = 4), and CCK-BC (n = 5) harvests. Error bars indicate SEM.
Discussion
Coordination of glutamatergic principal cell activity within cortical networks relies upon a remarkable diversity of inhibitory interneurons that is largely predetermined during embryogenesis by genetic restriction of neuronal potential. Here, we investigated the influence of embryonic origin on hippocampal interneuron diversity using longitudinal developmental analyses of the precursors of different hippocampal interneuron subpopulations. In general, based on immunohistochemistry, the MGE gives rise to PV+, SOM+, and nNOS+ hippocampal interneurons. Indeed, our combined anatomical, electrophysiological, and molecular characterization indicated three major subpopulations of MGE-derived interneurons generally conforming to these subgroups: (1) PV+ fast-spiking interneurons including basket, bistratified, and axo-axonic cells; (2) a morphologically diverse population of adapting SOM+ interneurons typified by O-LM cells; and (3) an nNOS+/NPY+ subset of late-spiking interneurons comprised of NGF/Ivy cells. In contrast, CGE-derived hippocampal interneurons were immunohistochemically defined by CCK, CR, VIP, and reelin expression. Interestingly, single cell profiling also indicated four major cohorts of CGE-derived interneurons: (1) CCK+ perisomatic targeting basket cells; (2) CCK+ dendrite-targeting interneurons typified by SCA cells; (3) a late-spiking NGF cell cohort virtually indistinguishable from those with MGE lineage; and (4) an anatomically heterogenous group of high input resistance cells with limited local recovered axon likely representing M2R+, VIP+, or CR+ projection cells or interneuron-targeting interneurons. These findings, summarized in Figure 12, reveal the developmental origins of most hippocampal interneuron subtypes.
Figure 12.

Spatial and temporal origin of main hippocampal CA1 interneuron subtypes. Schematic diagram summarizing the findings reported in the present study. The scheme is completed based on previous reports showing overlapping expression of PV/SOM and VIP/CR/nNOS (Jinno and Kosaka, 2002; Baude et al., 2007; Tricoire et al., 2010).
The validity of our findings entirely depends upon the fidelity of the mouse lines used for accurately reporting MGE- and CGE-derived interneurons. Specificity of the Nkx2-1Cre:RCE line for MGE is consistent with ubiquitous expression of the Nkx2-1 homeobox gene throughout the MGE with exclusion from LGE/CGE progenitors (Kimura et al., 1996; Sussel et al., 1999; Butt et al., 2005). Indeed, Nkx2-1 may be a molecular switch favoring MGE over CGE fate (Butt et al., 2008), and driver lines based on Nkx2-1, or its downstream effector Lhx6, have been used to characterize MGE-derived neocortical interneurons (Fogarty et al., 2007; Xu et al., 2008). Moreover, loss-of-function studies indicate a requirement for Nkx2-1 and Lhx6 for proper specification and migration of MGE-derived interneurons (Pleasure et al., 2000; Liodis et al., 2007; Butt et al., 2008; Du et al., 2008; Zhao et al., 2008; Tricoire et al., 2010). Nkx2-1 is also expressed in preoptic area (POA) progenitors, which contribute a minor population of cortical interneurons (Gelman et al., 2009). However, POA-derived interneurons fail to immunolabel for PV, SOM, or nNOS (Gelman et al., 2009), indicating that any potential POA contribution to Nkx2-1Cre:RCE GFP+ cells is minor as >90% of the GFP+ cells in this line are accounted for by these markers. Moreover, the regular detection of Lhx6 in Nkx2-1Cre:RCE GFP+ cells is inconsistent with a significant contribution of POA-derived interneurons to this population (Gelman et al., 2009). Specificity of the Olig2CreER:ZEG line for labeling MGE-derived cells has been extensively characterized previously (Miyoshi et al., 2007) and is further confirmed by the shared immunolabeling profiles of GFP+ cells in Olig2CreER:ZEG and Nkx2-1Cre: RCE mice. Thus, we are confident that Nkx2-1Cre:RCE and Olig2CreER:ZEG lines accurately report MGE-derived hippocampal interneurons. However, this is not meant to imply that the lines faithfully report the entire MGE-derived interneuron population. Estimates indicate that Nkx2-1 driver lines fail to report ∼20% of MGE-derived neocortical interneurons (Fogarty et al., 2007; Xu et al., 2008) primarily arising from progenitors in the most dorsal MGE, which typically yield SOM+ interneurons (Fogarty et al., 2007; Wonders et al., 2008; Sousa et al., 2009). Indeed, among the major populations arising from MGE, the SOM+ population exhibited the least GFP coexpression in the Nkx2-1Cre:RCE line. Whether this unreported population of cells represents distinct interneuron subtypes requires further investigation.
Despite ubiquitous expression of GAD65 among interneurons, the GAD65-GFP line reportedly preferentially labels CGE-derived neocortical interneurons (López-Bendito et al., 2004). Our hippocampal immunohistochemical results in GAD65-GFP mice completely paralleled those obtained in Mash1CreER:RCE mice, which have been characterized as CGE-specific reporters (Miyoshi et al., 2010). Moreover, results obtained in both lines yielded entirely complementary findings to those from our MGE reporters. Indeed, the common MGE-derived markers PV, SOM, and nNOS were essentially absent from GFP+ cells probed by immunocytochemistry in GAD65-GFP and Mash1CreER:RCE mice. Moreover, we never detected mRNA for the MGE marker Lhx6 in GFP+ cells of GAD65-GFP mice in contrast with ubiquitous expression of this transcript in Nkx2-1Cre:RCE GFP+ cells. Instead, the majority of GFP+ cells in GAD65-GFP mice contained 5-HT3 mRNA providing further evidence of CGE specificity as 5-HT3 is an early and protracted marker of CGE-derived interneurons (Lee et al., 2010; Vucurovic et al., 2010). Indeed, 5-HT3-GFP reporter mice exhibit colocalization of GFP with CCK, CR, VIP, and reelin in neocortical interneurons (Lee et al., 2010; Vucurovic et al., 2010), paralleling our findings in hippocampal neurons of GAD65-GFP mice (López-Bendito et al., 2004; Wierenga et al., 2010). Considered together, the findings support use of GAD65-GFP and Mash1CreER:RCE lines to investigate the contribution of CGE progenitors to hippocampal interneuron diversity. However, once again, this assertion of specificity is not meant to imply that these transgenic lines capture the entire CGE-derived interneuron population. If hippocampal CGE-derived interneurons account for ∼40% of the entire hippocampal interneuron population, as suggested for neocortex (Lee et al., 2010; Miyoshi et al., 2010), calculations from our density counts reveal that GAD65-GFP mice report only 50% of all CGE-derived interneurons. Assuming the Nkx2-1Cre:RCE line captures 80% of all MGE-derived interneurons as outlined above and that overall the MGE contributes 60% of cortical interneurons, our cell density counts at P30 indicate that total interneuron density should be ∼7500 cells/mm3, comparable with average interneuron density across rat neocortex (Beaulieu, 1993). Thus, the 1500 cells/mm3 observed at P30 in the GAD65-GFP mouse represents only one-half of the expected CGE contribution of 3000 cells/mm3. This is consistent with our finding that GFP+ cells in GAD65-GFP mice only accounted for ∼50% of VIP+ and CCK+ interneurons that appear to be entirely CGE derived. Whether the GAD65-GFP line reports a fully representative cross section of CGE-derived interneuron diversity or instead labels specific subpopulations of CGE-derived interneurons remains unknown.
In addition to 5-HT3, mRNA for Npas1 and CoupTFII strongly segregated to CGE-derived interneurons. For CoupTFII, this preference for CGE- over MGE-derived cells was also detected immunocytochemically and is consistent with CoupTFII enrichment within the CGE (Kanatani et al., 2008). However, CoupTFII was not as exclusive as 5-HT3 being detected both at message and protein levels in a small population of Nkx2-1Cre:RCE GFP+ cells. This CoupTFII expression in a minor MGE-derived interneuron cohort likely reflects interneurons generated from more dorsal MGE as these progenitors also express CoupTFII (Kanatani et al., 2008). Indeed, among MGE-derived cells, CoupTFII transcript most frequently occurred in cells defined by SOM mRNA expression (cluster 2) (Fig. 9) likely representing SOM+ interneurons arising from more dorsal MGE progenitors (Flames et al., 2007; Fogarty et al., 2007; Wonders et al., 2008; Sousa et al., 2009). Npas1 is expressed in migrating interneuron precursors (Cobos et al., 2006) and in mature hippocampal interneurons, partially colocalizing with CR and reelin (Erbel-Sieler et al., 2004). These observation are consistent with our frequent detection of Npas1 mRNA in CGE-derived interneurons and the fact that hippocampal Npas1 expression is unaffected in Lhx6 mutants (Zhao et al., 2008).
Overall, our findings reveal that hippocampal and neocortical interneurons have mostly similar origins for homologous interneuron subtypes. In both cases, MGE progenitors give rise to interneurons characterized by PV and SOM expression, while CGE-derived interneurons are defined by CCK, VIP, CR, and reelin expression. Our extensive profiling allowed us to characterize the origins of hippocampal interneuron subtypes not well described in the neocortical literature such as various CCK+ interneurons. CCK-immunopositive hippocampal cells only arose from the CGE, consistent with recent descriptions of CGE-derived CCK interneurons (López-Bendito et al., 2004; Morozov et al., 2009; Lee et al., 2010; Miyoshi et al., 2010; Wierenga et al., 2010). Indeed non-fast-spiking basket, MFA, and SCA subtypes of interneurons, all known CCK+ cells, were found among GFP+ cells of our CGE reporter. Similarly, we determined the origins of several other hippocampal interneurons for which no obvious neocortical homolog is yet reported such as M2R-immunoreactive projection cells (e.g., trilaminar, CGE) and bistratified interneurons (MGE). The most obvious difference between neocortical and hippocampal interneurons encountered relates to the origins of late-spiking NGF cells. Consistent with our prior investigation (Tricoire et al., 2010), we observed hippocampal NGF cells to arise from both MGE and CGE progenitors, while their neocortical counterparts display only CGE lineage (Lee et al., 2010; Miyoshi et al., 2010). Previously, we found that MGE- and CGE-derived NGF cells parse by nNOS immunoreactivity, which identifies only MGE-derived NGFs (Tricoire et al., 2010). Here, we demonstrate that MGE-derived NGF cells express Lhx6 but not 5-HT3 mRNA, whereas CGE-derived NGFs exhibit the opposite molecular profile, further confirming dual origins for these cells. Aside from origin, the properties of these two NGF cell cohorts are so similar that our clustering algorithms failed to dissociate them even when factoring their distinct origins. Indeed, this was the only population for which the cluster analyses failed to segregate MGE- and CGE-derived interneurons. It will be interesting to determine whether MGE- and CGE-derived NGF cells subserve distinct network functions within the hippocampus.
In conclusion, by comparing and contrasting MGE- and CGE-derived interneurons in parallel, we have established a blueprint of the developmental origins of diverse hippocampal interneurons similar to that which has emerged for the neocortex (for review, see Wonders and Anderson, 2006; Batista-Brito and Fishell, 2009; Gelman and Marin, 2010). Importantly, we determined the lineage of several classes of interneurons uniquely described in the hippocampus. Our findings fill an important gap in the understanding of hippocampal interneuron diversity and are directly relevant to several neurological disorders precipitated by disruptions of excitation–inhibition balance due to loss of specific interneuron cohorts. Indeed, a thorough appreciation of the spatiotemporal origins of distinct interneuron subtypes is critical to advance stem cell-based therapies for disorders associated with dysfunction of specific interneuron subsets (Baraban et al., 2009; Maroof et al., 2010; Waldau et al., 2010).
Footnotes
This work was supported by a National Institute of Child Health and Human Development (NICHD) intramural award (C.J.M.). L.T. is a NIH Visiting Fellow and a NIH/CNRS European Career Transition Award Fellow. Daniel Abebe provided expert technical assistance. Microscopy imaging was performed at the Microscopy and Imaging Core (NICHD–NIH) with the assistance of Dr. Vincent Schram and at the imaging facility of the IFR83 (Paris, France) with the assistance of Susanne Bolt and Richard Schwartzmann. We thank Dr. Gordin V. Ohning for supplying us with the CCK antibody, Dr. Gabor Szabo for providing the GAD65-GFP mouse line, Dr. Stuart Anderson for providing the Nkx2-1Cre driver line, and Dr. Gord Fishell for providing the Olig2CreER and Mash1CreER driver lines as well as the RCE reporter line.
References
- Acsády L, Arabadzisz D, Freund TF. Correlated morphological and neurochemical features identify different subsets of vasoactive intestinal polypeptide-immunoreactive interneurons in rat hippocampus. Neuroscience. 1996;73:299–315. doi: 10.1016/0306-4522(95)00610-9. [DOI] [PubMed] [Google Scholar]
- Alifragis P, Liapi A, Parnavelas JG. Lhx6 regulates the migration of cortical interneurons from the ventral telencephalon but does not specify their GABA phenotype. J Neurosci. 2004;24:5643–5648. doi: 10.1523/JNEUROSCI.1245-04.2004. [DOI] [PMC free article] [PubMed] [Google Scholar]
- Andjelic S, Gallopin T, Cauli B, Hill EL, Roux L, Badr S, Hu E, Tamás G, Lambolez B. Glutamatergic nonpyramidal neurons from neocortical layer VI and their comparison with pyramidal and spiny stellate neurons. J Neurophysiol. 2009;101:641–654. doi: 10.1152/jn.91094.2008. [DOI] [PMC free article] [PubMed] [Google Scholar]
- Banke TG, McBain CJ. GABAergic input onto CA3 hippocampal interneurons remains shunting throughout development. J Neurosci. 2006;26:11720–11725. doi: 10.1523/JNEUROSCI.2887-06.2006. [DOI] [PMC free article] [PubMed] [Google Scholar]
- Baraban SC, Southwell DG, Estrada RC, Jones DL, Sebe JY, Alfaro-Cervello C, García-Verdugo JM, Rubenstein JL, Alvarez-Buylla A. Reduction of seizures by transplantation of cortical GABAergic interneuron precursors into Kv1.1 mutant mice. Proc Natl Acad Sci U S A. 2009;106:15472–15477. doi: 10.1073/pnas.0900141106. [DOI] [PMC free article] [PubMed] [Google Scholar]
- Batista-Brito R, Fishell G. The developmental integration of cortical interneurons into a functional network. Curr Top Dev Biol. 2009;87:81–118. doi: 10.1016/S0070-2153(09)01203-4. [DOI] [PMC free article] [PubMed] [Google Scholar]
- Baude A, Bleasdale C, Dalezios Y, Somogyi P, Klausberger T. Immunoreactivity for the GABAA receptor alpha1 subunit, somatostatin and Connexin36 distinguishes axoaxonic, basket, and bistratified interneurons of the rat hippocampus. Cereb Cortex. 2007;17:2094–2107. doi: 10.1093/cercor/bhl117. [DOI] [PubMed] [Google Scholar]
- Beaulieu C. Numerical data on neocortical neurons in adult rat, with special reference to the GABA population. Brain Res. 1993;609:284–292. doi: 10.1016/0006-8993(93)90884-p. [DOI] [PubMed] [Google Scholar]
- Bonifazi P, Goldin M, Picardo MA, Jorquera I, Cattani A, Bianconi G, Represa A, Ben-Ari Y, Cossart R. GABAergic hub neurons orchestrate synchrony in developing hippocampal networks. Science. 2009;326:1419–1424. doi: 10.1126/science.1175509. [DOI] [PubMed] [Google Scholar]
- Buhl EH, Halasy K, Somogyi P. Diverse sources of hippocampal unitary inhibitory postsynaptic potentials and the number of synaptic release sites. Nature. 1994a;368:823–828. doi: 10.1038/368823a0. [DOI] [PubMed] [Google Scholar]
- Buhl EH, Han ZS, Lörinczi Z, Stezhka VV, Karnup SV, Somogyi P. Physiological properties of anatomically identified axo-axonic cells in the rat hippocampus. J Neurophysiol. 1994b;71:1289–1307. doi: 10.1152/jn.1994.71.4.1289. [DOI] [PubMed] [Google Scholar]
- Butt SJ, Fuccillo M, Nery S, Noctor S, Kriegstein A, Corbin JG, Fishell G. The temporal and spatial origins of cortical interneurons predict their physiological subtype. Neuron. 2005;48:591–604. doi: 10.1016/j.neuron.2005.09.034. [DOI] [PubMed] [Google Scholar]
- Butt SJ, Sousa VH, Fuccillo MV, Hjerling-Leffler J, Miyoshi G, Kimura S, Fishell G. The requirement of Nkx2-1 in the temporal specification of cortical interneuron subtypes. Neuron. 2008;59:722–732. doi: 10.1016/j.neuron.2008.07.031. [DOI] [PMC free article] [PubMed] [Google Scholar]
- Cauli B, Audinat E, Lambolez B, Angulo MC, Ropert N, Tsuzuki K, Hestrin S, Rossier J. Molecular and physiological diversity of cortical nonpyramidal cells. J Neurosci. 1997;17:3894–3906. doi: 10.1523/JNEUROSCI.17-10-03894.1997. [DOI] [PMC free article] [PubMed] [Google Scholar]
- Cea-del Rio CA, Lawrence JJ, Tricoire L, Erdelyi F, Szabo G, McBain CJ. M3 muscarinic acetylcholine receptor expression confers differential cholinergic modulation to neurochemically distinct hippocampal basket cell subtypes. J Neurosci. 2010;30:6011–6024. doi: 10.1523/JNEUROSCI.5040-09.2010. [DOI] [PMC free article] [PubMed] [Google Scholar]
- Cea-del Rio CA, Lawrence JJ, Erdelyi F, Szabo G, McBain CJ. Cholinergic modulation amplifies the intrinsic oscillatory properties of CA1 hippocampal cholecystokinin positive interneurons. J Physiol. 2011;589:609–627. doi: 10.1113/jphysiol.2010.199422. [DOI] [PMC free article] [PubMed] [Google Scholar]
- Chédotal A, Rijli FM. Transcriptional regulation of tangential neuronal migration in the developing forebrain. Curr Opin Neurobiol. 2009;19:139–145. doi: 10.1016/j.conb.2009.04.005. [DOI] [PubMed] [Google Scholar]
- Cobos I, Calcagnotto ME, Vilaythong AJ, Thwin MT, Noebels JL, Baraban SC, Rubenstein JL. Mice lacking Dlx1 show subtype-specific loss of interneurons, reduced inhibition and epilepsy. Nat Neurosci. 2005;8:1059–1068. doi: 10.1038/nn1499. [DOI] [PubMed] [Google Scholar]
- Cobos I, Long JE, Thwin MT, Rubenstein JL. Cellular patterns of transcription factor expression in developing cortical interneurons. Cereb Cortex. 2006;16(Suppl 1):i82–i88. doi: 10.1093/cercor/bhk003. [DOI] [PubMed] [Google Scholar]
- Cope DW, Maccaferri G, Márton LF, Roberts JD, Cobden PM, Somogyi P. Cholecystokinin-immunopositive basket and Schaffer collateral-associated interneurones target different domains of pyramidal cells in the CA1 area of the rat hippocampus. Neuroscience. 2002;109:63–80. doi: 10.1016/s0306-4522(01)00440-7. [DOI] [PubMed] [Google Scholar]
- Dal Bo G, St-Gelais F, Danik M, Williams S, Cotton M, Trudeau LE. Dopamine neurons in culture express VGLUT2 explaining their capacity to release glutamate at synapses in addition to dopamine. J Neurochem. 2004;88:1398–1405. doi: 10.1046/j.1471-4159.2003.02277.x. [DOI] [PubMed] [Google Scholar]
- Daw MI, Tricoire L, Erdelyi F, Szabo G, McBain CJ. Asynchronous transmitter release from cholecystokinin-containing inhibitory interneurons is widespread and target-cell independent. J Neurosci. 2009;29:11112–11122. doi: 10.1523/JNEUROSCI.5760-08.2009. [DOI] [PMC free article] [PubMed] [Google Scholar]
- Daw MI, Pelkey KA, Chittajallu R, McBain CJ. Presynaptic kainate receptor activation preserves asynchronous GABA release despite the reduction in synchronous release from hippocampal cholecystokinin interneurons. J Neurosci. 2010;30:11202–11209. doi: 10.1523/JNEUROSCI.6334-09.2010. [DOI] [PMC free article] [PubMed] [Google Scholar]
- de Bergeyck V, Nakajima K, Lambert de Rouvroit C, Naerhuyzen B, Goffinet AM, Miyata T, Ogawa M, Mikoshiba K. A truncated Reelin protein is produced but not secreted in the “Orleans” reeler mutation (Reln[rl-Orl]) Brain Res Mol Brain Res. 1997;50:85–90. doi: 10.1016/s0169-328x(97)00166-6. [DOI] [PubMed] [Google Scholar]
- de Bergeyck V, Naerhuyzen B, Goffinet AM, Lambert de Rouvroit C. A panel of monoclonal antibodies against reelin, the extracellular matrix protein defective in reeler mutant mice. J Neurosci Methods. 1998;82:17–24. doi: 10.1016/s0165-0270(98)00024-7. [DOI] [PubMed] [Google Scholar]
- Di Cristo G. Development of cortical GABAergic circuits and its implications for neurodevelopmental disorders. Clin Genet. 2007;72:1–8. doi: 10.1111/j.1399-0004.2007.00822.x. [DOI] [PubMed] [Google Scholar]
- Du T, Xu Q, Ocbina PJ, Anderson SA. NKX2.1 specifies cortical interneuron fate by activating Lhx6. Development. 2008;135:1559–1567. doi: 10.1242/dev.015123. [DOI] [PubMed] [Google Scholar]
- Erbel-Sieler C, Dudley C, Zhou Y, Wu X, Estill SJ, Han T, Diaz-Arrastia R, Brunskill EW, Potter SS, McKnight SL. Behavioral and regulatory abnormalities in mice deficient in the NPAS1 and NPAS3 transcription factors. Proc Natl Acad Sci U S A. 2004;101:13648–13653. doi: 10.1073/pnas.0405310101. [DOI] [PMC free article] [PubMed] [Google Scholar]
- Eyre MD, Kerti K, Nusser Z. Molecular diversity of deep short-axon cells of the rat main olfactory bulb. Eur J Neurosci. 2009;29:1397–1407. doi: 10.1111/j.1460-9568.2009.06703.x. [DOI] [PubMed] [Google Scholar]
- Ferraguti F, Klausberger T, Cobden P, Baude A, Roberts JD, Szucs P, Kinoshita A, Shigemoto R, Somogyi P, Dalezios Y. Metabotropic glutamate receptor 8-expressing nerve terminals target subsets of GABAergic neurons in the hippocampus. J Neurosci. 2005;25:10520–10536. doi: 10.1523/JNEUROSCI.2547-05.2005. [DOI] [PMC free article] [PubMed] [Google Scholar]
- Flames N, Pla R, Gelman DM, Rubenstein JL, Puelles L, Marín O. Delineation of multiple subpallial progenitor domains by the combinatorial expression of transcriptional codes. J Neurosci. 2007;27:9682–9695. doi: 10.1523/JNEUROSCI.2750-07.2007. [DOI] [PMC free article] [PubMed] [Google Scholar]
- Fogarty M, Grist M, Gelman D, Marín O, Pachnis V, Kessaris N. Spatial genetic patterning of the embryonic neuroepithelium generates GABAergic interneuron diversity in the adult cortex. J Neurosci. 2007;27:10935–10946. doi: 10.1523/JNEUROSCI.1629-07.2007. [DOI] [PMC free article] [PubMed] [Google Scholar]
- Fonseca M, dél Río JA, Martínez A, Gómez S, Soriano E. Development of calretinin immunoreactivity in the neocortex of the rat. J Comp Neurol. 1995;361:177–192. doi: 10.1002/cne.903610114. [DOI] [PubMed] [Google Scholar]
- Freund TF, Buzsáki G. Interneurons of the hippocampus. Hippocampus. 1996;6:347–470. doi: 10.1002/(SICI)1098-1063(1996)6:4<347::AID-HIPO1>3.0.CO;2-I. [DOI] [PubMed] [Google Scholar]
- Fuentealba P, Begum R, Capogna M, Jinno S, Márton LF, Csicsvari J, Thomson A, Somogyi P, Klausberger T. Ivy cells: a population of nitric-oxide-producing, slow-spiking GABAergic neurons and their involvement in hippocampal network activity. Neuron. 2008;57:917–929. doi: 10.1016/j.neuron.2008.01.034. [DOI] [PMC free article] [PubMed] [Google Scholar]
- Fuentealba P, Klausberger T, Karayannis T, Suen WY, Huck J, Tomioka R, Rockland K, Capogna M, Studer M, Morales M, Somogyi P. Expression of COUP-TFII nuclear receptor in restricted GABAergic neuronal populations in the adult rat hippocampus. J Neurosci. 2010;30:1595–1609. doi: 10.1523/JNEUROSCI.4199-09.2010. [DOI] [PMC free article] [PubMed] [Google Scholar]
- Gallopin T, Geoffroy H, Rossier J, Lambolez B. Cortical sources of CRF, NKB, and CCK and their effects on pyramidal cells in the neocortex. Cereb Cortex. 2006;16:1440–1452. doi: 10.1093/cercor/bhj081. [DOI] [PubMed] [Google Scholar]
- Ganter P, Szücs P, Paulsen O, Somogyi P. Properties of horizontal axo-axonic cells in stratum oriens of the hippocampal CA1 area of rats in vitro. Hippocampus. 2004;14:232–243. doi: 10.1002/hipo.10170. [DOI] [PubMed] [Google Scholar]
- Gelman DM, Marín O. Generation of interneuron diversity in the mouse cerebral cortex. Eur J Neurosci. 2010;31:2136–2141. doi: 10.1111/j.1460-9568.2010.07267.x. [DOI] [PubMed] [Google Scholar]
- Gelman DM, Martini FJ, Nóbrega-Pereira S, Pierani A, Kessaris N, Marín O. The embryonic preoptic area is a novel source of cortical GABAergic interneurons. J Neurosci. 2009;29:9380–9389. doi: 10.1523/JNEUROSCI.0604-09.2009. [DOI] [PMC free article] [PubMed] [Google Scholar]
- Grigoriou M, Tucker AS, Sharpe PT, Pachnis V. Expression and regulation of Lhx6 and Lhx7, a novel subfamily of LIM homeodomain encoding genes, suggests a role in mammalian head development. Development. 1998;125:2063–2074. doi: 10.1242/dev.125.11.2063. [DOI] [PubMed] [Google Scholar]
- Guillemot F, Lo LC, Johnson JE, Auerbach A, Anderson DJ, Joyner AL. Mammalian achaete-scute homolog 1 is required for the early development of olfactory and autonomic neurons. Cell. 1993;75:463–476. doi: 10.1016/0092-8674(93)90381-y. [DOI] [PubMed] [Google Scholar]
- Gulyás AI, Hájos N, Freund TF. Interneurons containing calretinin are specialized to control other interneurons in the rat hippocampus. J Neurosci. 1996;16:3397–3411. doi: 10.1523/JNEUROSCI.16-10-03397.1996. [DOI] [PMC free article] [PubMed] [Google Scholar]
- Hájos N, Mody I. Synaptic communication among hippocampal interneurons: properties of spontaneous IPSCs in morphologically identified cells. J Neurosci. 1997;17:8427–8442. doi: 10.1523/JNEUROSCI.17-21-08427.1997. [DOI] [PMC free article] [PubMed] [Google Scholar]
- Hájos N, Papp EC, Acsády L, Levey AI, Freund TF. Distinct interneuron types express m2 muscarinic receptor immunoreactivity on their dendrites or axon terminals in the hippocampus. Neuroscience. 1998;82:355–376. doi: 10.1016/s0306-4522(97)00300-x. [DOI] [PubMed] [Google Scholar]
- Halasy K, Buhl EH, Lörinczi Z, Tamás G, Somogyi P. Synaptic target selectivity and input of GABAergic basket and bistratified interneurons in the CA1 area of the rat hippocampus. Hippocampus. 1996;6:306–329. doi: 10.1002/(SICI)1098-1063(1996)6:3<306::AID-HIPO8>3.0.CO;2-K. [DOI] [PubMed] [Google Scholar]
- Hartigan JA, Wong MA. Algorithm AS 136: a K-means clustering algorithm. J R Stat Soc Ser C Appl Stat. 1979;28:100–108. [Google Scholar]
- Hensch TK. Critical period plasticity in local cortical circuits. Nat Rev Neurosci. 2005;6:877–888. doi: 10.1038/nrn1787. [DOI] [PubMed] [Google Scholar]
- Hubert L, Arabie P. Comparing partitions. J Classification. 1985;2:193–218. [Google Scholar]
- Jinno S, Kosaka T. Patterns of expression of calcium binding proteins and neuronal nitric oxide synthase in different populations of hippocampal GABAergic neurons in mice. J Comp Neurol. 2002;449:1–25. doi: 10.1002/cne.10251. [DOI] [PubMed] [Google Scholar]
- Jinno S, Klausberger T, Marton LF, Dalezios Y, Roberts JD, Fuentealba P, Bushong EA, Henze D, Buzsáki G, Somogyi P. Neuronal diversity in GABAergic long-range projections from the hippocampus. J Neurosci. 2007;27:8790–8804. doi: 10.1523/JNEUROSCI.1847-07.2007. [DOI] [PMC free article] [PubMed] [Google Scholar]
- Joyner AL, Zervas M. Genetic inducible fate mapping in mouse: establishing genetic lineages and defining genetic neuroanatomy in the nervous system. Dev Dyn. 2006;235:2376–2385. doi: 10.1002/dvdy.20884. [DOI] [PubMed] [Google Scholar]
- Kanatani S, Yozu M, Tabata H, Nakajima K. COUP-TFII is preferentially expressed in the caudal ganglionic eminence and is involved in the caudal migratory stream. J Neurosci. 2008;28:13582–13591. doi: 10.1523/JNEUROSCI.2132-08.2008. [DOI] [PMC free article] [PubMed] [Google Scholar]
- Karagiannis A, Gallopin T, Dávid C, Battaglia D, Geoffroy H, Rossier J, Hillman EM, Staiger JF, Cauli B. Classification of NPY-expressing neocortical interneurons. J Neurosci. 2009;29:3642–3659. doi: 10.1523/JNEUROSCI.0058-09.2009. [DOI] [PMC free article] [PubMed] [Google Scholar]
- Kimura S, Hara Y, Pineau T, Fernandez-Salguero P, Fox CH, Ward JM, Gonzalez FJ. The T/ebp null mouse: thyroid-specific enhancer-binding protein is essential for the organogenesis of the thyroid, lung, ventral forebrain, and pituitary. Genes Dev. 1996;10:60–69. doi: 10.1101/gad.10.1.60. [DOI] [PubMed] [Google Scholar]
- Klausberger T, Somogyi P. Neuronal diversity and temporal dynamics: the unity of hippocampal circuit operations. Science. 2008;321:53–57. doi: 10.1126/science.1149381. [DOI] [PMC free article] [PubMed] [Google Scholar]
- Klausberger T, Magill PJ, Márton LF, Roberts JD, Cobden PM, Buzsáki G, Somogyi P. Brain-state- and cell-type-specific firing of hippocampal interneurons in vivo. Nature. 2003;421:844–848. doi: 10.1038/nature01374. [DOI] [PubMed] [Google Scholar]
- Klausberger T, Márton LF, Baude A, Roberts JD, Magill PJ, Somogyi P. Spike timing of dendrite-targeting bistratified cells during hippocampal network oscillations in vivo. Nat Neurosci. 2004;7:41–47. doi: 10.1038/nn1159. [DOI] [PubMed] [Google Scholar]
- Klausberger T, Marton LF, O'Neill J, Huck JH, Dalezios Y, Fuentealba P, Suen WY, Papp E, Kaneko T, Watanabe M, Csicsvari J, Somogyi P. Complementary roles of cholecystokinin- and parvalbumin-expressing GABAergic neurons in hippocampal network oscillations. J Neurosci. 2005;25:9782–9793. doi: 10.1523/JNEUROSCI.3269-05.2005. [DOI] [PMC free article] [PubMed] [Google Scholar]
- Kubota Y, Shigematsu N, Karube F, Sekigawa A, Kato S, Yamaguchi N, Hirai Y, Morishima M, Kawaguchi Y. Selective coexpression of multiple chemical markers defines discrete populations of neocortical GABAergic neurons. Cereb Cortex. 2011 doi: 10.1093/cercor/bhq252. [DOI] [PubMed] [Google Scholar]
- Lambolez B, Audinat E, Bochet P, Crépel F, Rossier J. AMPA receptor subunits expressed by single Purkinje cells. Neuron. 1992;9:247–258. doi: 10.1016/0896-6273(92)90164-9. [DOI] [PubMed] [Google Scholar]
- Lavdas AA, Grigoriou M, Pachnis V, Parnavelas JG. The medial ganglionic eminence gives rise to a population of early neurons in the developing cerebral cortex. J Neurosci. 1999;19:7881–7888. doi: 10.1523/JNEUROSCI.19-18-07881.1999. [DOI] [PMC free article] [PubMed] [Google Scholar]
- Lee S, Hjerling-Leffler J, Zagha E, Fishell G, Rudy B. The largest group of superficial neocortical GABAergic interneurons expresses ionotropic serotonin receptors. J Neurosci. 2010;30:16796–16808. doi: 10.1523/JNEUROSCI.1869-10.2010. [DOI] [PMC free article] [PubMed] [Google Scholar]
- Levey MS, Brumwell CL, Dryer SE, Jacob MH. Innervation and target tissue interactions differentially regulate acetylcholine receptor subunit mRNA levels in developing neurons in situ. Neuron. 1995;14:153–162. doi: 10.1016/0896-6273(95)90249-x. [DOI] [PubMed] [Google Scholar]
- Lewis DA, Hashimoto T, Volk DW. Cortical inhibitory neurons and schizophrenia. Nat Rev Neurosci. 2005;6:312–324. doi: 10.1038/nrn1648. [DOI] [PubMed] [Google Scholar]
- Li XG, Somogyi P, Tepper JM, Buzsáki G. Axonal and dendritic arborization of an intracellularly labeled chandelier cell in the CA1 region of rat hippocampus. Exp Brain Res. 1992;90:519–525. doi: 10.1007/BF00230934. [DOI] [PubMed] [Google Scholar]
- Liodis P, Denaxa M, Grigoriou M, Akufo-Addo C, Yanagawa Y, Pachnis V. Lhx6 activity is required for the normal migration and specification of cortical interneuron subtypes. J Neurosci. 2007;27:3078–3089. doi: 10.1523/JNEUROSCI.3055-06.2007. [DOI] [PMC free article] [PubMed] [Google Scholar]
- López-Bendito G, Sturgess K, Erdélyi F, Szabó G, Molnár Z, Paulsen O. Preferential origin and layer destination of GAD65-GFP cortical interneurons. Cereb Cortex. 2004;14:1122–1133. doi: 10.1093/cercor/bhh072. [DOI] [PubMed] [Google Scholar]
- López-Bendito G, Sánchez-Alcañiz JA, Pla R, Borrell V, Picó E, Valdeolmillos M, Marín O. Chemokine signaling controls intracortical migration and final distribution of GABAergic interneurons. J Neurosci. 2008;28:1613–1624. doi: 10.1523/JNEUROSCI.4651-07.2008. [DOI] [PMC free article] [PubMed] [Google Scholar]
- Losonczy A, Zhang L, Shigemoto R, Somogyi P, Nusser Z. Cell type dependence and variability in the short-term plasticity of EPSCs in identified mouse hippocampal interneurones. J Physiol. 2002;542:193–210. doi: 10.1113/jphysiol.2002.020024. [DOI] [PMC free article] [PubMed] [Google Scholar]
- Losonczy A, Biro AA, Nusser Z. Persistently active cannabinoid receptors mute a subpopulation of hippocampal interneurons. Proc Natl Acad Sci U S A. 2004;101:1362–1367. doi: 10.1073/pnas.0304752101. [DOI] [PMC free article] [PubMed] [Google Scholar]
- Maccaferri G, McBain CJ. The hyperpolarization-activated current (Ih) and its contribution to pacemaker activity in rat CA1 hippocampal stratum oriens-alveus interneurones. J Physiol. 1996;497:119–130. doi: 10.1113/jphysiol.1996.sp021754. [DOI] [PMC free article] [PubMed] [Google Scholar]
- Maccaferri G, Roberts JD, Szucs P, Cottingham CA, Somogyi P. Cell surface domain specific postsynaptic currents evoked by identified GABAergic neurones in rat hippocampus in vitro. J Physiol. 2000;524:91–116. doi: 10.1111/j.1469-7793.2000.t01-3-00091.x. [DOI] [PMC free article] [PubMed] [Google Scholar]
- MacQueen J. Some methods for classification and analysis of multivariate observations. Proceedings of the Fifth Berkeley Symposium on Mathematical Statistics and Probability (Berkeley, CA, 1965/66), Vol I, Statistics; Berkeley, CA: University of California; 1967. pp. 281–297. [Google Scholar]
- Marchionni I, Takács VT, Nunzi MG, Mugnaini E, Miller RJ, Maccaferri G. Distinctive properties of CXC chemokine receptor 4-expressing Cajal-Retzius cells versus GABAergic interneurons of the postnatal hippocampus. J Physiol. 2010;588:2859–2878. doi: 10.1113/jphysiol.2010.190868. [DOI] [PMC free article] [PubMed] [Google Scholar]
- Marin O, Valiente M, Ge XC, Tsai LH. Guiding neuronal cell migrations. Cold Spring Harb Perspect Biol. 2010;2:20. doi: 10.1101/cshperspect.a001834. [DOI] [PMC free article] [PubMed] [Google Scholar]
- Maroof AM, Brown K, Shi SH, Studer L, Anderson SA. Prospective isolation of cortical interneuron precursors from mouse embryonic stem cells. J Neurosci. 2010;30:4667–4675. doi: 10.1523/JNEUROSCI.4255-09.2010. [DOI] [PMC free article] [PubMed] [Google Scholar]
- Mátyás F, Freund TF, Gulyas AI. Immunocytochemically defined interneuron populations in the hippocampus of mouse strains used in transgenic technology. Hippocampus. 2004;14:460–481. doi: 10.1002/hipo.10191. [DOI] [PubMed] [Google Scholar]
- McBain CJ, Fisahn A. Interneurons unbound. Nat Rev Neurosci. 2001;2:11–23. doi: 10.1038/35049047. [DOI] [PubMed] [Google Scholar]
- McBain CJ, DiChiara TJ, Kauer JA. Activation of metabotropic glutamate receptors differentially affects two classes of hippocampal interneurons and potentiates excitatory synaptic transmission. J Neurosci. 1994;14:4433–4445. doi: 10.1523/JNEUROSCI.14-07-04433.1994. [DOI] [PMC free article] [PubMed] [Google Scholar]
- Miyoshi G, Fishell G. GABAergic interneuron lineages selectively sort into specific cortical layers during early postnatal development. Cereb Cortex. 2011;21:845–852. doi: 10.1093/cercor/bhq155. [DOI] [PMC free article] [PubMed] [Google Scholar]
- Miyoshi G, Butt SJ, Takebayashi H, Fishell G. Physiologically distinct temporal cohorts of cortical interneurons arise from telencephalic Olig2-expressing precursors. J Neurosci. 2007;27:7786–7798. doi: 10.1523/JNEUROSCI.1807-07.2007. [DOI] [PMC free article] [PubMed] [Google Scholar]
- Miyoshi G, Hjerling-Leffler J, Karayannis T, Sousa VH, Butt SJ, Battiste J, Johnson JE, Machold RP, Fishell G. Genetic fate mapping reveals that the caudal ganglionic eminence produces a large and diverse population of superficial cortical interneurons. J Neurosci. 2010;30:1582–1594. doi: 10.1523/JNEUROSCI.4515-09.2010. [DOI] [PMC free article] [PubMed] [Google Scholar]
- Morino P, Herrera-Marschitz M, Castel MN, Ungerstedt U, Varro A, Dockray G, Hökfelt T. Cholecystokinin in cortico-striatal neurons in the rat: immunohistochemical studies at the light and electron microscopical level. Eur J Neurosci. 1994;6:681–692. doi: 10.1111/j.1460-9568.1994.tb00980.x. [DOI] [PubMed] [Google Scholar]
- Morozov YM, Torii M, Rakic P. Origin, early commitment, migratory routes, and destination of cannabinoid type 1 receptor-containing interneurons. Cereb Cortex. 2009;19(Suppl 1):i78–i89. doi: 10.1093/cercor/bhp028. [DOI] [PMC free article] [PubMed] [Google Scholar]
- Nery S, Fishell G, Corbin JG. The caudal ganglionic eminence is a source of distinct cortical and subcortical cell populations. Nat Neurosci. 2002;5:1279–1287. doi: 10.1038/nn971. [DOI] [PubMed] [Google Scholar]
- Ohning GV, Wong HC, Lloyd KC, Walsh JH. Gastrin mediates the gastric mucosal proliferative response to feeding. Am J Physiol. 1996;271:G470–G476. doi: 10.1152/ajpgi.1996.271.3.G470. [DOI] [PubMed] [Google Scholar]
- Owens DF, Kriegstein AR. Is there more to GABA than synaptic inhibition? Nat Rev Neurosci. 2002;3:715–727. doi: 10.1038/nrn919. [DOI] [PubMed] [Google Scholar]
- Pelkey KA, Lavezzari G, Racca C, Roche KW, McBain CJ. mGluR7 is a metaplastic switch controlling bidirectional plasticity of feedforward inhibition. Neuron. 2005;46:89–102. doi: 10.1016/j.neuron.2005.02.011. [DOI] [PubMed] [Google Scholar]
- Pesold C, Liu WS, Guidotti A, Costa E, Caruncho HJ. Cortical bitufted, horizontal, and Martinotti cells preferentially express and secrete reelin into perineuronal nets, nonsynaptically modulating gene expression. Proc Natl Acad Sci U S A. 1999;96:3217–3222. doi: 10.1073/pnas.96.6.3217. [DOI] [PMC free article] [PubMed] [Google Scholar]
- Pleasure SJ, Anderson S, Hevner R, Bagri A, Marin O, Lowenstein DH, Rubenstein JL. Cell migration from the ganglionic eminences is required for the development of hippocampal GABAergic interneurons. Neuron. 2000;28:727–740. doi: 10.1016/s0896-6273(00)00149-5. [DOI] [PubMed] [Google Scholar]
- Price CJ, Cauli B, Kovacs ER, Kulik A, Lambolez B, Shigemoto R, Capogna M. Neurogliaform neurons form a novel inhibitory network in the hippocampal CA1 area. J Neurosci. 2005;25:6775–6786. doi: 10.1523/JNEUROSCI.1135-05.2005. [DOI] [PMC free article] [PubMed] [Google Scholar]
- Qin J, Suh JM, Kim BJ, Yu CT, Tanaka T, Kodama T, Tsai MJ, Tsai SY. The expression pattern of nuclear receptors during cerebellar development. Dev Dyn. 2007;236:810–820. doi: 10.1002/dvdy.21060. [DOI] [PubMed] [Google Scholar]
- Ramos-Moreno T, Galazo MJ, Porrero C, Martínez-Cerdeño V, Clascá F. Extracellular matrix molecules and synaptic plasticity: immunomapping of intracellular and secreted Reelin in the adult rat brain. Eur J Neurosci. 2006;23:401–422. doi: 10.1111/j.1460-9568.2005.04567.x. [DOI] [PubMed] [Google Scholar]
- Rand WM. Objective criteria for evaluation of clustering methods. J Am Stat Assoc. 1971;66:846. [Google Scholar]
- Rousseeuw PJ. Silhouettes: a graphical aid to the interpretation and validation of cluster analysis. J Comput Appl Math. 1987;20:53–65. [Google Scholar]
- Rubin AN, Alfonsi F, Humphreys MP, Choi CK, Rocha SF, Kessaris N. The germinal zones of the basal ganglia but not the septum generate GABAergic interneurons for the cortex. J Neurosci. 2010;30:12050–12062. doi: 10.1523/JNEUROSCI.6178-09.2010. [DOI] [PMC free article] [PubMed] [Google Scholar]
- Schwaller B, Dick J, Dhoot G, Carroll S, Vrbova G, Nicotera P, Pette D, Wyss A, Bluethmann H, Hunziker W, Celio MR. Prolonged contraction-relaxation cycle of fast-twitch muscles in parvalbumin knockout mice. Am J Physiol. 1999;276:C395–C403. doi: 10.1152/ajpcell.1999.276.2.C395. [DOI] [PubMed] [Google Scholar]
- Sik A, Penttonen M, Ylinen A, Buzsáki G. Hippocampal CA1 interneurons: an in vivo intracellular labeling study. J Neurosci. 1995;15:6651–6665. doi: 10.1523/JNEUROSCI.15-10-06651.1995. [DOI] [PMC free article] [PubMed] [Google Scholar]
- Somogyi J, Baude A, Omori Y, Shimizu H, El Mestikawy S, Fukaya M, Shigemoto R, Watanabe M, Somogyi P. GABAergic basket cells expressing cholecystokinin contain vesicular glutamate transporter type 3 (VGLUT3) in their synaptic terminals in hippocampus and isocortex of the rat. Eur J Neurosci. 2004;19:552–569. doi: 10.1111/j.0953-816x.2003.03091.x. [DOI] [PubMed] [Google Scholar]
- Somogyi P, Klausberger T. Defined types of cortical interneurone structure space and spike timing in the hippocampus. J Physiol. 2005;562:9–26. doi: 10.1113/jphysiol.2004.078915. [DOI] [PMC free article] [PubMed] [Google Scholar]
- Soriano E, Del Río JA. The cells of Cajal-Retzius: still a mystery one century after. Neuron. 2005;46:389–394. doi: 10.1016/j.neuron.2005.04.019. [DOI] [PubMed] [Google Scholar]
- Soriano E, Del Río JA, Martínez A, Supèr H. Organization of the embryonic and early postnatal murine hippocampus. I. Immunocytochemical characterization of neuronal populations in the subplate and marginal zone. J Comp Neurol. 1994;342:571–595. doi: 10.1002/cne.903420406. [DOI] [PubMed] [Google Scholar]
- Sousa VH, Miyoshi G, Hjerling-Leffler J, Karayannis T, Fishell G. Characterization of Nkx6–2-derived neocortical interneuron lineages. Cereb Cortex. 2009;19(Suppl 1):i1–i10. doi: 10.1093/cercor/bhp038. [DOI] [PMC free article] [PubMed] [Google Scholar]
- Stuart G, Häusser M. Initiation and spread of soduim action potentials in cerebellar Purkinje cells. Neuron. 1994;13:703–712. doi: 10.1016/0896-6273(94)90037-x. [DOI] [PubMed] [Google Scholar]
- Sugino K, Hempel CM, Miller MN, Hattox AM, Shapiro P, Wu C, Huang ZJ, Nelson SB. Molecular taxonomy of major neuronal classes in the adult mouse forebrain. Nat Neurosci. 2006;9:99–107. doi: 10.1038/nn1618. [DOI] [PubMed] [Google Scholar]
- Sussel L, Marin O, Kimura S, Rubenstein JL. Loss of Nkx2.1 homeobox gene function results in a ventral to dorsal molecular respecification within the basal telencephalon: evidence for a transformation of the pallidum into the striatum. Development. 1999;126:3359–3370. doi: 10.1242/dev.126.15.3359. [DOI] [PubMed] [Google Scholar]
- Tricoire L, Pelkey KA, Daw MI, Sousa VH, Miyoshi G, Jeffries B, Cauli B, Fishell G, McBain CJ. Common origins of hippocampal ivy and nitric oxide synthase expressing neurogliaform cells. J Neurosci. 2010;30:2165–2176. doi: 10.1523/JNEUROSCI.5123-09.2010. [DOI] [PMC free article] [PubMed] [Google Scholar]
- Tsuzuki K, Lambolez B, Rossier J, Ozawa S. Absolute quantification of AMPA receptor subunit mRNAs in single hippocampal neurons. J Neurochem. 2001;77:1650–1659. doi: 10.1046/j.1471-4159.2001.00388.x. [DOI] [PubMed] [Google Scholar]
- Verheugen JA, Fricker D, Miles R. Noninvasive measurements of the membrane potential and GABAergic action in hippocampal interneurons. J Neurosci. 1999;19:2546–2555. doi: 10.1523/JNEUROSCI.19-07-02546.1999. [DOI] [PMC free article] [PubMed] [Google Scholar]
- Verney C, Takahashi T, Bhide PG, Nowakowski RS, Caviness VS., Jr Independent controls for neocortical neuron production and histogenetic cell death. Dev Neurosci. 2000;22:125–138. doi: 10.1159/000017434. [DOI] [PubMed] [Google Scholar]
- Vida I, Frotscher M. A hippocampal interneuron associated with the mossy fiber system. Proc Natl Acad Sci U S A. 2000;97:1275–1280. doi: 10.1073/pnas.97.3.1275. [DOI] [PMC free article] [PubMed] [Google Scholar]
- Vida I, Halasy K, Szinyei C, Somogyi P, Buhl EH. Unitary IPSPs evoked by interneurons at the stratum radiatum-stratum lacunosum-moleculare border in the CA1 area of the rat hippocampus in vitro. J Physiol. 1998;506:755–773. doi: 10.1111/j.1469-7793.1998.755bv.x. [DOI] [PMC free article] [PubMed] [Google Scholar]
- Vucurovic K, Gallopin T, Ferezou I, Rancillac A, Chameau P, van Hooft JA, Geoffroy H, Monyer H, Rossier J, Vitalis T. Serotonin 3A receptor subtype as an early and protracted marker of cortical interneuron subpopulations. Cereb Cortex. 2010;20:2333–2347. doi: 10.1093/cercor/bhp310. [DOI] [PMC free article] [PubMed] [Google Scholar]
- Vullhorst D, Neddens J, Karavanova I, Tricoire L, Petralia RS, McBain CJ, Buonanno A. Selective expression of ErbB4 in interneurons, but not pyramidal cells, of the rodent hippocampus. J Neurosci. 2009;29:12255–12264. doi: 10.1523/JNEUROSCI.2454-09.2009. [DOI] [PMC free article] [PubMed] [Google Scholar]
- Waldau B, Hattiangady B, Kuruba R, Shetty AK. Medial ganglionic eminence-derived neural stem cell grafts ease spontaneous seizures and restore GDNF expression in a rat model of chronic temporal lobe epilepsy. Stem Cells. 2010;28:1153–1164. doi: 10.1002/stem.446. [DOI] [PMC free article] [PubMed] [Google Scholar]
- Wang Y, Dye CA, Sohal V, Long JE, Estrada RC, Roztocil T, Lufkin T, Deisseroth K, Baraban SC, Rubenstein JL. Dlx5 and Dlx6 regulate the development of parvalbumin-expressing cortical interneurons. J Neurosci. 2010;30:5334–5345. doi: 10.1523/JNEUROSCI.5963-09.2010. [DOI] [PMC free article] [PubMed] [Google Scholar]
- Ward JH. Hierarchical grouping to optimize an objective function. J Am Stat Assoc. 1963;58:236–244. [Google Scholar]
- Wichterle H, Turnbull DH, Nery S, Fishell G, Alvarez-Buylla A. In utero fate mapping reveals distinct migratory pathways and fates of neurons born in the mammalian basal forebrain. Development. 2001;128:3759–3771. doi: 10.1242/dev.128.19.3759. [DOI] [PubMed] [Google Scholar]
- Wierenga CJ, Müllner FE, Rinke I, Keck T, Stein V, Bonhoeffer T. Molecular and electrophysiological characterization of GFP-expressing CA1 interneurons in GAD65-GFP mice. PLoS One. 2010;5:e15915. doi: 10.1371/journal.pone.0015915. [DOI] [PMC free article] [PubMed] [Google Scholar]
- Wonders CP, Anderson SA. The origin and specification of cortical interneurons. Nat Rev Neurosci. 2006;7:687–696. doi: 10.1038/nrn1954. [DOI] [PubMed] [Google Scholar]
- Wonders CP, Taylor L, Welagen J, Mbata IC, Xiang JZ, Anderson SA. A spatial bias for the origins of interneuron subgroups within the medial ganglionic eminence. Dev Biol. 2008;314:127–136. doi: 10.1016/j.ydbio.2007.11.018. [DOI] [PMC free article] [PubMed] [Google Scholar]
- Xu Q, Cobos I, De La Cruz E, Rubenstein JL, Anderson SA. Origins of cortical interneuron subtypes. J Neurosci. 2004;24:2612–2622. doi: 10.1523/JNEUROSCI.5667-03.2004. [DOI] [PMC free article] [PubMed] [Google Scholar]
- Xu Q, Wonders CP, Anderson SA. Sonic hedgehog maintains the identity of cortical interneuron progenitors in the ventral telencephalon. Development. 2005;132:4987–4998. doi: 10.1242/dev.02090. [DOI] [PubMed] [Google Scholar]
- Xu Q, Tam M, Anderson SA. Fate mapping Nkx2.1-lineage cells in the mouse telencephalon. J Comp Neurol. 2008;506:16–29. doi: 10.1002/cne.21529. [DOI] [PubMed] [Google Scholar]
- Xu Q, Guo L, Moore H, Waclaw RR, Campbell K, Anderson SA. Sonic hedgehog signaling confers ventral telencephalic progenitors with distinct cortical interneuron fates. Neuron. 2010;65:328–340. doi: 10.1016/j.neuron.2010.01.004. [DOI] [PMC free article] [PubMed] [Google Scholar]
- Xu X, Roby KD, Callaway EM. Mouse cortical inhibitory neuron type that coexpresses somatostatin and calretinin. J Comp Neurol. 2006;499:144–160. doi: 10.1002/cne.21101. [DOI] [PubMed] [Google Scholar]
- Ye P, Bagnell R, D'Ercole AJ. Mouse NG2+ oligodendrocyte precursors express mRNA for proteolipid protein but not its DM-20 variant: a study of laser microdissection-captured NG2+ cells. J Neurosci. 2003;23:4401–4405. doi: 10.1523/JNEUROSCI.23-11-04401.2003. [DOI] [PMC free article] [PubMed] [Google Scholar]
- Yozu M, Tabata H, Nakajima K. The caudal migratory stream: a novel migratory stream of interneurons derived from the caudal ganglionic eminence in the developing mouse forebrain. J Neurosci. 2005;25:7268–7277. doi: 10.1523/JNEUROSCI.2072-05.2005. [DOI] [PMC free article] [PubMed] [Google Scholar]
- Zhao Y, Flandin P, Long JE, Cuesta MD, Westphal H, Rubenstein JL. Distinct molecular pathways for development of telencephalic interneuron subtypes revealed through analysis of Lhx6 mutants. J Comp Neurol. 2008;510:79–99. doi: 10.1002/cne.21772. [DOI] [PMC free article] [PubMed] [Google Scholar]