Abstract
The stability of a formulated heparin was examined during its sterilization by autoclaving. A new method to follow loss in heparin binding to the serine protease inhibitor, antithrombin III, and the serine protease, thrombin, and was developed using a surface plasmon resonance (SPR) competitive binding assay. This loss in binding affinity correlated well with loss in anti-factor IIa (thrombin) activity as well as anti-factor Xa activity as measured using conventional amidolytic assays. Autoclaving also resulted in a modest breakdown of the heparin backbone as confirmed by a slight reduction in number averaged and weight averaged molecular weight and an increase in polydispersity. While no clear changes were observed by nuclear magnetic resonance spectroscopy, disaccharide composition analysis using high-performance liquid chromatography-electrospray ionization mass spectrometry suggested loss of selected sulfo groups had taken place. It is this sufo group loss that probably accounts for a decrease in the binding of autoclaved heparin to antithrombin III and thrombin as well as the observed decrease in its amidolytic activity.
Keywords: heparin, surface plasmon resonance, antithrombin III, thrombin, interaction, stability, autoclaving
INTRODUCTION
Heparin is a highly sulfated, linear glycosaminoglycan (GAG) that is abundantly found in mucosal tissues such as the lungs and intestines. The structure of this ~10–20 kD polysaccharide is predominantly made up of a major repeating disaccharide unit, α-L-IdoA2S (1→4)-α-D-GlcNS6S (where IdoA is idopyranosyluronic acid, S is sulfo and GlcN is 2-deoxy, 2-amino glucopyranose).1 The structure and sulfation pattern of the molecule are integral to its therapeutic value. In particular, a unique pentasaccharide sequence present in heparin having the structure, →GlcNAc6S→GlcA→GlcNS3S6S→IdoA2S→GlcNS6S→ (where GlcA is D-glucopyranosyluronic acid and Ac is acetyl), is responsible for its specific binding to the serine protease inhibitor antithrombin III (ATIII) resulting in its conformational activation and leading to the inhibition of major coagulation cascade proteases, including thrombin (factor (F) IIa) and FXa.1 Thrombin binds, with less specificity, to an adjacent decasaccharide domain comprised of heparin’s abundant trisulfated disaccharide repeating unit, →IdoA2S→GlcNS6S→, resulting in a ternary thrombin-heparin-ATIII complex.1 Unlike thrombin, FXa does not form a ternary complex as it does not directly interact with heparin but, rather, is inhibited directly by conformationally activated ATIII. Thus, the inactivation of thrombin by ATIII requires a longer heparin chain (having >15 saccharide units) than the small pentasaccharide capable of promoting the ATIII-inactivation. Thus, while heparin exhibits equal anti-FXa/anti-FIIa activity, low molecular weight heparins show greater anti-FXa activity than anti-IIa activity. 1
Heparin is commonly used as an injectable anticoagulant during medical procedures. Despite heparin’s widespread use for over 80 years, there are very few publications detailing its stability.2,3 Previous work in our laboratory described one of the few stability studies on heparin active pharmaceutical ingredient (API) under highly acidic/basic conditions over extended periods of time.2 This study demonstrated that under highly basic conditions heparin chain length was reduced through β-elimination, whereas under acidic conditions heparin chain length was reduced through hydrolysis. Loss of sulfation was also observed under acidic conditions but not under basic conditions. A previous study on the stability of Enoxaparin, a form of low molecular weight heparin (LMWH) heated the compound for several days.3 These researchers observed decrease in anti-FXa, and a loss of sulfo groups as well as an increase in unsubstituted amine groups and reducing capacity over the duration of the experiment. Both exhibited steep changes over the 24 h and then showed remarkably less change in the remaining more than 500 hr of the experiment. The current study examines the stability of a heparin formulation following its sterilization by autoclaving. Autoclave sterilization is currently widely used in the pharmaceutical industry for preparing sterile heparin formulations for injection and parenteral use. The current study correlates changes in heparin binding determined by surface plasmon resonance (SPR) with changes in heparin’s in vitro activity. Activity was measured using anti-FIIa (thrombin) and anti-FXa bioassays. Changes in heparin chain length were determined using polyarcylamide gel electrophoresis (PAGE) and changes in its fine structure was examined by nuclear magnetic resonance (NMR) spectroscopy and by disaccharide analysis using high-performance liquid chromatography (HPLC)-mass spectrometry (MS). A measure of heparin stability on autoclaving is provided.
EXPERIMENTAL
Materials
USP heparin sodium (>180 U/mg) active pharmaceutical ingredient (API) was purchased from multiple commercial suppliers. Recombinant Flavobacterial heparin lyase I, II, and III were expressed in our laboratory using E. coli strains, provided by Professor Jian Liu, University of North Carolina, College of Pharmacy, Chapel Hill, NC). Polyacrylamide, Alcian blue dye, 2-cyanoacetamide, tetra-n-butylamonium hydrogen sulfate, and all other reagents used in this study were from Sigma (St. Louis, MO). Unsaturated heparin/HS disaccharides standards (Di-0S, ΔUA-GlcNAc; Di-NS, ΔUA-GlcNS; Di-6S, ΔUA-GlcNAc6S; Di-UA2S, ΔUA2S-GlcNAc; Di-UA2SNS, ΔUA2S-GlcNS; Di-NS6S, ΔUA-GlcNS6S; Di-UA2S6S, ΔUA2S-GlcNAc6S; and Di-triS, ΔUA2S-GlcNS6S) were obtained from Seikagaku Corporation (Japan). ATIII and human thrombin were acquired from Hyphen Biomed (Neuville sur Oise, France).
Formulation and sterilization of heparin
Heparin sodium 40 U/mL, in 5% dextrose, pH 5.8 was prepared and 1 L of this sample was divided into four equal portions. One portion was retained (unsterilized heparin solution). The three remaining heparin samples were sterilized by at 121°C for 30, 60, and 120 min, respectively.
Surface Plasma Resonance (SPR) analysis
Preparation of heparin biochip
The biotinylated heparin was prepared by reaction of sulfo-N-hydroxysuccinimide long-chain biotin (Piece, Rockford, IL) with free amino groups of unsubstituted glucosamine residues in the polysaccharide chain following a published procedure.4 Biotinylated heparin was immobilized to streptavidin (SA) chip based on the manufacturer’s protocol. In brief, 20 μL solution of the heparin-biotin conjugate (0.1 mg/mL) in HBS-EP (10 mM 4-(2-hydroxyethyl-1-piperazineethanesulfonic acid (HEPES), 150 mM sodium chloride, 3 nM ethylenediaminetetraacetic acid (EDTA), 0.005% polysorbate surfactant P20 pH 7.4 buffer) running buffer was injected over flow cell 2 (FC2) of the SA chip at a flow rate of 10 μL/min. The successful immobilization of heparin was confirmed by the observation of a 100 resonance unit (RU) increase in the sensor chip. The control flow cell (FC1) was prepared by 1 min injection with saturated biotin.
Measurement of interaction between heparin and AT III and thrombin using SPR
The protein (AT III or thrombin) samples were diluted in HBS-EP buffer. Different dilutions of protein samples were injected at a flow rate of 30 μL/min. At the end of the sample injection, the same buffer was flowed over the sensor surface to facilitate dissociation. After a 3 min dissociation time, the sensor surface was fully regenerated by injecting 30 μL of 2 M NaCl. The response was monitored as a function of time (sensorgram) at 25 °C.
Solution competition study between surface heparin and soluble heparin using SPR
AT III (250 nM) mixed with different of concentrations of heparin (sterilized and unsterilized) in HBS-EP buffer were injected over heparin chip at a flow rate of 30 μL/min, respectively. After each run, the dissociation and the regeneration were performed as described above. For each set of competition experiments on SPR, a control experiment (only protein without heparin) was performed to make sure the surface was completely regenerated and that the results obtained between runs were comparable. The same was performed with 63 nM thrombin in place of the ATIII.
Anti-FIIa and anti-FXa assays
The chromogenic assays for the determination of heparin activity in citrated plasma were performed on an ACL 8000 coagulation analyzer (Beckman Coulter, Fullerton, California). 5 The heparin anti-FXa assay was run using the HemosIL kit purchased from Beckman Coulter (Brea, CA). The heparin anti-FIIa assay was run using the Antichrome Heparin kit purchased from American Diagnostica Inc. (Stamford, CT). Neutralization of anti-FXa activity of heparin was determined using the Hemosil heparin kit (linearity: 0–0.8 U/mL; intra-assay coefficient of variation (CV): 8%; inter-assay CV: 9%), obtained from Instrumentation Laboratory Company (Lexington, Massachusetts). For the anti-FIIa assay, the Actichrome heparin anti-FIIa (American Diagnostica; Stamford, Connecticut) was adopted on the ACL 8000 coagulation analyzer (linearity: 0–0.6 U/mL; intra-assay CV: 9%; inter-assay CV: 7%).
Polyacrylamide gel electrophoresis (PAGE) analysis
PAGE was used to determine the number averaged molecular weight (MN) and weight averaged molecular weight (MW), as well as the polydispersity (PD), of the heparin samples. An aliquot of 3–5 μg of a sample was loaded into a lane of the gel and then subjected to electrophoresis. The samples included a standard ladder comprised of oligosaccharides collected from the digestion of bovine lung heparin. The gel was stained with Alcian blue, and calculations were made using UN-scan–it software (Silk Scientific, Utah) and the MN, MW and PD were calculated.6
Disaccharide analysis using LC/MS
Heparin (20 mg/mL) was treated with heparin lyase I, II, III (3 m-unit each in 10 μL of sodium phosphate (5 mM, pH 7.1) buffer) and incubated at 37°C overnight.7 The products were filtered using 10,000 MWCO centrifugal filters and the disaccharides were recovered in the filtrate. The total recovery of disaccharides from heparin samples by heparin lyases digestion followed by a membrane filtration (10,000 MWCO) was range from 55% to 65%. The disaccharides were freeze-dried and exactly 100 μL of water was added prior to their analysis. Disaccharide analysis was performed on a HPLC-MS system (Agilent LC/MSD trap MS).7 Solution A and B for the HPLC separation contained 37.5 mM NH4HCO3 and 11.25 mM tributylamine in 15% and 70% acetonitrile, respectively. The pH values of these solutions were adjusted to 6.5 with acetic acid. Separation was performed on a C-18 column (Agilent) at a flow rate was 10 μL/min using solution A for 20 min, followed by a linear gradient from 20 to 45 min of 0% to 50% solution B. The column effluent entered the source of the ESI-MS for continuous detection by MS. The electrospray interface was set in the negative ionization mode with the skimmer potential of −40.0 V, capillary exit at −40.0 V, and a source of temperature at 325 °C to obtain the maximum abundance of the ions in full scan spectra (150–1500 Da, 10 full scans/s). Nitrogen was used as a drying (5 L/min) and nebulizing gas (20 psi).
Nuclear Magnetic Resonance (NMR) analysis
Unsterilized heparin and heparin following sterilization were analyzed by 1H-NMR and two-dimensional NMR; heteronuclear single quantum coherence (HSQC) and proton-proton correlation spectroscopy (HHCOSY) to characterize their structures. All NMR experiments were performed on Bruker Advance II 600 MHz spectrometer with Topsin 2.0 software. Samples were each dissolved in 0.5 mL D2O (99.996%, Sigma, Co.) and freeze-dried repeatedly to remove the exchangeable protons. The samples were re-dissolved in 0.3 mL D2O and transferred to NMR microtubes (OD 5 mm, Shigemi tubes). The conditions for one-dimensional 1H spectra were as follows: wobble sweep width of 12.3 kHz, acquisition time of 2.66 s, and relaxation delay of 8.00 s. Temperature was 298 K and 323 K. The conditions for two-dimensional HMQC spectra were as follows: 32 scans, sweep width of 6.15 kHz, acquisition time of 0.33 s, and relaxation delay of 0.90 s. The conditions for two-dimensional COSY spectra were as follows: 16 scans, sweep width of 7.40 kHz, acquisition time of 0.28 s, and relaxation delay of 1.50 s.
RESULTS AND DISCUSSION
Heparin API is routinely formulated in saline or saline containing glucose for use in a variety of clinical applications. Most of these formulations undergo terminal sterilization by autoclaving. Heparin is a polydisperse, microheterogenous drug that might undergo decomposition through a number of pathways at the elevated temperatures used for its sterilization. Typically, following sterilization and in stability studies, only the potency of the drug and possibly some physical characteristics such as color and particulates, are monitored. Very few stability studies examining the structural changes in heparin and related low molecular weight heparins have been published.2,3 The stability of heparin in the presence of acid, base and oxidants at room temperature and elevated temperatures have been published,2 but we find no studies on the stability of formulated heparin towards terminal sterilization by autoclaving. Moreover, it would be useful do devise new methods, in addition to the USP potency assay to examine heparin stability.
Surface Plasma Resonance (SPR) analysis
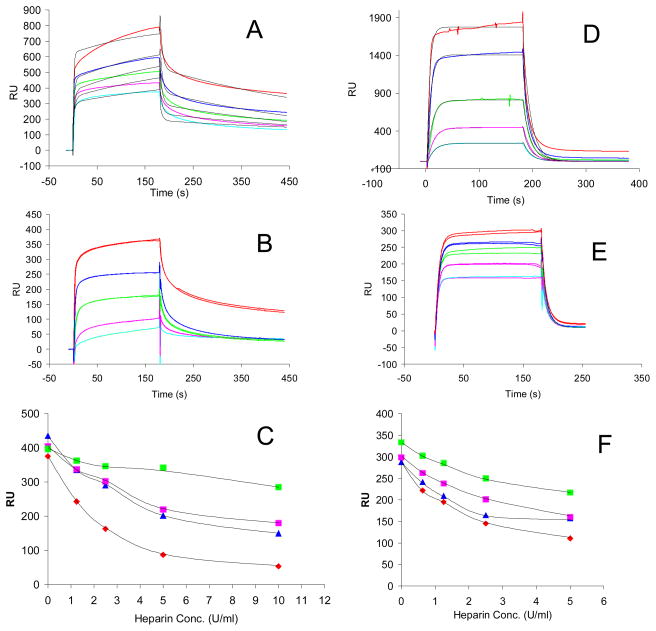
Two proteins (AT III and thrombin), having important roles in coagulation system, were used for the heparin binding SPR experiments. AT III and thrombin are known to bind heparin with sub-micromolar affinity. Kinetic data of AT III-heparin interactions (Figure 1A) was obtained by as previously reported fitting8 with conformational change model: ka1 = 1.14 × 10⁵ (± 3.87 × 10³) (MS)−1, kd1 = 0.2 (± 6.62 × 10⁻³) (S−1), ka2 = 5.74 × 10⁻³ (± 1.6×10⁻⁴) (S−1), kd2 = 2.35 × 10⁻³ (± 7.14×10⁻⁵) (S−1). Similarly, the kinetic data of thrombin-heparin interactions (Figure 1D) was obtained by fitting with 1:1 Langmuir binding model: ka = 2.84 × 10⁵ (± 1.05 × 10⁴) (MS)−1, kd = 0.0512 (± 1.0 ×10⁻³)(S−1). KD= 1.8 × 10⁻⁷ (M).
Fig. 1.
SPR sensorgrams of AT III-heparin and human thrombin-heparin interaction and IC50 measurement of heparin product with different autoclaving time using surface competition SPR. Panel A. Sensorgrams of heparin-AT III interactions. Concentrations of AT III (from top to bottom): 1000, 500, 250, 125, and 63 nM, respectively. The black curves in all sensorgrams are the fitting curves using models from BIAevaluate 4.0.1. Panel B. Competition SPR sensorgrams of AT III-heparin interaction (solution heparin/surface heparin competition). AT III concentration was 250nM, and concentrations of heparin in solution (from top to bottom) were 0,1.25, 2.5, 5, 10 U/ml, respectively; Panel C. IC50 measurement of heparin product with different autoclaving time to AT III using surface competition SPR. Color code: red: non-sterilized heparin, blue: 30 min sterilized heparin, pink: 60 min sterilized heparin, and green: 120 min sterilized heparin. Panel D. Sensorgrams of heparin-human factor IIa (thrombin) interactions. Concentrations of human thrombin (from top to bottom): 1000, 500, 250, 125, and 63 nM, respectively. The black curves in all sensorgrams are the fitting curves using models from BIAevaluate 4.0.1. Panel E. Competition SPR sensorgrams of human thrombin-heparin interaction (solution heparin/surface heparin competition). Human thrombin concentration was 125nM, and concentrations of heparin in solution (from top to bottom) were 0, 0.63, 1.25, 2.5, 5 U/ml, respectively; Panel F. IC50 measurement of heparin product with different autoclaving time to human thrombin using surface competition SPR. Color code: red: non-sterilized heparin, blue: 30 min sterilized heparin, pink: 60 min sterilized heparin, and green: 120 min sterilized heparin.
Next, to examine the effect of sterilized heparin on the heparin-AT III and heparin-thrombin interaction, solution/surface competition experiments were performed by SPR. AT III (250 nM) mixed with different of concentrations of heparin (sterilized or not sterilized) in HBS-EP buffer were injected over heparin chip. The injections were in performed in duplicate. Once the active binding sites on AT III molecules were occupied by heparin in the solution, the binding of AT III to the surface-immobilized heparin should decrease resulting in a reduction in SPR (Figure 1B). Similar solution/surface competition experiments were conducted with thrombin (Figure 1E). The IC50 values (concentration of competing analyte resulting in a 50% decrease in response units (RU)) can be calculated from the solution/surface competition SPR. The competition plots (ATIII or thrombin binding signal (RU) versus heparin concentration in solution) are shown in Figure 1C and F. The calculated IC50 values for non-sterilized heparin and sterilized heparin are shown in Table 1. These data show that the binding affinity of sterilized heparin, to both ATIII and thrombin, decrease in comparison to the non-sterilized heparin. Competition studies also reveal that the binding affinity for both ATIII and thrombin decrease with increasing autoclaving time. After autoclave sterilization for 120 min, the IC50 values for the heparin sample increased by a factor of five, from ~2 U/mL to >10 U/mL. This change in affinity suggests that both the ATIII-binding site, →GlcNAc6S→GlcA→GlcNS3S6S→IdoA2S→GlcNS6S→, and thrombin-binding site [IdoA2S→GlcNS6S→]4–5, have been altered during the course of sterilization.
Table 1.
IC50 of sterilized heparin measured by solution/surface competition SPR (based on duplicated experiments with less than 5% of errors)
| IC50 (U/ml) to AT III | IC50 (U/ml) to Human Thrombin | |
|---|---|---|
| Non-Sterilized Heparin | 2.0 | 2.3 |
| 30 min Sterilized Heparin | 4.6 | 5.0 |
| 60 min Sterilized Heparin | 6.8 | 5.5 |
| 120 min Sterilized Heparin | >10 | >10 |
Analysis of Heparin Activity
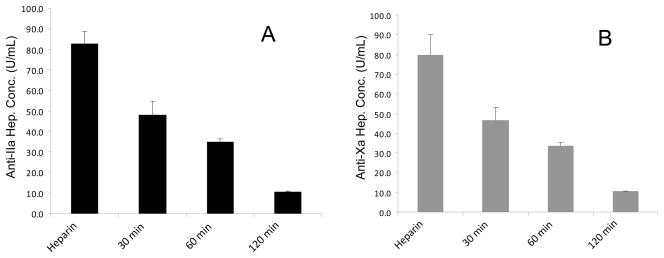
Sterilization of formulated heparin by resulted in a decrease in biological activity as determined using the USP potency assays. A significant decrease in both anti-FXa activity and anti-FIIa activity was observed following less than 30 min (P<0.01) of autoclaving (Figure 2 A and B). The anti-FXa and anti-FIIa activity ratio remained around 1.0, demonstrating that both activities decreased a similar degree over time. These results suggest that the degradation process led to the direct loss in ATIII-mediated activity and not through a reduction of molecular weight affording low molecular weight heparin, which typically show an enhanced anti-FXa/anti-FIIa ratio of >1.9
Fig. 2.
Anti-IIa and Anti-Xa assay on heparin product with different autoclaving time. Panel A: Anti-IIa assay; Panel B: Anti-Xa assay
Polyacrylamide gel electrophoresis (PAGE) analysis
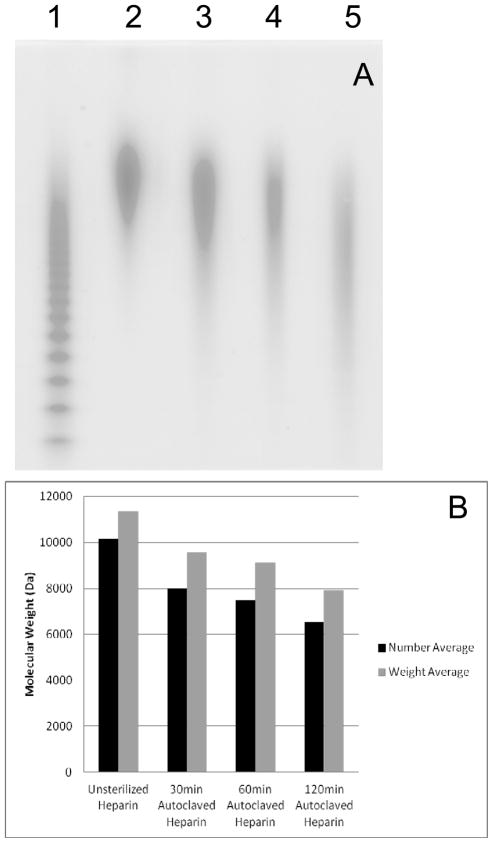
The average molecular weights of the samples decreased with increased autoclaving time up to 6.4% for MN and 7.0% for MW (Figure 3A and B). PD increased by ~6% on sterilization. This trend supports some physical degradation of the macromolecule through hydrolysis under mildly acidic conditions. The PD values following autoclaving (1.16–1.22) more closely resembled that of heparin (1.15) than the higher values reported for various low molecular weight heparins (1.3–1.4).10
Fig. 3.
PAGE analysis of heparin product with different autoclaving time. A. Lane 1, HP oligosaccharide standards; lane 2 to 4: non-sterilized heparin, 30 min sterilized heparin, 60 min sterilized Heparin, and 120 min sterilized heparin. B. Molecular weight change of heparin product with different autoclaving time. The PD values for the four samples were 1.15, 1.16, 1.20, 1.22, respectively.
HPLC-MS Disaccharide Analysis
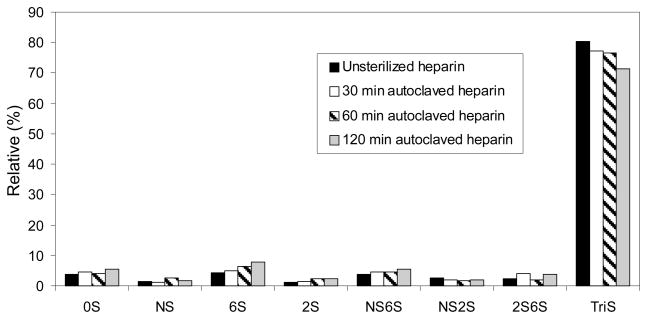
HPLC-MS disaccharide analysis revealed a decrease in trisulfated disaccharide (the major repeating unit in heparin typically corresponding to between ~80% of total disaccharide9) as autoclaving time increased (Figure 4). The decrease in trisulfated disaccharide is consistent with the observed decrease in thrombin binding affinity measured using competition SPR. HPLC-MS disaccharide analysis also showed increasing trends for fractions of Di-0S, Di-6S, Di-2S, and Di-NS6S suggesting that certain sulfate groups are more likely to be lost during autoclaving. The loss of sulfo groups, including ones in both the ATIII and thrombin binding sites, is consistent with degradation previously reported when heparin is heated in a highly acidic solution.2 It is not currently possible to directly assess the loss of sulfo groups in the ATIII pentasaccharide binding site since the heparinase insensitivity of the linkage on the non-reducing side of its GlcNS3S6S residue, makes it difficult to directly determine the amount of pentasaccharide sequence using disaccharide compositional analysis.11
Fig. 4.
Disaccharide compositional analysis of heparin product with different autoclaving time
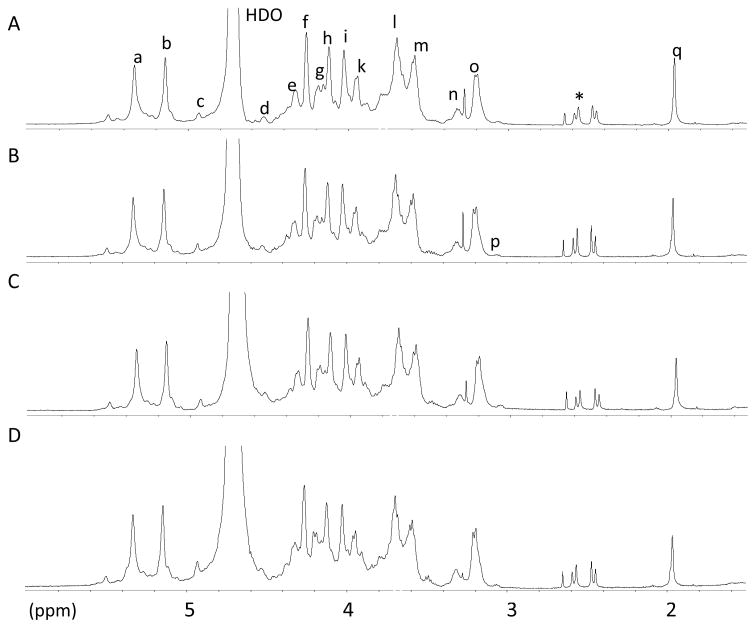
Nuclear Magnetic Resonance (NMR) analysis: The heparin samples from different autoclaving conditions were analyzed using 600 MHz 1H-NMR (Figure 5) and 600 MHz 1H-13C HMQC (data not shown). No major structural changes were apparent by NMR in the five samples. The intensity of NS glucosamine peak in the 2D HMQC spectra decreased slightly on autoclaving, but these data are not easy to qualify. Moreover, the presence of the unique GlcNS3S6S residue in the center of the antithrombin pentasaccharide sequence seems undiminished in intensity.
Fig. 5.
600 MHz 1H-NMR spectra of non-sterilized heparin (A), 30 min sterilized heparin (B), 60 min sterilized heparin (C), 120 min sterilized heparin (D) recorded in D20 at 298 K. Signals, a, H1 GlcNS, GlcNS6S; b, H1 IdoA2S; c, H1 IdoA; d, H1 GlcA; e, H6 GlcNS6S; f, H2 Ido2S; g, H6′ GlcNS6S; h, H3 IdoA2S; i, H4 IdoA2S; j, H5 GlcNS6S; k, H6 GlcNS; l, H4 GlcNS6S; m, H3 GlcNS, GlcNS6S; n, H2 GlcA; o, H2 GlcNS6S; p, H2 GlcNH2; q, acetyl CH3; Asterisks shows undefined peaks.
In conclusion, this study has shown that the structure and activity of heparin can be affected by autoclave sterilization. The present study examined only a single formulation containing dextrose and saline that is slightly acidic. Other formulations are known to be stable on autoclaving. A novel method relying on SPR for rapidly determining the stability of such formulations has been developed. In the formulation examined in the current study, the binding affinity of heparin for AT III and thrombin both decrease by approximately a factor of five after autoclaving for 120 min. The MN and MW decrease and polydispersity increases, characteristic of physical degradation of the polysaccharide chain. HPLC/MS disaccharide analysis revealed a decrease in trisulfated disaccharide as the autoclaving time increased with concomitant increase in selected undersulfated disaccharides, suggesting that certain sulfo groups are more likely to be lost during sterilization. NMR analysis showed no major structural changes in heparin after autoclaving.
Acknowledgments
This work was supported by grants from the funded by the National Institutes of Health HL101721 and HL096972.
References
- 1.Linhardt RJ. Heparin: Structure and activity. J Med Chem. 2003;46:2551–2554. doi: 10.1021/jm030176m. [DOI] [PubMed] [Google Scholar]
- 2.Jandik KA, Kruep D, Cartier M, Linhardt RJ. Accelerated stability studies of heparin. J Pharm Sci. 1996;85:45–51. doi: 10.1021/js9502736. [DOI] [PubMed] [Google Scholar]
- 3.Patel RP, Narkowicz C, Jacobson GA. Investigation of the effect of heating on the chemistry and antifactor Xa activity of Enopaparin. J Pharm Sci. 2009;98:1700–1711. doi: 10.1002/jps.21556. [DOI] [PubMed] [Google Scholar]
- 4.Hernaiz M, Liu J, Rosenberg RD, Linhardt RJ. Enzymatic modification of heparan sulfate on a biochip promotes its interaction with antithrombin III. Biochem Biophys Res Commun. 2000;276:292–297. doi: 10.1006/bbrc.2000.3453. [DOI] [PubMed] [Google Scholar]
- 5.Mousa SA, Zhang F, Aljada A, Chaturvedi S, Takieddin M, Zhang H, Chi L, Arbit E, Castelli MC, Goldberg MM, Linhardt RJ. Pharmacokinetics and pharmacodynamics of oral heparin solid dosage form in healthy human subjects. Journal of Clinical Pharmacology. 2007;47:1508–1520. doi: 10.1177/0091270007307242. [DOI] [PMC free article] [PubMed] [Google Scholar]
- 6.Edens RE, Al-Hakim A, Weiler JM, Rethwisch DG, Fareed J, Linhardt RJ. Gradient polyacrylamide gel electrophoresis for determination of the molecular weights of heparin preparations and low-molecular-weight heparin derivatives. J Pharm Sci. 1992;81:823–827. doi: 10.1002/jps.2600810821. [DOI] [PubMed] [Google Scholar]
- 7.Zhang Z, Xie J, Liu H, Liu J, Linhardt RJ. Quantitification of heparan sulfate and heparin disaccharides using ion-pairing, reverse-phase, micro-flow, high performance liquid chromatography coupled with electrospray ionization trap mass spectrometry. Anal Chem. 2009;81:4349–4355. doi: 10.1021/ac9001707. [DOI] [PMC free article] [PubMed] [Google Scholar]
- 8.Li B, Suwan J, Martin JG, Zhang F, Zhang Z, Hoppensteadt D, Clark M, Fareed J, Linhardt RJ. Oversulfated chondroitin sulfate interaction with heparin-binding proteins: New insights into adverse reactions from contaminated heparins. Biochem Pharmacol. 2009;78:292–300. doi: 10.1016/j.bcp.2009.04.012. [DOI] [PMC free article] [PubMed] [Google Scholar]
- 9.Linhardt RJ, Gunay NS. Production and chemical processing of low molecular weight heparins. Semin Thrombos Hemostas. 1999;25:5–16. [PubMed] [Google Scholar]
- 10.Linhardt RJ, Loganathan D, Al-Hakim A, Wang HM, Walenga JM, Hoppensteadt D, Fareed J. Oligosaccharide mapping of low molecular weight heparins: Structure and activity differences. J Med Chem. 1990;33:1639–1645. doi: 10.1021/jm00168a017. [DOI] [PubMed] [Google Scholar]
- 11.Xiao Z, Zhao W, Yang B, Zhang Z, Guan H, Linhardt RJ. Structural motif in heparin oligosaccharides: Heparinase susceptible 3,6-di-O-sulfo-2-deoxy-2-sulfamido-α-D-glucopyranose (1,4) 2-O-sulfo-α-L-idopyranosyluronic acid linkage. Glycobiology. 2011;21:13–22. doi: 10.1093/glycob/cwq123. [DOI] [PMC free article] [PubMed] [Google Scholar]


