

Abstract
Genome-wide analysis has documented differential gene expression between closely related species in plants and animals and nonadditive gene expression in hybrids and allopolyploids compared to the parents. In Arabidopsis, 15–43% of genes are expressed differently between the related species, Arabidopsis thaliana and Arabidopsis arenosa, the majority of which are nonadditively expressed (differently from mid-parent value) in allotetraploids. Nonadditive gene expression can be caused by transcriptional regulation through chromatin modifications, but the role of posttranscriptional regulation in nonadditive gene expression is largely unknown. Here we reported genome-wide analysis of mRNA decay in resynthesized Arabidopsis allotetraploids. Among ∼26,000 annotated genes, over 1% of gene transcripts showed rapid decay with an estimated half-life of less than 60 minutes, and they are called allotetraploid genes with unstable transcripts (AlloGUTs). Remarkably, 30% of alloGUTs matched the nonadditively expressed genes, and their expression levels were negatively correlated with the decay rate. Compared to all genes, these nonadditively expressed alloGUTs were overrepresented 2-6-fold in the Gene Ontology (GOSlim) classifications in response to abiotic and biotic stresses, signal transduction, and transcription. Interestingly, the AlloGUTs include transcription factor genes that are highly inducible under stress conditions and circadian clock regulators that regulate growth in A. thaliana. These data suggest a role of mRNA stability in homoeologous gene expression in Arabidopsis allopolyploids. The enrichment of nonadditively expressed genes in stress-related pathways were commonly observed in Arabidopsis and other allopolyploids such as wheat and cotton, which may suggest a role for stress-mediated growth vigor in hybrids and allopolyploids.
Introduction
Polyploidy (whole genome duplication) is common in many plants and some animals [1], [2], [3]. The polyploid plants may represent over 70% of angiosperms [4], [5], and >75% of which are allopolyploids [1], [6], [7]. Most important crops have a polyploidy origin. Wheat, cotton and canola are allopolyploid that consist of two or more divergent genomes [3], and some plants and animals exist as interspecific hybrids [8], [9]. The common occurrence of plant polyploids indicates an advantage of being allopolyploids in response to selection and adaptation [6], [10], [11], [12]. Stable allopolyploids with meiotic transmission of homoeologous genomes lead to permanent fixation of heteozygosity and hybrid vigor.
Stable Arabidopsis allotetraploids (Arabidopsis suecica-like) are resynthesized by crossing tetraploid Arabidopsis thaliana with Arabidopsis arenosa [13]. The resynthesized A. suecica allotetraploids show morphological and physiological differences from their progenitors [13], [14], [15]. Microarray analysis of gene expression indicated that 5–38% of the genes are nonadditively expressed (different from mid-parent value, MPV) in resynthesized allotetraploids [14]. Nonadditive expression suggests activation or repression of a gene through genetic and epigenetic mechanisms [16], [17], [18]. Gene activation or silencing in allotetraploids can be caused by transcriptional regulation through changes in chromatin structure. However, many expression assays including microarrays and RNA sequencing measure the steady levels of mRNA transcripts. It is unknown whether mRNA stability affects nonadditive expression of genes between allotetraploids and their progenitors, A. thaliana and A. arenosa.
Posttranscriptional regulation of mRNA plays an important role in gene expression through modulation of mRNA stability and turnover. For example, c-myc and c-fos transcripts in mammalian cells and mating-type transcripts in yeast are unstable [19], [20], [21]. The decay rate of mRNA is correlated with biological functions of the genes and the length of cell cycles in mammals and yeast [22], [23], [24]. There is a role for mRNA stability in shaping the kinetics of the transcriptome in response to environmental changes in yeast and mammals [25], [26]. Approximately 50% of stress responsive genes in human cells are controlled at the level of mRNA decay [27]. In yeast, mRNA turnover is a major mediator in the response to heat shock, nutrition deprivation, oxidative stress, and osmotic stress [22], [28], [29].
Genome-wide analysis of mRNA decay was studied in Arabidopsis [30], [31]. It is shown approximately 1% of Arabidopsis thaliana genes with unstable transcripts (AtGUTs) [30]. These AtGUTs include the genes that are induced by mechanical stimulation and circadian rhythms. Moreover, transcripts from intronless genes and microRNA target genes generally have short half-lives [31]. Unstable transcripts are also identified in photo-labile phytochrome genes [32] and auxin inducible genes [33], [34], which facilitates rapid turnover of mRNA, leading to tight and effective control of gene expression [35]. To test a role of mRNA stability in nonadditive gene expression in allotetraploids, we examined mRNA turnover rates in resynthesized A. suecica allotetraploids relative to the mid-parent value using oligo-gene microarrays [14]. The candidates of allotetraploid genes with unstable transcripts (AlloGUTs) were compared with the genes that are nonadditively expressed, as identified in a previous study [14]. We further analyzed Gene Ontology (GOSlim) classifications and compared alloGUTs with stress responsive genes in published microarray datasets. Finally, we validated expression for a subset of genes using qRT-PCR analysis. These comprehensive analyses revealed mRNA instability of the genes related to stresses and clock-mediated pathways, suggesting a role for rapid mRNA decay in regulating stress and circadian responses to growth vigor in allopolyploids.
Results
Genome-wide analysis of unstable transcripts in allotetraploids using oligo-gene microarrays
Spotted oligo-gene microarrays were used to evaluate mRNA turnover in allotetraploids relative to the MPV (Figure 1A). The 70-mer oligos were designed from annotated genes and could cross-hybridize with A. thaliana and A. arenosa genes. This may underestimate changes in allotetraploids in which transcripts from one homoeologous locus display rapid decay, whereas the transcripts from the other locus are relatively stable. After data normalization and statistical tests (see Methods), the qualified values with reproducibly normalized intensity ratios of ≥2 were used for comparative analysis of gene expression. Approximately ∼1% (208) of genes in the Arabidopsis allotetraploid (Allo733) were identified as unstable transcripts with a half-life time of less than 60 min using the same criteria as previously defined for unstable transcripts [30]. These are hereafter referred to as allotetraploid genes with unstable transcripts (AlloGUTs) (Table S1). The percentage of AlloGUTs identified in allotetraploids is consistent with ∼1% of AtGUTs identified in A. thaliana using cDNA microarrays [30]. To confirm the microarray data, a subset of 10 genes was validated using quantitative RT-PCR (qRT-PCR) analysis, and expression patterns of four AlloGUTs were determined (Figure 1B, C). The four genes are: At5g26030 (ATFC1) encoding ferrochelatase 1, At4g17500 (ERF1) encoding ethylene responsive element binding factor 1, At1g27730 (ZAT10) encoding salt tolerance zinc finger, and At4g11280 (ACS6) encoding 1-aminocyclopropane-1-carboxylic acid (ACC) synthase 6. In qRT-PCR analysis, the gene encoding translation initiation factor 4A2 (eIF4A2, At1g54270) was used as a control because its transcripts were reasonably stable and did not depredate during the time course of chemical treatments [30]. The estimated turnover rate was 24–40 minutes by qRT-PCR (Figure 1C), which was comparable to 28–47 minutes estimated from microarray data (Figure 1B).
Figure 1. Identification of unstable transcripts with a half-life time of less than 60 min in Arabidopsis allotetraploids and validation of microarray data.

(A) Experimental procedure for monitoring mRNA decay rates in Arabidopsis allotetraploids using spotted 70-mer oligo-gene microarrays. (B) qRT-PCR analysis (open bar) of half-life time of four genes with unstable transcripts identified by microarrays (hatched bar). (C) Quantification of mRNA decay rates of four genes and estimation of their half-life time.
A total of ∼208 AlloGUTs and ∼95 AtGUTs were classified into 20 GOSlim groups (Figure 2) using TAIR release 9 (November 2009) and PEDENT (http://mips.gsf.de/proj/thal/db/index.html). The proteins encoded by AlloGUTs were distributed among all GOSlim biological classifications. Compared with the proportion of the whole-genome annotated genes, AlloGUTs were overrepresented by a factor of two in the groups of cell cycle and DNA processing, transcription, regulation of metabolism and protein, and cellular communication and biogenesis of cellular component (Figure 2). In particular, the genes with unstable transcripts were enriched in four groups, namely, cell rescue, defense and virulence, interaction with environment, and systemic interaction with environment. They had significantly (2.6–3.2-fold) higher proportions of GUTs than that of all genes (dashed lines) [30] (Figure 2).
Figure 2. Gene Ontology (GOslim) classification of allotetraploid genes with unstable transcripts (AlloGUTs, black bar) relative to Arabidopsis thaliana genes with unstable transcripts (AtGUTs, gray bar).

The two unstable gene sets were analyzed using TAIR release 9.0 and the PEDANT analysis system (http://mips.gsf.de/proj/thal/db/index.html). The proportion of the GUTs in each GOslim group was divided by the proportion of all genes in the genome (100%, dashed line).
Rapid mRNA turnover and nonadditive gene expression in allotetraploids
Unstable transcripts are associated with mRNA stability and possibly steady levels of transcripts in allotetraploids. To test this, we compared the gene list of nonadditive expression identified in a previous study [14] with that of AtGUTs in A. thaliana diploid [30] and AlloGUTs in this study. Sixty-one of 208 (∼30%) AlloGUTs matched the nonadditively expressed genes in both allotetraploids (Allo733 and Allo738) (Table 1, Figure 3A). The correlation was statistically significant (degree of freedom = 1, Chi-square = 460.945, and p≤0.01) (Table S2). Hierarchical cluster analysis suggested a strong negative correlation between the expression levels of nonadditively expressed genes and mRNA decay rates of AlloGUTs (Figure 3B). The data suggest that these nonadditive expressions of the genes in the allotetraploids tested are related to rapid mRNA turnover. We also examined an enrichment of these genes in biological processes compared with the whole genome annotation. As in the nonadditively expressed genes [14], [36], the nonadditively expressed AlloGUTs were enriched 2–8 fold in GOSlim groups of stress response pathways, followed by response to abiotic or biotic stimulus, signal transduction, and transcription (Figure S1).
Table 1. List of nonadditively expressed AlloGUTs.
| Locus | Description | t1/2(min) |
| AT5G62410 | SMC2 (STRUCTURAL MAINTENANCE OF CHROMOSOMES 2) | 16.86 |
| AT3G44260 | CCR4-NOT transcription complex protein, putative | 18.81 |
| AT3G02550 | LBD41 (LOB DOMAIN-CONTAINING PROTEIN 41) | 19.45 |
| AT3G10040 | transcription factor | 20.54 |
| AT3G15210 | ATERF-4 (ETHYLENE RESPONSIVE ELEMENT BINDING FACTOR 4) | 21.72 |
| AT1G18740 | similar to unknown protein | 21.87 |
| AT2G28200 | nucleic acid binding/transcription factor/zinc ion binding | 23.28 |
| AT2G44500 | similar to unknown protein | 23.38 |
| AT1G28370 | ATERF11/ERF11 (ERF domain protein 11) | 24.06 |
| AT4G11280 | ACS6 (1-AMINOCYCLOPROPANE-1-CARBOXYLIC ACID (ACC) SYNTHASE 6) | 24.15 |
| AT4G15760 | DL3920C, FCAALL.376, MO1, MONOOXYGENASE 1 | 24.71 |
| AT5G63160 | BTB and TAZ domain protein | 25.00 |
| AT2G22880 | VQ motif-containing protein | 25.08 |
| AT2G31880 | leucine-rich repeat transmembrane protein kinase, putative | 25.08 |
| AT1G02400 | ATGA2OX6/DTA1 (GIBBERELLIN 2-OXIDASE 6) | 25.14 |
| AT4G27280 | calcium-binding EF hand family protein | 25.36 |
| AT1G72520 | lipoxygenase, putative | 25.51 |
| AT1G18300 | ARABIDOPSIS THALIANA NUDIX HYDROLASE HOMOLOG 4, ATNUDT4, | 25.56 |
| AT5G22250 | CCR4-NOT transcription complex protein, putative | 25.70 |
| AT3G15210 | ATERF-4(ETHYLENE RESPONSIVE ELEMENT BINDING FACTOR 4) | 26.04 |
| AT5G17950 | unknown protein | 26.05 |
| AT3G01830 | calmodulin-related protein, putative | 26.98 |
| AT1G68840 | RAV2 (REGULATOR OF THE ATPASE OF THE VACUOLAR MEMBRANE) | 27.68 |
| AT1G72950 | disease resistance protein (TIR-NBS class), putative | 27.98 |
| AT2G28400 | similar to unknown protein | 28.02 |
| AT2G41640 | similar to unknown protein | 28.34 |
| AT1G72430 | auxin-responsive protein-related | 28.60 |
| AT3G52450 | U-box domain-containing protein | 28.71 |
| AT1G56510 | disease resistance protein (TIR-NBS-LRR class), putative | 28.72 |
| AT3G19580 | AZF2 (ARABIDOPSIS ZINC-FINGER PROTEIN 2) | 28.96 |
| AT1G17380 | JAZ5/TIFY11A (JASMONATE-ZIM-DOMAIN PROTEIN 5) | 29.00 |
| AT2G01670 | ATNUDT17 (Arabidopsis thaliana Nudix hydrolase homolog 17) | 29.47 |
| AT5G63790 | ANAC102 (Arabidopsis NAC domain containing protein 102) | 30.14 |
| AT1G27730 | STZ (SALT TOLERANCE ZINC FINGER) | 30.20 |
| AT1G66160 | U-box domain-containing protein | 30.21 |
| AT4G18950 | ankyrin protein kinase, putative | 30.72 |
| AT5G63450 | CYP94B1 (cytochrome P450, family 94, subfamily B, polypeptide 1) | 30.85 |
| AT2G42760 | similar to unnamed protein product [Vitis vinifera] | 30.94 |
| AT2G38470 | WRKY33 (WRKY DNA-binding protein 33); transcription factor | 31.65 |
| AT1G76600 | similar to unknown protein | 31.94 |
| AT4G33050 | EDA39 (embryo sac development arrest 39); calmodulin binding | 32.48 |
| AT1G20510 | OPCL1 (OPC-8:0 COA LIGASE1); 4-coumarate-CoA ligase | 33.50 |
| AT4G17500 | ATERF-1 (ETHYLENE RESPONSIVE ELEMENT BINDING FACTOR 1) | 34.02 |
| AT5G11650 | hydrolase, alpha/beta fold family protein | 34.06 |
| AT4G08170 | inositol 1,3,4-trisphosphate 5/6-kinase family protein | 34.12 |
| AT1G27100 | similar to unknown protein | 34.26 |
| AT5G13220 | JAS1/JAZ10/TIFY9 (JASMONATE-ZIM-DOMAIN PROTEIN 10) | 34.77 |
| AT2G41410 | calmodulin, putative | 35.20 |
| AT1G44350 | ILL6 (IAA-leucine resistant (ILR)-like gene 6); metallopeptidase | 35.55 |
| AT4G24380 | hydrolase, acting on ester bonds | 36.05 |
| AT1G09940 | HEMA2; glutamyl-tRNA reductase | 36.53 |
| AT2G01180 | ATPAP1 (PHOSPHATIDIC ACID PHOSPHATASE 1) | 37.57 |
| AT3G10930 | similar to unknown protein [Arabidopsis thaliana] (TAIR:AT5G05300.1) | 37.98 |
| AT3G25780 | AOC3 (ALLENE OXIDE CYCLASE 3) | 38.15 |
| AT1G16370 | ATOCT6; carbohydrate transmembrane transporter | 38.17 |
| AT5G54170 | similar to CP5 [Arabidopsis thaliana] (TAIR:AT1G64720.1) | 38.17 |
| AT5G05600 | oxidoreductase, 2OG-Fe(II) oxygenase family protein | 39.72 |
| AT2G35460 | harpin-induced family protein/HIN1 family protein | 40.12 |
| AT3G50950 | disease resistance protein (CC-NBS-LRR class), putative | 40.73 |
| AT3G15500 | ATNAC3 (ARABIDOPSIS NAC DOMAIN CONTAINING PROTEIN 55) | 40.75 |
| AT5G26030 | FC1 (FERROCHELATASE 1); ferrochelatase | 40.95 |
Figure 3. A relationship between AlloGUTs and nonadditively expressed genes in allotetraploids (Allo733 and Allo738).
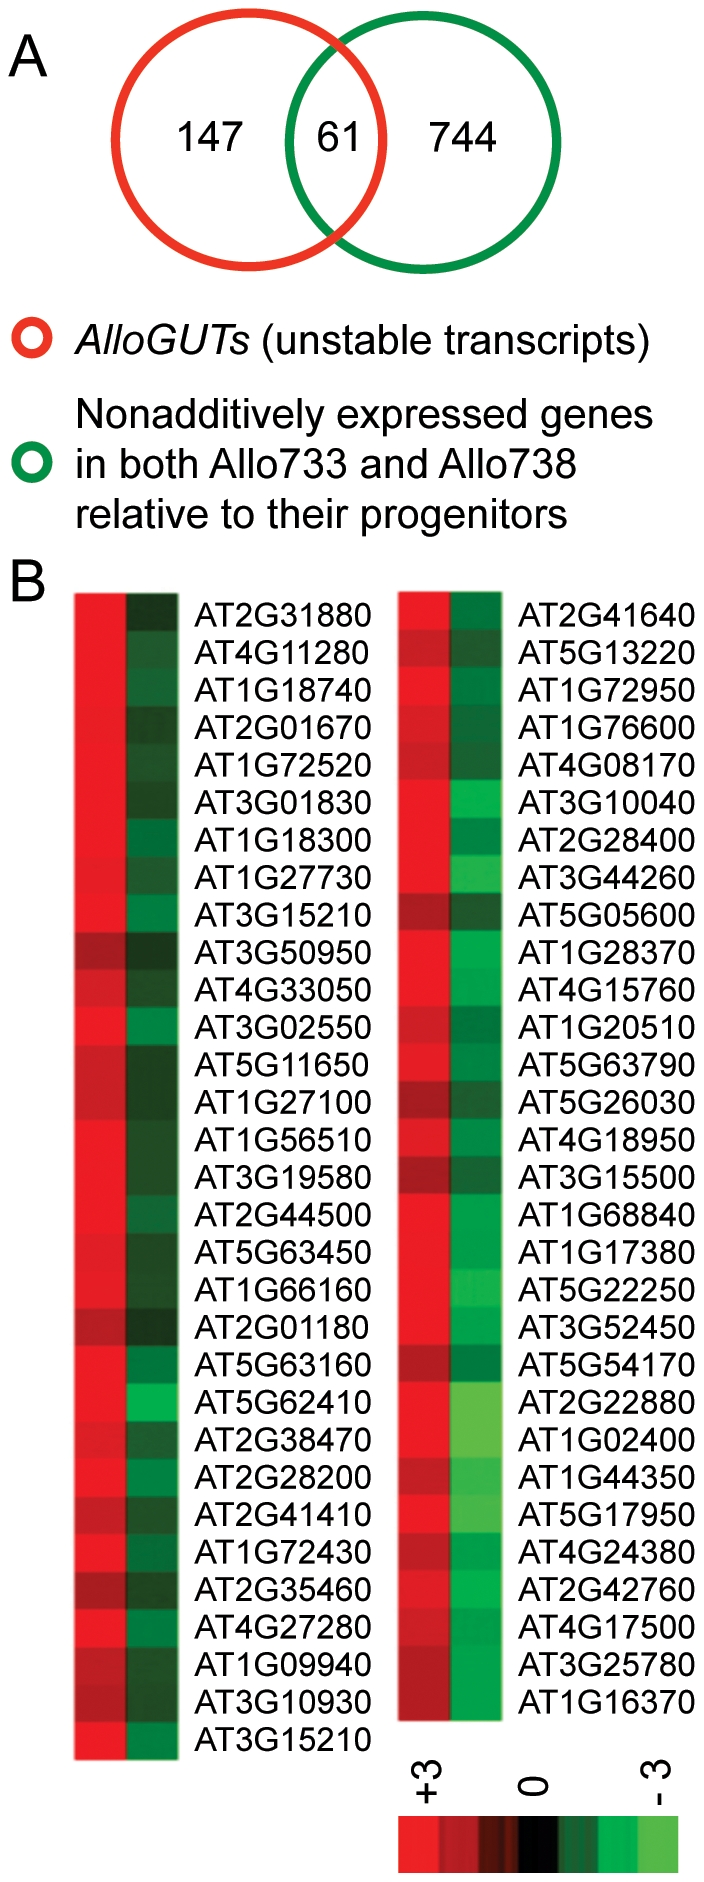
(A) Venn diagrams showing overlapping genes between AlloGUTs with half-life time less than 60 min and the common set of nonadditively expressed genes in both Allo733 and Allo738. (B) Heat map constructed from mRNA decay rates of AlloGUTs (first column, mainly red) and expression levels of nonadditively expressed genes (second column, mainly green). The bar shows relative levels of log2-fold changes (from −3 to +3).
A relationship between nonadditively expressed AlloGUTs and abiotic stress and phytohormone responses
To test how nonadditively expressed AlloGUTs are affected by physiological and environmental conditions, we performed hierarchical cluster analysis with the Genevastor program [37], [38], using the genes extracted from multiple expression datasets, including global stress [38] and response to hormones and hormone-like chemicals [37]. The comparative data analysis indicated that nonadditively expressed AlloGUTs matched the genes whose expression was highly induced by cold, drought, osmotic, oxidative, salt and wounding (Figure 4). In addition, the nonadditively expressed AlloGUTs were also highly induced by ozone stress (Figure 5) and tend to alter expression levels in response to the treatments of phytohormones and plant hormone substances, ABA and Methyl Jasmonic acid, cyclohexamide and AgNO3 (Figure S2).
Figure 4. Hierarchical cluster analysis showing the expression levels of the genes induced by stress that matched AlloGUTs in allotetraploids.

The analysis was carried out using publicly available microarray database (http://www.arabidopsis.org/portals/expression/microarray/ATGenExpress.jsp) and Genevastor. Each row represents log2 expression values of the genes in a given microarray experiment, and each column represents a gene. The color represents relative expression levels of the genes (from −3 green to +3 red).
Figure 5. Hierarchical cluster analysis showing the AlloGUTs that matched the genes whose expression is induced by ozone stress.
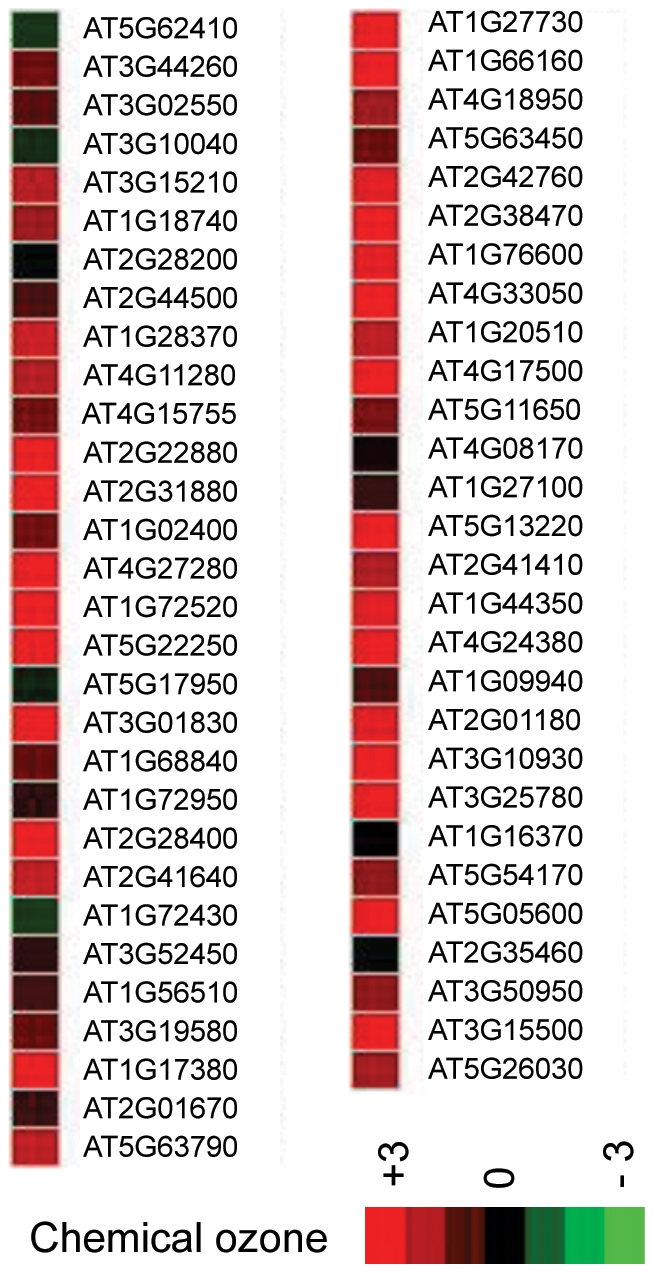
The analysis was carried out with publicly available microarray database (http://www.arabidopsis.org/portals/expression/microarray/ATGenExpress.jsp and Genevastor). Each row represents log2 expression values of the genes in a given microarray experiment, and each column represents a gene. The color represents relative expression levels of the genes (from −3 green to +3 red).
Interestingly, under normal growth conditions these stress responsive genes had a fast decay rate, and nonadditively expressed genes were down-regulated in the allotetraploids. This suggests stress-related genes are temporally repressed in allotetraploids under normal conditions and may be inducible under stress conditions.
Nonadditively expressed AlloGUTs also show a nonadditive mRNA decay rate
To test whether nonadditively expressed AlloGUTs are subjected to nonadditive mRNA decay in the allotetraploids, we measured the difference in mRNA decay rates between allotetraploids and their progenitors, A. thaliana and A. arenosa, using qRT-PCR (Figure 6). Among 61 genes tested, 14 (∼25%) of nonadditively expressed AlloGUTs were significantly more unstable than the MPV (Figure 6, Table1). The majority of 14 genes tested, except for At3g44260, had a shorter half-life time in the allotetraploid than MPV (Figure 6). According to functional classification by PEDENT, eight genes (∼57%) (At1g27730, At1g68840, At2g28200, At3g15210, At3g15500, At3g19580, At3g44260, and At4g17500) were predicted with a role in transcription. For example, AtNAC3 (At3g15500) is one of the nonadditively expressed AlloGUTs, and its expression is sensitive in response to a wide range of stresses and phytohormones. This transcript had a much shorter half-life in the allotetraploid than in the progenitors. Furthermore, hierarchical cluster analysis indicated that nonadditively expressed AlloGUTs are highly correlated with the genes in response to abiotic stress and phytohormones. The data suggest that nonadditive gene expression in the allotetraploids is associated with the nonadditive rate of mRNA decay and stress and phytohormone responses.
Figure 6. AlloGUTs showing more rapid mRNA decay in an allotetraploid (Allo738) than in the progenitors (A. thaliana 4x, At4 and A. arenosa, Aa).

The half-life time was estimated by measuring the decrease rate of AlloGUT transcript abundance relative to that of eIF4A. Open, gray, and black bars represent values in At4, Aa, and Allo738, respectively.
Different decay rates of circadian clock gene transcripts in allotetraploids
Nonadditively expressed genes in allotetraploids include those encoding circadian clock regulators, including CIRCADIAN CLOCK ASSOCIATED 1 (CCA1), LATE ELONGATED HYPOCOTYL (LHY), TIMING OF CAB EXPRESSION 1 (TOC1), and GIGANTEA (GI) [14], [39], [40], [41], [42]. The regulation of CCA1 transcripts by light and its mRNA instability play a role for accurately entraining the oscillator in response to environmental changes [43]. Indeed, we found CCA1 binding motifs and evening elements within 1000-bp upstream region of nonadditively expressed AlloGUTs. Among 14 AlloGUTs, 7 genes (50%) each contains at least one CCA1 binding site (CBS: AAAAATCT) or evening element [(AA)AATATCT] [39], [44], suggesting that these genes are likely the targets of CCA1 and LHY. We measured the stability of CCA1, LHY, TOC1, and GI mRNA in allotetraploid and its progenitors (Figure 7). Transcripts of CCA1 and LHY were relatively unstable, as previously reported [43], whereas the transcripts of their reciprocal regulators, TOC1 and GI, were relatively stable. The decay rate of CCA1 mRNA in the allotetraploid is relatively faster than MPV, and LHY mRNA decreased faster in the allotetraploid than in one of the progenitors. These two nonadditively expressed clock regulator genes also showed a nonadditive rate of mRNA decay.
Figure 7. mRNA decay rates of circadian clock genes in allotetraploids relative to their parents.

The mRNA decay rates of CCA1, LHY, TOC1, and GI were estimated by qRT-PCR. Transcript abundance was shown in At4 (filled triangle), Aa (filled square), and Allo (open circle) with fitted lines of At4 (big dashed line), Aa (thin dashed line), and Allo (solid line).
Discussion
Posttranscriptional regulation of cell cycle and stress-related genes in Arabidopsis allotetraploids
Transcriptome divergence between allotetraploids and their parents are controlled by transcriptional and/or post-transcriptional regulation [16], [18]. At the transcriptional level, chromatin modifications and DNA methylation mediate activation and silencing of homoeologous genes in allotetraploids or interspecific hybrids [14], [15], [45], [46], [47]. Changes in transcript abundance can also be regulated at the posttranscriptional level. In synthesized wheat allotetraploids, activation of retrotransposon affects the expression of neighboring genes [48]. RNA-mediated gene expression may be associated with the equilibrium between mRNA accumulation and stability during growth, development, and physiological transitions [49], [50], [51], [52], [53]. Here we provided the first evidence for mRNA instability study in nonadditive gene expression in Arabidopsis allotetraploids. Our data indicated that the genes with unstable transcripts are correlated with nonadditive levels of steady mRNAs in the allotetraploids. Therefore, a proportion of nonadditively expressed genes in the allotetraploids is caused by unstable transcripts.
The relatively small number of alloGUTs identified in the study can be due to several factors. One possibility is that unstable mRNAs have low steady state levels, which may not be detectable by microarrays. For example, circadian clock genes such as CCA1 and LHY have unstable transcripts [43] but were not identified by microarrays. Alternatively, cross-hybridization of the probes between species could be another factor that have under-estimated the number of genes with unstable transcripts. One might expect that additional GUTs will be identified using high-resolution next-generation sequencing technology (RNA-seq) [54]. Alternatively, the noise associated with quantification of mRNA stability may also account for some differences observed.
GOSlim classifications show that like AtGUTs, AlloGUTs are found in all plant cellular processes. The proportion of AlloGUTs is enriched 2-fold or more than that of all genes in several GO groups, including transcription, cell cycle and DNA processing, cellular communication, and biogenesis of cellular components. The majority of these genes are involved in cell cycle regulation and DNA metabolism, a process that requires rapid and cyclic regulation. For example, in yeast, cell cycle and mating-type genes have unstable transcripts [22], [24], [55], [56]. Significantly, AlloGUTs were enriched 3-fold more transcripts that are related to exogenous stimulus such as cell rescue, defense and virulence and interaction with the environments (Figure 2), suggesting that these genes are regulated by the rate of mRNA decay. Rapid decay of mRNA is a mechanism for fast response to environmental and external signals such as biotic and abiotic stresses [30], [31]. The data are consistent with high retention rates of duplicate genes and high expression divergence between duplicate genes than single-copy genes in the process of polyploidization [36], [57]. Nonadditive expression of stress-related genes is also overrepresented in other allopolyploids such as wheat [58], [59] and cotton [60], [61], [62]. This may also suggest that AlloGUTs are involved in these processes to facilitate faster mRNA adjustment in allotetraploids and hybrids than in diploids [21], [24], [30], [35]. During evolution, rapid mRNA turnover of the transcripts made from additional genes in allopolyploids is likely to facilitate selection and adaptation for environmental niches [6].
AlloGUTs are associated with nonadditive gene expression in allotetraploids in response to stresses and phytohormones
A significant finding is that ∼ 30% of AlloGUTs overlap with the nonadditively expressed genes in allotetraploids [14] (Figure 3A). Moreover, there is a statistically significant negative correlation between the expression levels of AlloGUTs and nonadditively expressed genes in the allotetraploids. The unstable mRNA transcripts tend to be nonadditively repressed in allopolyploids, suggesting a role of mRNA instability in nonadditive gene expression in allopolyploids. In other words, different transcriptome profiles of nonadditively regulated genes can be generated by different sensitivities of the mRNA degradation rate during allopolyploidization.
The AlloGUTs that overlap with nonadditively expressed genes are enriched 2–7-fold in GOSlim groups in response to stress, abiotic or biotic stimulus, signal transduction and transcription. There is also a 1.5-fold enrichment of the GO groups in transcription, developmental processes, other cellular processes and other metabolic processes. Compared to additively expressed AlloGUTs, nonadditively expressed AlloGUTs are significantly correlated with the genes in GOslim groups in response to cold, drought, osmotic, salt, and wounding stress. In response to environmental stimuli, an increase or decrease in mRNA abundance might be attained either by adjusting the rate of transcription or the rate of degradation, as demonstrated in many studies [25]. In addition, nonadditively expressed AlloGUTs are correlated with the genes induced by Methyl jasmonic acid and plant hormone substances, such as AgNo3, cycloheximide, and 2,3,5-triiodobenzoic acid. In cotton allopolyploids, expression ratios of AdhA homeologs vary considerably during seedling and fruit development [62]. Homeologous gene expression is altered by abiotic stress treatments, including cold, dark, and water submersion. These data collectively suggest that nonadditive gene expression and unstable transcripts provide a general mechanism in response to external signals such as biotic and abiotic stress as well as to internal signals such as phytohormones and intergenomic interactions.
Nonadditively expressed AlloGUTs also show nonadditive rate of mRNA decay in both parents. Among them, 25% of AlloGUTs have a faster decay rate in the allotetraploid than in the parents, 57% of which encode transcription factors. One gene, AtNAC3 (At3g15500), encodes one member of the NAC transcription factor family. The expression of AtNAC3 is highly induced by drought, high salinity, and abscisic acid [63]. Genome-wide analysis of AtNAC3-overexpressing transgenic plants showed a significant increase in drought tolerance, which was correlated with upregulation of several stress-inducible genes. The transgenic plants overexpressing AtNAC3 also show significantly higher survival rate (100%) under drought stress [63]. Another gene, AtERF1 (At4g1750), encodes EHTYLENE RESPONSE FACTOR1, a transcription factor, which controls the expression of pathogen responsive genes and prevents disease progression. Overexpressing AtERF1 in the transgenic plants increases resistance to pathogens [64], as well as complements defense response defects of coronative insensitive 1 (coi1) and ethylene insentive2 (ein2) mutants [65]. Interestingly, the transgenic plants overexpressing AtERF1 are significantly smaller than wild-type plants.
The above data are consistent with the observation that many stress responsive genes are generally repressed in the allotetraploids under normal conditions [14]. Allotetraploids might have developed a mechanism that requires low maintenance at the transcript level for these genes in response to environmental changes. Under stress conditions, adjusting the ratio of unstable and stable mRNA transcripts may help rapidly facilitate the proper mRNA levels in response to stress. Whether or not the regulation of stress responsive genes is correlated with increased growth vigor in allopolyploids remains to be investigated.
Circadian clock genes produce unstable transcripts in allotetraploids and their progenitors
Plants are sessile and need to prepare for and respond to all environmental changes including biotic and abiotic stresses. Recent studies suggested that 10–90% genes in Arabidopsis are governed by circadian clock regulation [40], [44], [66], [67]. CCA1 and LHY are members of a small family of single Myb domain transcription factors and have redundant but non-overlapping functions. CCA1 and LHY bind to the promoter of TOC1 and downstream genes in photosynthesis and starch metabolism [39], [44]. CCA1 expression is negatively regulated by TOC1 and CHE [42], [68]. Accurate entrainment of circadian rhythms is controlled by a combination of CCA1 transcripts level and mRNA degradation by light [43]. We found that CCA1 and LHY transcripts are unstable and show a relatively high rate of mRNA turnover. Compared to CCA1 and LHY, TOC1 and GI transcripts are relatively stable. Interestingly, these clock genes are nonadditively expressed in allotetraploids [14], [39], and their expression levels are negatively correlated with their decay rates (this study). Specifically, CCA1 and LHY mRNA has a relatively lower level of stability in the allotetraploid than in both parents. The data suggest in addition to transcriptional regulation, some circadian clock genes such as CCA1 and LHY are regulated through mRNA decay at the posttranscriptional level. Together, the available data indicate that transcriptional and posttranscriptional regulation of circadian clock genes, stress responsive genes, and many other GUTs provides a general mechanism for rapid changes in gene expression induced by “genome shock” [69] in response to interspecific hybridization and allopolyploidization. Posttranscriptional regulation of mRNA transcripts offers a unique mechanism to discriminate the transcripts between homoeologous loci in the allopolyploids. It will be interesting to investigate how these homoeologous transcripts are discriminated and degraded.
Conclusions
The current data support a role of mRNA instability in nonadditive expression of genes in Arabidopsis allopolyploids. We found ∼1% of genes with allotetraploids unstable transcripts (AlloGUTs) in Arabidopsis and a half-life time of less than 60 minutes, ∼30% of which matched the nonaddtively expressed genes that are repressed in the allotetraploids. All AlloGUTs and nonadditively repressed AlloGUTs are significantly enriched with GOSlim classifications of response to stress, environment, and phytohormones. These AlloGUTs overlap with the genes that are highly induced by abiotic stress, including cold, drought, osmotic, salt, and wounding, and plant hormones and substances, including Methyl jasmonic acid and cycloheximide. Expression of circadian clock genes such as CCA1 and LHY is controlled by transcriptional regulation as well as posttranscriptional regulation through mRNA decay. The data collectively suggest that transcriptional and posttranscriptional regulation affects expression of homoeologous genes related to stress response, light signaling, and hormone interactions in allopolyploids, which may provide a flexible and rapid response to external and internal stimuli as a consequence of polyploidization.
Materials and Methods
Plant Material and RNA sample preparation for half-life time calculation
All plants were grown under sterile conditions on plates containing 1x Murashige and Skoog salts, 1x Gamborg's vitamins and 1% sucrose for 2 weeks at 22°C. Light regime was 16-hr light and 8-hr dark in a growth chamber. Plant materials included A. thaliana autotetraploid (At4, accession no. CS3900, 2n = 4x = 20), tetraploid A. arenosa (Aa, accession no. CS3901, 2n = 4x = 32), and resynthesized A. suecica allotetraploid lines in F8 generation (Allo733 and 738, 2n = 4x = 26, accession no. CS3895-3896) [13], [14], [15]. Two-week old seedlings were used for all analyses.
The plants were incubated in a beaker containing incubation buffer for 30 min [32]. After the incubation, 3′-decoyadenosine (cordycepin) was added to a final concentration of 200 mg/ml for all seedlings. Cordycepin was used as a transcription inhibitor because it works better than other inhibitors such as Actinomycin D and it is more effectively to penetrate into leaf tissues [30], [32], [70]. Treated leaves were harvested at each time point, 0, 60, and 120 min, after inhibitor treatment, and immediately frozen in liquid nitrogen. Total RNA was isolated using Plant RNA reagent (Invitrogen, Carlsbad, CA). Each RNA sample was quantified by measuring the 260/280 ratio using Nano drop and by agarose-formaldehyde gel electrophoresis. Quantified total RNA was subjected to mRNA isolation by Micro-fast Track 2.0 mRNA isolation kit (Invitrogen). Isolated mRNA was reverse-transcribed to synthesize cDNA using Cy3- or Cy5- labelled dCTPs (Amersham Biosciences, Piscataway, NJ) that was used as probes for microarray analysis, as previously described [14].
Quantitative RT-PCR
Approximately 5 mg of total RNA treated with DNase Ι was reverse-transcribed using SuperScriptII (Invitrogen), following the manufacturer's recommendation. The synthesized cDNA was diluted 1∶5 in DEPC water and subjected to quantitative RT-PCR (qRT-PCR) analysis using SYBR Green Supermix (ABI Biosystems, Foster City, CA) in an ABI 7500 instrument (ABI Biosystems). The qRT-PCR conditions were optimized to maximize the amplification efficiency as previously described [71]. In this study, the gene eIF4A2 was used as an internal control to estimate the relative transcript level of the gene tested. The primers were provided in Table S3.
Spotted oligo-gene microarrays and data analysis
Spotted oligo-gene microarrays with 26,090 annotated genes were used for monitoring mRNA stability in allotetraploids according to the published protocol [14], [71], [72]. A total of 16 slides were used for two-time course comparisons (0 min vs. 120 min), including two biological and two technical replications. Each biological replicate consists of two dye-swaps (four slides) that were hybridized with reverse-labeled probes using one mRNA sample from the allotetraploid and another mRNA sample from a mix of RNAs from two parents (mid-parent value, MPV) (Figure 1A). For microarray hybridization, 500 ng of mRNA were used to synthesize cDNA in each labelling reaction using Cy3- or Cy5-dCTP (Amersham Biosciences, Piscataway, NJ). Probe labelling, slide hybridization, and washing were according to a published protocol [72]. After the slides were scanned using Genepix 4000B, raw data were collected using Genepix Pro4.1. The replicated data from the dye-swap of each comparison were extracted and normalized using Acuity 4.0 software (Molecular Devices, http://www.moleculardevices.com). Quantified values in each dataset were analyzed by t-test using a statistical significance level of α = 0.001. The common genes between the two datasets with reproducibly normalized intensity ratios of ≥2 were used for further analysis. The difference of the transcript abundance between each time point can be used to calculate the half-life by the equation ln (Normalized Ratio) = -k decay, with t1/2 = 0.693/k decay, since mRNA degradation generally obeys first-order kinetics, which is common in fast mRNA degradation [30], [73]. Gene Ontology (GOSlim) of AlloGUTs was classified using TAIR release (November 2009) (ftp://ftp.arabidopsis.org/home/tair/Ontologies/Gene_Ontology/ATH_GO_GOSLIM.txt) and PEDANT (http://mips.gsf.de/proj/thal/db/index.html). Clustering analysis of gene expression was performed using CLUSTER and TREEWIEW [74] (http://rana.lbl.gov/EisenSoftware.htm). Our microarray data were comparatively analyzed with the published data [14] to determine if nonadditively expressed AlloGUTs were enriched in GOSlim groups in response to stress [38], hormones [37], and circadian regulation [75]. The data were downloaded from http://www.arabidopsis.org/portals/expression/microarray/ATGenExpress.jsp. Visual display of expression profiles from multiple experiments was performed in Genevestigator [76] (https://www.genevestigator.com/gv/index.jsp).
All microarray data are MIAME compliant http://www.ncbi.nlm.nih.gov/geo/info/MIAME.html and deposited in GEO http://www.ncbi.nlm.nih.gov/geo/with the accession GSE26065.
Supporting Information
The percentages of the genes in GOSlim category that are nonadditively expressed AlloGUTs (61 genes), compared to all AlloGUTs . The ratios in the y-axis were calculated using the observed percentage of the nonadditively expressed AlloGUTs divided by the expected percentage of all annotated genes in the Arabidopsis genome. The dashed line shows the observed percentage of the genes that are AlloGUTs in a microarray experiment equal to that of the expected genes in the whole genome (100%).
(TIF)
Hierarchical cluster analysis showing AlloGUTs that matched the genes whose expression is induced by hormone and chemical treatments. The analysis was carried out with publicly available microarray database (http://www.arabidopsis.org/portals/expression/microarray/ATGenExpress.jsp and Genevastor). Each row represents a microarray experiment and each column represents a gene. The color represents the relative expression level of each experimental group (Red, up and green, down).
(TIF)
Arabidopsis allotetraploid genes with unstable transcripts ( AlloGUTs ).
(XLS)
Statistic tests for significance between microarray datasets.
(DOC)
Primer sequences used in the analysis.
(DOC)
Acknowledgments
We thank Erica Lackey for assistance of microarray hybridization and data analysis and Changqing Zhang for submission of microarray data.
Footnotes
Competing Interests: The authors have declared that no competing interests exist.
Funding: The work is supported by the grant from the National Institutes of Health (GM067015). The funders had no role in study design, data collection and analysis, decision to publish, or preparation of the manuscript.
References
- 1.Soltis PS, Soltis DE. The role of hybridization in plant speciation. Annu Rev Plant Biol. 2009;60:561–588. doi: 10.1146/annurev.arplant.043008.092039. [DOI] [PubMed] [Google Scholar]
- 2.Becak ML, Becak W. Evolution by polyploidy in Amphibia: new insights. Cytogenet Cell Genet. 1998;80:28–33. doi: 10.1159/000014952. [DOI] [PubMed] [Google Scholar]
- 3.Leitch AR, Leitch IJ. Genomic plasticity and the diversity of polyploid plants. Science. 2008;320:481–483. doi: 10.1126/science.1153585. [DOI] [PubMed] [Google Scholar]
- 4.Masterson J. Stomatal size in fossil plants: evidence for polyploidy in majority of angiosperms. Science. 1994;264:421–424. doi: 10.1126/science.264.5157.421. [DOI] [PubMed] [Google Scholar]
- 5.Wood TE, Takebayashi N, Barker MS, Mayrose I, Greenspoon PB, et al. The frequency of polyploid speciation in vascular plants. Proc Natl Acad Sci U S A. 2009;106:13875–13879. doi: 10.1073/pnas.0811575106. [DOI] [PMC free article] [PubMed] [Google Scholar]
- 6.Grant V. New York: Columbia University Press; 1981. Plant Speciation.563 [Google Scholar]
- 7.Brochmann C, Brysting AK, Alsos IG, Borgen L, Grundt HH, et al. Polyploidy in arctic plants. Biological Journal of the Linnean Society. 2004;82:521–536. [Google Scholar]
- 8.Mallet J. Hybridization as an invasion of the genome. Trends Ecol Evol. 2004;20:229–237. doi: 10.1016/j.tree.2005.02.010. [DOI] [PubMed] [Google Scholar]
- 9.Rieseberg LH, Raymond O, Rosenthal DM, Lai Z, Livingstone K, et al. Major ecological transitions in wild sunflowers facilitated by hybridization. Science. 2003;301:1211–1216. doi: 10.1126/science.1086949. [DOI] [PubMed] [Google Scholar]
- 10.Comai L. The advantages and disadvantages of being polyploid. Nature Reviews Genetics. 2005;6:836–846. doi: 10.1038/nrg1711. [DOI] [PubMed] [Google Scholar]
- 11.Chen ZJ. Molecular mechanisms of polyploidy and hybrid vigor. Trends Plant Sci. 2010;15:57–71. doi: 10.1016/j.tplants.2009.12.003. [DOI] [PMC free article] [PubMed] [Google Scholar]
- 12.Soltis DE, Soltis PS. Polyploidy: recurrent formation and genome evolution. Trends Ecol Evolu. 1999;14:348–352. doi: 10.1016/s0169-5347(99)01638-9. [DOI] [PubMed] [Google Scholar]
- 13.Comai L, Tyagi AP, Winter K, Holmes-Davis R, Reynolds SH, et al. Phenotypic instability and rapid gene silencing in newly formed Arabidopsis allotetraploids. Plant Cell. 2000;12:1551–1568. doi: 10.1105/tpc.12.9.1551. [DOI] [PMC free article] [PubMed] [Google Scholar]
- 14.Wang J, Tian L, Lee HS, Wei NE, Jiang H, et al. Genomewide nonadditive gene regulation in Arabidopsis allotetraploids. Genetics. 2006;172:507–517. doi: 10.1534/genetics.105.047894. [DOI] [PMC free article] [PubMed] [Google Scholar]
- 15.Wang J, Tian L, Madlung A, Lee HS, Chen M, et al. Stochastic and epigenetic changes of gene expression in Arabidopsis polyploids. Genetics. 2004;167:1961–1973. doi: 10.1534/genetics.104.027896. [DOI] [PMC free article] [PubMed] [Google Scholar]
- 16.Jackson S, Chen ZJ. Genomic and expression plasticity of polyploidy. Curr Opin Plant Biol. 2010;13:153–159. doi: 10.1016/j.pbi.2009.11.004. [DOI] [PMC free article] [PubMed] [Google Scholar]
- 17.Osborn TC, Pires JC, Birchler JA, Auger DL, Chen ZJ, et al. Understanding mechanisms of novel gene expression in polyploids. Trends Genet. 2003;19:141–147. doi: 10.1016/s0168-9525(03)00015-5. [DOI] [PubMed] [Google Scholar]
- 18.Chen ZJ. Genetic and epigenetic mechanisms for gene expression and phenotypic variation in plant polyploids. Annu Rev Plant Biol. 2007;58:377–406. doi: 10.1146/annurev.arplant.58.032806.103835. [DOI] [PMC free article] [PubMed] [Google Scholar]
- 19.Peltz SW, Jacobson A. MRNA stability: An trans-it. Current Opinion in Cell Biology. 1992;4:979–983. doi: 10.1016/0955-0674(92)90129-z. [DOI] [PubMed] [Google Scholar]
- 20.Chen CYA, Ezzeddine N, Shyu AB. Rna Turnover in Eukaryotes: Nucleases, Pathways and Anaylsis of Mrna Decay. San Diego: Elsevier Academic Press Inc; 2008. MESSENGER RNA HALF-LIFE MEASUREMENTS IN MAMMALIAN CELLS. pp. 335–357. [Google Scholar]
- 21.Wilson T, Treisman R. Fos C-terminal mutations block down-regulation of c-fos transcription following serum stimulation. EMBO J. 1988;7:4193–4202. doi: 10.1002/j.1460-2075.1988.tb03316.x. [DOI] [PMC free article] [PubMed] [Google Scholar]
- 22.Grigull J, Mnaimneh S, Pootoolal J, Robinson MD, Hughes TR. Genome-Wide Analysis of mRNA Stability Using Transcription Inhibitors and Microarrays Reveals Posttranscriptional Control of Ribosome Biogenesis Factors Molecular and Cellular Biology. 2004;24:5534–5547. doi: 10.1128/MCB.24.12.5534-5547.2004. [DOI] [PMC free article] [PubMed] [Google Scholar]
- 23.Yang E, van Nimwegen E, Zavolan M, Rajewsky N, Schroeder M, et al. Decay rates of human mRNAs: Correlation with functional characteristics and sequence attributes. Genome Research. 2003;13:1863–1872. doi: 10.1101/gr.1272403. [DOI] [PMC free article] [PubMed] [Google Scholar]
- 24.Wang YL, Liu CL, Storey JD, Tibshirani RJ, Herschlag D, et al. Precision and functional specificity in mRNA decay. Proceedings of the National Academy of Sciences of the United States of America. 2002;99:5860–5865. doi: 10.1073/pnas.092538799. [DOI] [PMC free article] [PubMed] [Google Scholar]
- 25.Shalem O, Dahan O, Levo M, Martinez MR, Furman I, et al. Transient transcriptional responses to stress are generated by opposing effects of mRNA production and degradation. Mol Syst Biol. 2008;4:223. doi: 10.1038/msb.2008.59. [DOI] [PMC free article] [PubMed] [Google Scholar]
- 26.Elkon R, Zlotorynski E, Zeller KI, Agami R. Major role for mRNA stability in shaping the kinetics of gene induction. BMC Genomics. 2010;11:259. doi: 10.1186/1471-2164-11-259. [DOI] [PMC free article] [PubMed] [Google Scholar]
- 27.Fan JS, Yang XL, Wang WG, Wood WH, Becker KG, et al. Global analysis of stress-regulated mRNA turnover by using cDNA arrays. Proceedings of the National Academy of Sciences of the United States of America. 2002;99:10611–10616. doi: 10.1073/pnas.162212399. [DOI] [PMC free article] [PubMed] [Google Scholar]
- 28.Garcia-Martinez J, Aranda A, Perez-Ortin JE. Genomic run-on evaluates transcription rates for all yeast genes and identifies gene regulatory mechanisms. Molecular Cell. 2004;15:303–313. doi: 10.1016/j.molcel.2004.06.004. [DOI] [PubMed] [Google Scholar]
- 30.Gutierrez RA, Ewing RM, Cherry JM, Green PJ. Identification of unstable transcripts in Arabidopsis by cDNA microarray analysis: rapid decay is associated with a group of touch- and specific clock-controlled genes. Proc Natl Acad Sci U S A. 2002;99:11513–11518. doi: 10.1073/pnas.152204099. [DOI] [PMC free article] [PubMed] [Google Scholar]
- 31.Narsai R, Howell KA, Millar AH, O'Toole N, Small I, et al. Genome-wide analysis of mRNA decay rates and their determinants in Arabidopsis thaliana. Plant Cell. 2007;19:3418–3436. doi: 10.1105/tpc.107.055046. [DOI] [PMC free article] [PubMed] [Google Scholar]
- 32.Seeley KA, Byrne DH, Colbert JT. RED LIGHT-INDEPENDENT INSTABILITY OF OAT PHYTOCHROME MESSENGER-RNA INVIVO. Plant Cell. 1992;4:29–38. doi: 10.1105/tpc.4.1.29. [DOI] [PMC free article] [PubMed] [Google Scholar]
- 33.McClure BA, Guilfoyle T. RAPID REDISTRIBUTION OF AUXIN-REGULATED RNAS DURING GRAVITROPISM. Science. 1989;243:91–93. doi: 10.1126/science.11540631. [DOI] [PubMed] [Google Scholar]
- 34.Koshiba T, Ballas N, Wong LM, Theologis A. TRANSCRIPTIONAL REGULATION OF PS-IAA4/5 AND PS-IAA6 EARLY GENE-EXPRESSION BY INDOLEACETIC-ACID AND PROTEIN-SYNTHESIS INHIBITORS IN PEA (PISUM-SATIVUM). Journal of molecular biology. 1995;253:396–413. doi: 10.1006/jmbi.1995.0562. [DOI] [PubMed] [Google Scholar]
- 35.Treisman R. TRANSIENT ACCUMULATION OF C-FOS RNA FOLLOWING SERUM STIMULATION REQUIRES A CONSERVED 5′ ELEMENT AND C-FOS 3′ SEQUENCES. Cell. 1985;42:889–902. doi: 10.1016/0092-8674(85)90285-5. [DOI] [PubMed] [Google Scholar]
- 36.Ha M, Kim ED, Chen ZJ. Duplicate genes increase expression diversity in closely related species and allopolyploids. Proc Natl Acad Sci U S A. 2009;106:2295–2300. doi: 10.1073/pnas.0807350106. [DOI] [PMC free article] [PubMed] [Google Scholar]
- 37.Goda H, Sasaki E, Akiyama K, Maruyama-Nakashita A, Nakabayashi K, et al. The AtGenExpress hormone and chemical treatment data set: experimental design, data evaluation, model data analysis and data access. Plant Journal. 2008;55:526–542. doi: 10.1111/j.0960-7412.2008.03510.x. [DOI] [PubMed] [Google Scholar]
- 38.Kilian J, Whitehead D, Horak J, Wanke D, Weinl S, et al. The AtGenExpress global stress expression data set: protocols, evaluation and model data analysis of UV-B light, drought and cold stress responses. Plant Journal. 2007;50:347–363. doi: 10.1111/j.1365-313X.2007.03052.x. [DOI] [PubMed] [Google Scholar]
- 39.Ni Z, Kim ED, Ha M, Lackey E, Liu J, et al. Altered circadian rhythms regulate growth vigour in hybrids and allopolyploids. Nature. 2009;457:327–331. doi: 10.1038/nature07523. [DOI] [PMC free article] [PubMed] [Google Scholar]
- 40.Harmer SL. The circadian system in higher plants. Annu Rev Plant Biol. 2009;60:357–377. doi: 10.1146/annurev.arplant.043008.092054. [DOI] [PubMed] [Google Scholar]
- 41.McClung CR. Plant circadian rhythms. Plant Cell. 2006;18:792–803. doi: 10.1105/tpc.106.040980. [DOI] [PMC free article] [PubMed] [Google Scholar]
- 42.Pruneda-Paz JL, Kay SA. An expanding universe of circadian networks in higher plants. Trends Plant Sci. 2010;15:259–265. doi: 10.1016/j.tplants.2010.03.003. [DOI] [PMC free article] [PubMed] [Google Scholar]
- 43.Yakir E, Hilman D, Harir Y, Green RM. Regulation of output from the plant circadian clock. Febs J. 2007;274:335–345. doi: 10.1111/j.1742-4658.2006.05616.x. [DOI] [PubMed] [Google Scholar]
- 44.Harmer SL, Hogenesch JB, Straume M, Chang HS, Han B, et al. Orchestrated transcription of key pathways in Arabidopsis by the circadian clock. Science. 2000;290:2110–2113. doi: 10.1126/science.290.5499.2110. [DOI] [PubMed] [Google Scholar]
- 45.Lee HS, Chen ZJ. Protein-coding genes are epigenetically regulated in Arabidopsis polyploids. Proc Natl Acad Sci U S A. 2001;98:6753–6758. doi: 10.1073/pnas.121064698. [DOI] [PMC free article] [PubMed] [Google Scholar]
- 46.Chen M, Ha M, Lackey E, Wang J, Chen ZJ. RNAi of met1 reduces DNA methylation and induces genome-specific changes in gene expression and centromeric small RNA accumulation in Arabidopsis allopolyploids. Genetics. 2008;178:1845–1858. doi: 10.1534/genetics.107.086272. [DOI] [PMC free article] [PubMed] [Google Scholar]
- 47.Pikaard CS. The epigenetics of nucleolar dominance. Trends Genet. 2000;16:495–500. doi: 10.1016/s0168-9525(00)02113-2. [DOI] [PubMed] [Google Scholar]
- 48.Kashkush K, Feldman M, Levy AA. Transcriptional activation of retrotransposons alters the expression of adjacent genes in wheat. Nat Genet. 2003;33:102–106. doi: 10.1038/ng1063. [DOI] [PubMed] [Google Scholar]
- 49.Grant-Downton RT, Dickinson HG. Epigenetics and its implications for plant biology 2. The ‘epigenetic epiphany’: epigenetics, evolution and beyond. Ann Bot (Lond) 2006;97:11–27. doi: 10.1093/aob/mcj001. [DOI] [PMC free article] [PubMed] [Google Scholar]
- 50.Fire A, Xu S, Montgomery MK, Kostas SA, Driver SE, et al. Potent and specific genetic interference by double-stranded RNA in Caenorhabditis elegans. Nature. 1998;391:806–811. doi: 10.1038/35888. [DOI] [PubMed] [Google Scholar]
- 51.Pal-Bhadra M, Bhadra U, Birchler JA. Cosuppression in Drosophila: gene silencing of alcohol dehydrogenase by white-Adh transgenes is Polycomb dependent. Cell. 1997;90:479–490. doi: 10.1016/s0092-8674(00)80508-5. [DOI] [PubMed] [Google Scholar]
- 52.Jorgensen R. Altered gene expression in plants due to trans interactions between homologous genes. Trends Biotechnol. 1990;8:340–344. doi: 10.1016/0167-7799(90)90220-r. [DOI] [PubMed] [Google Scholar]
- 53.Kumpatla SP, Teng W, Buchholz WG, Hall TC. Epigenetic transcriptional silencing and 5-azacytidine-mediated reactivation of a complex transgene in rice. Plant Physiol. 1997;115:361–373. doi: 10.1104/pp.115.2.361. [DOI] [PMC free article] [PubMed] [Google Scholar]
- 54.Mortazavi A, Williams BA, McCue K, Schaeffer L, Wold B. Mapping and quantifying mammalian transcriptomes by RNA-Seq. Nat Methods. 2008;5:621–628. doi: 10.1038/nmeth.1226. [DOI] [PMC free article] [PubMed] [Google Scholar]
- 55.Foat BC, Houshmandi SS, Olivas WM, Bussemaker HJ. Profiling condition-specific, genome-wide regulation of mRNA stability in yeast. Proc Natl Acad Sci U S A. 2005;102:17675–17680. doi: 10.1073/pnas.0503803102. [DOI] [PMC free article] [PubMed] [Google Scholar]
- 56.Farina L, De Santis A, Salvucci S, Morelli G, Ruberti I. Embedding mRNA stability in correlation analysis of time-series gene expression data. PLoS Comput Biol. 2008;4:e1000141. doi: 10.1371/journal.pcbi.1000141. [DOI] [PMC free article] [PubMed] [Google Scholar]
- 57.Casneuf T, De Bodt S, Raes J, Maere S, Van de Peer Y. Nonrandom divergence of gene expression following gene and genome duplications in the flowering plant Arabidopsis thaliana. Genome Biol. 2006;7:R13. doi: 10.1186/gb-2006-7-2-r13. [DOI] [PMC free article] [PubMed] [Google Scholar]
- 58.Pumphrey M, Bai J, Laudencia-Chingcuanco D, Anderson O, Gill BS. Nonadditive expression of homoeologous genes is established upon polyploidization in hexaploid wheat. Genetics. 2009;181:1147–1157. doi: 10.1534/genetics.108.096941. [DOI] [PMC free article] [PubMed] [Google Scholar]
- 59.Chague V, Just J, Mestiri I, Balzergue S, Tanguy AM, et al. Genome-wide gene expression changes in genetically stable synthetic and natural wheat allohexaploids. New Phytol. 2010;187:1181–1194. doi: 10.1111/j.1469-8137.2010.03339.x. [DOI] [PubMed] [Google Scholar]
- 60.Flagel L, Udall J, Nettleton D, Wendel J. Duplicate gene expression in allopolyploid Gossypium reveals two temporally distinct phases of expression evolution. BMC Biol. 2008;6:16. doi: 10.1186/1741-7007-6-16. [DOI] [PMC free article] [PubMed] [Google Scholar]
- 61.Hovav R, Udall JA, Chaudhary B, Rapp R, Flagel L, et al. Partitioned expression of duplicated genes during development and evolution of a single cell in a polyploid plant. Proc Natl Acad Sci U S A. 2008;105:6191–6195. doi: 10.1073/pnas.0711569105. [DOI] [PMC free article] [PubMed] [Google Scholar]
- 62.Liu Z, Adams KL. Expression partitioning between genes duplicated by polyploidy under abiotic stress and during organ development. Curr Biol. 2007;17:1669–1674. doi: 10.1016/j.cub.2007.08.030. [DOI] [PubMed] [Google Scholar]
- 63.Tran LS, Nakashima K, Sakuma Y, Simpson SD, Fujita Y, et al. Isolation and functional analysis of Arabidopsis stress-inducible NAC transcription factors that bind to a drought-responsive cis-element in the early responsive to dehydration stress 1 promoter. Plant Cell. 2004;16:2481–2498. doi: 10.1105/tpc.104.022699. [DOI] [PMC free article] [PubMed] [Google Scholar]
- 64.Berrocal-Lobo M, Segura A, Moreno M, Lopez G, Garcia-Olmedo F, et al. Snakin-2, an antimicrobial peptide from potato whose gene is locally induced by wounding and responds to pathogen infection. Plant Physiol. 2002;128:951–961. doi: 10.1104/pp.010685. [DOI] [PMC free article] [PubMed] [Google Scholar]
- 65.Lorenzo O, Piqueras R, Sanchez-Serrano JJ, Solano R. ETHYLENE RESPONSE FACTOR1 integrates signals from ethylene and jasmonate pathways in plant defense. Plant Cell. 2003;15:165–178. doi: 10.1105/tpc.007468. [DOI] [PMC free article] [PubMed] [Google Scholar]
- 66.Michael TP, Mockler TC, Breton G, McEntee C, Byer A, et al. Network discovery pipeline elucidates conserved time-of-day-specific cis-regulatory modules. PLoS Genet. 2008;4:e14. doi: 10.1371/journal.pgen.0040014. [DOI] [PMC free article] [PubMed] [Google Scholar]
- 67.Covington MF, Maloof JN, Straume M, Kay SA, Harmer SL. Global transcriptome analysis reveals circadian regulation of key pathways in plant growth and development. Genome Biol. 2008;9:R130. doi: 10.1186/gb-2008-9-8-r130. [DOI] [PMC free article] [PubMed] [Google Scholar]
- 68.Pruneda-Paz JL, Breton G, Para A, Kay SA. A functional genomics approach reveals CHE as a component of the Arabidopsis circadian clock. Science. 2009;323:1481–1485. doi: 10.1126/science.1167206. [DOI] [PMC free article] [PubMed] [Google Scholar]
- 69.McClintock B. The significance of responses of the genome to challenge. Science. 1984;226:792–801. doi: 10.1126/science.15739260. [DOI] [PubMed] [Google Scholar]
- 70.Johnson MA, Perez-Amador MA, Lidder P, Green PJ. Mutants of Arabidopsis defective in a sequence-specific mRNA degradation pathway. Proceedings of the National Academy of Sciences of the United States of America. 2000;97:13991–13996. doi: 10.1073/pnas.240354097. [DOI] [PMC free article] [PubMed] [Google Scholar]
- 71.Lee HS, Wang JL, Tian L, Jiang HM, Black MA, et al. Sensitivity of 70-mer oligonucleotides and cDNAs for microarray analysis of gene expression in Arabidopsis and its related species. Plant Biotechnology Journal. 2004;2:45–57. doi: 10.1046/j.1467-7652.2003.00048.x. [DOI] [PMC free article] [PubMed] [Google Scholar]
- 72.Tian L, Fong MP, Wang JJ, Wei NE, Jiang H, et al. Reversible histone acetylation and deacetylation mediate genome-wide, promoter-dependent and locus-specific changes in gene expression during plant development. Genetics. 2005;169:337–345. doi: 10.1534/genetics.104.033142. [DOI] [PMC free article] [PubMed] [Google Scholar]
- 73.Lam LT, Pickeral OK, Peng AC, Rosenwald A, Hurt EM, et al. Genomic-scale measurement of mRNA turnover and the mechanisms of action of the anti-cancer drug flavopiridol. Genome Biol. 2001;2:RESEARCH0041. doi: 10.1186/gb-2001-2-10-research0041. [DOI] [PMC free article] [PubMed] [Google Scholar]
- 74.Eisen MB, Spellman PT, Brown PO, Botstein D. Cluster analysis and display of genome-wide expression patterns. Proc Natl Acad Sci U S A. 1998;95:14863–14868. doi: 10.1073/pnas.95.25.14863. [DOI] [PMC free article] [PubMed] [Google Scholar]
- 75.Hazen SP, Naef F, Quisel T, Gendron JM, Chen HM, et al. Exploring the transcriptional landscape of plant circadian rhythms using genome tiling arrays. Genome Biology. 2009;10 doi: 10.1186/gb-2009-10-2-r17. [DOI] [PMC free article] [PubMed] [Google Scholar]
- 76.Zimmermann P, Laule O, Schmitz J, Hruz T, Bleuler S, et al. Genevestigator Transcriptome Meta-Analysis and Biomarker Search Using Rice and Barley Gene Expression Databases (vol 1,pg 856, 2008). Molecular Plant. 2008;1:1088–1088. doi: 10.1093/mp/ssn048. [DOI] [PubMed] [Google Scholar]
Associated Data
This section collects any data citations, data availability statements, or supplementary materials included in this article.
Supplementary Materials
The percentages of the genes in GOSlim category that are nonadditively expressed AlloGUTs (61 genes), compared to all AlloGUTs . The ratios in the y-axis were calculated using the observed percentage of the nonadditively expressed AlloGUTs divided by the expected percentage of all annotated genes in the Arabidopsis genome. The dashed line shows the observed percentage of the genes that are AlloGUTs in a microarray experiment equal to that of the expected genes in the whole genome (100%).
(TIF)
Hierarchical cluster analysis showing AlloGUTs that matched the genes whose expression is induced by hormone and chemical treatments. The analysis was carried out with publicly available microarray database (http://www.arabidopsis.org/portals/expression/microarray/ATGenExpress.jsp and Genevastor). Each row represents a microarray experiment and each column represents a gene. The color represents the relative expression level of each experimental group (Red, up and green, down).
(TIF)
Arabidopsis allotetraploid genes with unstable transcripts ( AlloGUTs ).
(XLS)
Statistic tests for significance between microarray datasets.
(DOC)
Primer sequences used in the analysis.
(DOC)