

Abstract
Bacteriophage P1 has a contractile tail that targets the conserved lipopolysaccharide on the outer membrane surface of the host for initial adsorption. The mechanism by which P1 DNA enters the host cell is not well understood, mainly because the transient molecular interactions between bacteriophage and bacteria have been difficult to study by conventional approaches. Here, we engineered tiny E. coli host cells so that the initial stages of P1-host interactions could be captured in unprecedented detail by cryo-electron tomography. Analysis of three-dimensional reconstructions of frozen-hydrated specimens revealed three predominant configurations: an extended tail stage with DNA present in the phage head, a contracted tail stage with DNA, and a contracted tail stage without DNA. Comparative analysis of various conformations indicated that there is uniform penetration of the inner tail tube into the E. coli periplasm and a significant movement of the baseplate away from the outer membrane during tail contraction.
INTRODUCTION
P1 is a temperate bacteriophage used to transfer DNA to a broad range of Gram-negative bacterial species via generalized transduction, and was instrumental in creating a fine structure genetic map of E. coli (Singer et al., 1989). It is also the source of the widely used cre-lox recombination system (Wachsman et al., 2010). P1, like phage T4, is a member of the Myoviridae. P1 has an icosahedral head encapsidating the viral genome and a contractile tail bearing six tail fibers (Yarmolinsky et al., 1988). The classic Hershey-Chase experiment demonstrated that the phage genome is delivered into the host cell while the capsid and tail remain bound to the cell surface (Hershey et al., 1952). Phage T4 has been a major model system to study the mechanisms of DNA injection (Goldberg et al., 1994). Recent cryo-electron microscopy and X-ray crystallography studies of T4 have provided many structural details of its prolate head containing highly condensed double-stranded DNA genomes (Fokine et al., 2004), the contractile tail (Aksyuk et al., 2009; Leiman et al., 2004), the baseplate (Kostyuchenko et al., 2003) and the membrane-puncturing needle (Kanamaru et al., 2002). However there is a lack of detailed understanding of phage-cell interactions during the process of DNA injection, as summarized in recent reviews (Goldberg et al., 1994; Grayson et al., 2007; Letellier et al., 2004; Molineux, 2001; Rossmann et al., 2004) (Molineux, 2006). The DNA injection mechanism of P1 phage, in particular, is poorly understood.
Electron microscopy (EM) has provided by far the best illustration of phage-cell interactions such as T4’s absorption and penetration of E. coli (Simon et al., 1967). However, this conventional EM approach relies heavily on the use of fixations, stains and sectioning, and suffers from artifacts and limited image information. The emerging technology of cryo-electron tomography (cryo-ET) has significantly enhanced the use of EM by providing three-dimensional structures of cells and subcellular complexes in their native and frozen-hydrated state at nanometer resolution (Liu et al., 2008; Liu et al., 2009; Liu et al., 2010; Lucic et al., 2005; Medalia et al., 2002). In particular, cryo-ET has been used to visualize the interaction between phage T5 and FhuA-containing liposomes (Bohm et al., 2001) and phage infection in intact cells of Prochlorococcus marinus (Liu et al., 2010). Nevertheless, the amount of extractable information from larger cells such as E. coli is unfortunately inadequate (Zhang et al., 2007), because of physical limitations in electron penetration. Until now, this has been a barrier to revisiting classic phage-cell interactions by using cryo-ET of E. coli as a model system. Here, we describe the use of tiny E. coli cells to overcome this barrier.
RESULTS and DISCUSSION
E. coli mutants that form unusually thin cells and tiny minicells
As part of a screen for suppressors of a rodZ mutant of E. coli, we isolated a mutation (A125V) in the shape-determining actin homolog mreB. On its own in a rodZ+ cell (DS612), this mutation causes a proportion of cells grown in broth to have significantly lower diameters than the mreB+ parent (Fig. 1E). Many of these cells were tapered, with a smaller diameter at one cell pole than the other. The average width of DS612 cells was 10–20% lower than that of the isogenic parent DS452, which averaged ~1 μm (Fig. 1A, E). DS612 cells from colonies on LB agar were more uniformly thin, with some cells as thin as ~0.5 μm (data not shown). The growth rate of the DS612 mutant strain was slightly lower than that of the parent strain (Fig. 1G, triangles vs squares).
Figure 1.

Size comparison of standard versus engineered tiny E. coli. Cryo-EM of a typical wild-type E. coli cell with an average diameter of ~1 μm (A), a skinny WM3433 E. coli cell with a diameter of ~0.5 μm (B–C), and a minicell from WM3433 with a diameter of less than 0.4 μm (D). Phase contrast micrographs of cells of WM3433, DS612 and the DS452 parent grown in L Broth or M9 glucose medium are shown in (E). A typical minicell is shown by cryo-EM, highlighting the range in apparent periplasmic widths in a single cell (F). Representative growth curves of DS452, DS612, and WM3433 in LB broth at 37°C are shown in (G). All three cultures were in exponential phase prior to dilution for the growth curve measurements.
We were curious if cells that were small and round might be even more useful for our studies, as the cell diameter would not be an impediment from any angle. When the Min system of E. coli is inactivated, DNA-less minicells frequently arise by cell division events at the poles. Minicells of otherwise wild-type E. coli are usually ~1 μm in diameter, the same diameter as the parent cells, which is still too large for cryo-ET. To obtain a cell population with a large proportion of smaller minicells, we inactivated the Min system in the skinny cell mutant by deleting the minCDE operon (using a Δmin::kan allele) in the mreB(A125V) mutant DS612.
The resulting cells of strain WM3433 consisted of a mixture of skinny nucleated cells and anucleate minicells. Both types of cells had small diameters similar to DS612 and were 10–20% thinner than the wild-type parent on average (Fig. 1B–E). These small diameters turned out to be ideal for cryo-ET. As with the min+ cells, the diameters of nearly all the WM3433 cells were smaller when taken from colonies grown on solid media. A majority of WM3433 cells were longer than normal, which is a property of all min mutants of E. coli and is caused by decreased cell division at the normal site at mid-cell. When compared to the wild-type parent and DS612, WM3433 exhibited a significant growth lag in liquid culture (Fig. 1G, circles) although all three strains formed colonies of equivalent size after overnight incubation on LB agar (data not shown). Despite the growth lag, P1 phage could successfully infect and lyse cultures of WM3433, and the resulting P1 lysate was competent for generalized transduction of the mreB(A125V) or Δmin::kan alleles into other recipients (see below and data not shown).
To confirm that the smaller cell diameters induced by mreB(A125V) were independent of the DS612 strain background and were not caused by unlinked suppressor mutations, we used WM1032, a min- strain derived from the wild-type MG1655 strain of E. coli, as a recipient for transfer of mreB(125V) by P1 transduction. WM3433 was used as the donor strain, which confirms that cells with the mreB(125V) mutation can support P1 phage growth. As with the DS612 derivatives, cells of the WM1032 strain carrying mreB(A125V) were uniformly thinner than those of the WM1032 parent strain (data not shown).
P1 adsorption to tiny cells
We then infected WM3433 cells with bacteriophage P1 vir at a m.o.i. of ~1 and chose three different time points after adding phage (10 min, 30 min and 120 min) for frozen-hydrated EM specimens in an attempt to capture representative stages of phage infection. The P1 particles successfully attached to both rod-shaped skinny cells (Fig. 1B) and minicells (Fig. 2A–D). Minicells could sometimes be observed with multiple phages attached (Fig. 2A, D). Despite their lack of a chromosome, minicells are known to support infection of many varieties of phages, including P1 (Reeve, 1977).
Figure 2.

3D reconstructions reveal phage P1 infecting tiny E. coli at an m.o.i of ~1 after 10–30 min of incubation. (A, B) three contracted phages and one extended phage interact with one E. coli minicell. (C) Another minicell with two contracted phages. (D) 3D surface rendering of a minicell (green) interacting with three contracted phages (red) and one extended phage (blue).
The majority of P1 particles (>95%) were attached to the cell surface, with relatively few particles (<5%) unattached. The overall structures of P1 particles are the same as those reported by conventional electron microscopy (Walker et al., 1983), with the large head size variant of P1 predominant. P1 phage tails could be classified into two general conformations: extended and contracted (Fig. 2D). In the extended stage, P1, like T4 and other members of the Myoviridae, possesses a contractile sheath that completely covers its inner tail tube. In the contracted stage, this tail tube is exposed and the tail sheath is shortened and widened, probably because of conformational rearrangements of the sheath proteins (Aksyuk et al., 2009; Kostyuchenko et al., 2005).
Measurements of extended and contracted P1 phage attached to host cells
The length of the extended tail was measured at 224.9 ± 7.1 nm (Table 1) based on 54 particles suspended in solution or closely associated with the cell outer membrane, suggesting that there is no obvious variation in this conformation. The extended tail was observed to interact with the cell envelope through long tail fibers at the end of the baseplate (Fig. 3A–D). The long tail fibers are probably responsible for the consistent distance (~53.2 nm) between the baseplate and the outer membrane (Fig. 3D, Table 1).
Table 1.
Length measurements of bacteriophage P1 from original individual reconstructions as shown in Figures 2–3.
| Length Measurements of Bacteriophage P1
| ||
|---|---|---|
| Extended w/DNA | ||
|
| ||
| Baseplate/Outer Membrane | Baseplate/Neck | |
| Average Length | 53.2 nm | 224.9 nm |
| Standard Deviation | 12.3 nm | 7.1 nm |
| Points Used | 33 | 54 |
|
| ||
| Contracted w/DNA | ||
|
| ||
| Baseplate/Outer Membrane | Baseplate/Neck | |
| Average Length | 90.4 nm | 105.7 nm |
| Standard Deviation | 9.0 nm | 5.8 nm |
| Points Used | 26 | 33 |
|
| ||
| Contracted w/o DNA | ||
|
| ||
| Baseplate/Outer Membrane | Baseplate/Neck | |
| Average Length | 91.1 nm | 100.0 nm |
| Standard Deviation | 8.3 nm | 5.9 nm |
| Points Used | 7 | 7 |
Figure 3.

Tomographic slices of extended and contracted phages. The long tail fibers initiate the interaction with the outer membrane (A–C, highlighted by white arrowheads). (D) is an enlarged view of the inset area in (C). Structures of the contracted phages are shown with (E, F) or without (G) DNA; (H) is an enlarged view of the inset area in (G). Here, the needle has not fully penetrated the cytoplasmic membrane.
P1 particles with contracted tails were also commonly attached to the cell envelope (Fig. 3E–H). They could be divided into two conformations, either containing (Fig. 3E, F) or lacking (Fig. 3G) DNA inside the capsid. Contractile sheath length (CSL) and baseplate/outer membrane distance (BP/OM) were measured for both conformations independently (Table 1). The BP/OM distance for contracted phages with DNA was 90.4 ± 9.0 nm and the CSL was 105.7 ± 5.8 nm. For contracted phages without DNA, the BP/OM distance was 91.1 ± 8.3 nm and the CSL was 100.0 ± 5.9 nm. The congruency of the contracted phages, regardless of the presence or absence of DNA inside the capsid, was consistent with the corresponding measurements derived from averaged models (Fig. 4). The length remained similar between the two conformations, suggesting that the contracted tail sheath does not undergo any further conformational changes after tail contraction. In addition, the data collected from different time points of phage-bacteria incubation (10, 30, 120 min) did not reveal any major difference in the ratio of those two conformations, suggesting that tail contraction does not always lead to DNA injection. This is consistent with the mechanism of phage T4 (Goldberg et al., 1994).
Figure 4.

Conformational changes of phage P1 during tail contraction and DNA injection. Surface views (A–C) and central slices (D–F) of three averaged structures are shown.
The P1 baseplate moves far from the cell surface upon tail contraction
Comparative analysis between extended and contracted phages provided further structural insights into the process of tail contraction and DNA injection (Fig. 4). BP/OM measurements (Table 1) show that significant baseplate movement occurred between the extended stage (BP/OM gap: 53 nm) and the contracted stage (BP/OM distance: 90 nm). Just as the tail sheath length shrank from ~225 nm in the extended stage to ~100 nm in the contracted stage, the distance between the outer membrane and the neck (OM/neck) also decreased from ~278 nm in the extended stage to ~195 nm in the contracted stage, revealing that the tail contraction brought the phage closer to the cell envelope despite the movement of the baseplate away from the outer membrane. Finally, by subtracting the OM/neck distance in the contracted stage (~195) from the length of the contractile sheath (BP/neck: ~225 nm) in extended phages, we calculated that the tail tube penetrates into the cell by approximately 30 nm, which is similar to the minimal distance between the cytoplasmic membrane and outer membrane observed for the tiny E. coli cells (Fig. 1F).
Potential role of P1 tail fibers
Our cryo-ET analysis provided direct structural evidence for the transition between the initial attachment via one tail fiber and the reoriented, “pre-contraction” stage mediated by multiple tail fibers (Fig. 3A–D). This upright “pre-contraction” conformation, in which the phage tail becomes perpendicular to the cell surface, may allow for maximal long tail fiber interaction with the cell surface. Surface-bound phages with extended sheaths maintain a constant spacing (~53 nm) between baseplate and cell surface. This implies that a uniform force or constraint, likely mediated by the kinked long tail fibers, helps to maintain this consistent distance. While tail fibers were generally observable on phages in the extended conformation, they were rarely observed on phages with contracted tails. It is not known what keeps the virion stably attached to the host cell after contraction occurs.
Our observation of only two types of tail conformations for P1, extended and contracted, are consistent with transmission EM studies of T4 and other Myoviridae (Walker et al., 1983), for which the extended sheath represents a high energy, metastable state that is poised to be triggered (Caspar, 1980). The interaction of at least three of the six T4 tail fibers with surface molecules on the outer membrane is assumed to be sufficient to induce the conformational change of the baseplate and subsequent triggering of tail sheath contraction (Crawford et al., 1980; Leiman et al., 2004).
Concluding remarks
A key finding from our studies is the significant movement of the P1 baseplate away from the cell surface during tail contraction, from ~53 nm to ~100 nm. In an early study of T4 infection (Simon et al., 1967), the baseplate of an attached T4 phage was ~10 nm from the membrane, presumably anchored to the inner core of the LPS by the tail pins (Riede, 1987) (Zorzopulos et al., 1982). More recent work using cryo-EM suggests that the baseplate is even closer (Crawford et al., 1980; Leiman et al., 2004). In contrast, P1 lacks tail pins and thus may not have an equivalent anchor. Therefore, after tail sheath contraction, the relatively short tail fibers of P1 may become fully extended, allowing the baseplate to move far from the cell surface but forcing the tail tube and head closer to the cell surface to allow the tail tube to puncture the cell envelope (Fig. 5). Consistent with this, the extent of penetration was relatively uniform among all the contracted phages with or without DNA injection.
Figure 5.
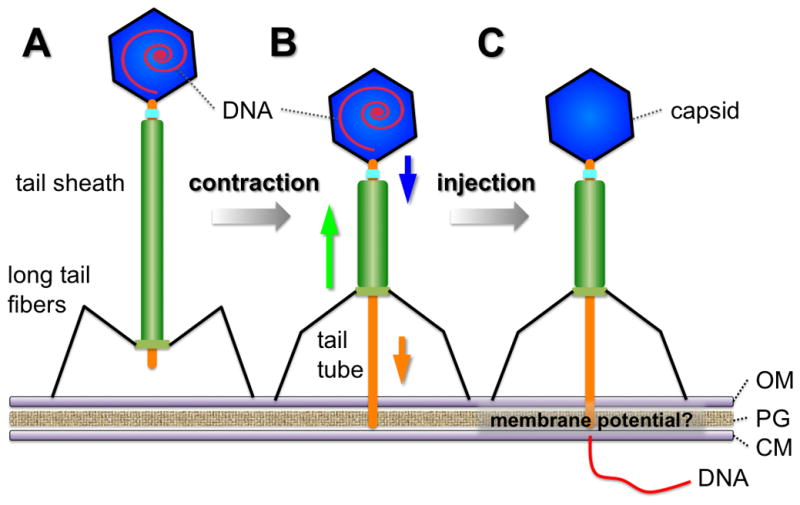
A plausible two-step DNA injection mechanism. (A) The stable attachment stage of extended P1, which is characterized by the perpendicular positioning of the phage with respect to the outer membrane and the attachment of multiple long tail fibers (left). (B) Long tail fibers trigger the tail sheath contraction and the penetration of the tail tube. The tail tube is unable to make contact with the cytoplasmic membrane. Therefore DNA remains in the head. (C) The phage successfully discharges all DNA from its head, probably controlled by a protonmotive force across the cytoplasmic membrane.
The portion of the tail tube inserted into E. coli is estimated at less than 30 nm, suggesting that it does not penetrate the cytoplasmic membrane without aid from another factor, despite the dramatic contraction of the tail sheath. Therefore our data support a mechanism in which the DNA injection into the cell cytoplasm by phage P1 is separable from tail attachment and contraction. This is consistent with what is known for phage T4 (Goldberg et al., 1994) (Furukawa et al., 1983). Long tail fibers trigger tail sheath contraction, which pulls the baseplate away from the outer membrane and pushes the inner tube toward the cytoplasmic membrane. For phage P1 and other phage with contractile tails, the high pressure of the tightly packed phage genome inside the phage capsid may play a critical role in injecting DNA into the host cytoplasm (Gelbart et al., 2009). Alternatively, differences in osmotic pressure between the cytoplasm and the surrounding medium may induce water to flush DNA out of the capsid into the host cell (Panja et al.).
For phage T4, the host membrane potential may also be important for DNA injection (Labedan et al., 1979), possibly because it helps to position the cytoplasmic membrane closer to the cell wall so the tail tube can penetrate into the cytoplasm (Furukawa et al., 1983). Additional factors thought to be important for T4 DNA injection include interactions between membrane phospholipids and the tip of the tail tube (Goldberg et al., 1994). At present, little is known about the requirements for P1 DNA injection. However, we speculate that the reason why the phage head in Fig. 3G is empty is because it induced fusion between the inner and outer membrane, which allowed injection of its DNA into the cytoplasm.
The other key finding of this study was the use of skinny or tiny E. coli cells as a proof of principle to show that superior cryo-ET data can be obtained for high-resolution studies of intact E. coli cells. Normal E. coli cells are too thick to be useful for cryo-ET, and despite the advances in tomographic methods, this has been a roadblock. The isolation and use of tiny E. coli cells was crucial for permitting the visualization of phage-host interactions with an unprecedented level of structural detail. The mreB(A125V) mutation was sufficient to reduce the width of many cells in the population. The molecular mechanism for this effect is currently under study and will be reported elsewhere; it may result from a different localization pattern of MreB spirals, which places more stringent mechanical constraints on cell width. By then knocking out the min locus in these skinny cells we were able to detect extremely small minicells that permitted phage adsorption, which were ideal for cryo-ET. E. coli is the most well studied, accessible and simple model cellular system, so our work suggests that future cryo-ET studies using these tiny cells and improved derivatives will help to elucidate finer structural details of other fundamental cellular processes.
MATERIALS AND METHODS
Isolation and engineering of skinny or tiny E. coli strains
E. coli K12 strain DS612 (BW25113 ΔyhdE::cat mreB-A125V) was used as the source of skinny cells. The parent strain (BW25113 ΔyhdE::cat) was DS452. The A125V mutant of mreB was isolated as a suppressor of a mutation in rodZ, a gene important for rod shape in E. coli (Shiomi et al., 2008) (Bendezu et al., 2009). Cells lacking rodZ are round, and the A125V mutation in mreB compensates for this shape defect in rodZ mutants, making the cells rod-shaped (D. Shiomi D. and H. Niki, unpublished data). When introduced into a rodZ+ cell, the A125V mutant of mreB confers a skinny cell phenotype (Fig. 1). These cells were then made min- by introduction of a kanamycin cassette replacing the minCDE locus. This cassette, originally in WM1032 (Sun et al., 2001), was transferred to DS612 by P1 transduction and selecting for KnR. The resulting double mutant strain, WM3433, made skinny cells and tiny minicells at high frequency, particularly at low growth rates. To ensure this phenotype is caused by the mreB(A125V) mutation, it was cotransduced along with ΔyhdE::cat into WM1032, selecting for CmR. Transductants had the same properties as WM3433. In contrast, when the ΔyhdE::cat marker from the mreB+ strain DS452 was transduced into WM1032, the cell morphology was indistinguishable from the WM1032 parent.
Isolation of bacteriophage P1
To prepare bacteriophage P1, P1 vir was grown on E. coli strain WM1031 (ftsK1::cat in TX3772, a derivative of MG1655) by adsorbing phage to bacteria for 30 min in the presence of 5 mM Ca++, then shaking vigorously at 37 °C for several hours until visible lysis. The culture was then shaken with chloroform on ice for 30 min, followed by pelleting of the cell debris. The supernatant fraction was saved as the phage lysate.
Infecting tiny E. coli cells with phage
WM3433 cells were incubated on LB plates overnight at 30 °C. Cells from fresh colonies were resuspended at high density in ~30 μl of purified phage lysate at 37°C in 5 mM Ca++ to make a final m.o.i. of approximately 1. The mixtures of phage and E. coli from three different incubation time points (10 min, 30 min and 120 min) were used to prepare frozen-hydrated EM specimens on holey carbon grids. The 10 and 30 min time points were predominantly used for the images shown in this study.
Cryo-ET data collection and 3D reconstructions
Frozen-hydrated specimens were imaged at liquid nitrogen temperature using an FEI Polara electron microscope equipped with a field emission gun and a 4K×4K (16 mega pixels) CCD camera (TVIPS; GMBH, Germany). The microscope was operated at 300 kV with a magnification of 23,000X, resulting in an effective pixel size of 7.8 Å after 2×2 binning. The FEI “batch tomography” program was used to collect low dose single-axis tilt series. Each data set was collected at −9 μm defocus, with a cumulative dose of ~100 e−/Å2 distributed over 65 images covering an angular range of 128°, with an angular increment of 2°. IMOD (Kremer et al., 1996) was used to align the tilted images and generate 3D reconstructions.
Subvolume averaging of individual phage particles
219 phage particles attached to the cell envelopes were manually selected from 89 tomographic reconstructions and visually classified into three classes based on the morphologies of head and tail: DNA-filled capsid, extended tail (111); DNA-filled capsid, contracted tail (79); and DNA-emptied capsid, contracted tail (29). An initial coarse alignment of the whole phage was carried out along the long axis of the phage according to the maximum value of the cross-correlation function (CCF). The orientation of the particle was subsequently refined iteratively by 3D image analysis as described (Liu et al., 2009; Winkler et al., 2009). Structures with icosahedral heads and helical tails were apparent after multiple cycles of refinement, although no symmetry was imposed during this process. Due to the symmetry mismatch between the head and the tail, 5- and 6-fold symmetry was applied to the head and tail regions, respectively.
3D visualization
3D tomograms were visualized using IMOD (Kremer et al., 1996). UCSF Chimera (Pettersen et al., 2004) was utilized for the surface rendering of 3D averages. Reconstruction of tiny E. coli cells infected by P1 was segmented using 3D modeling software Amira (Visage Imaging). 3D segmentations of the cytoplasmic and outer membranes were manually constructed. The surface models from the extended and contracted P1 were computationally mapped back into the original tomogram.
Acknowledgments
We thank Drs. Steven J. Norris, Marc Morais, and Angel Paredes for their comments and suggestions and Melissa Reardon for help with strain constructions. This work was supported in part by Welch Foundation Grant AU-1714 and NIH grant 1R01AI087946 (to J.L.); NIH grant 1R01GM61074 to W.M.; Grant-in-Aid for Scientific Research (B) to H.N.; and a Grant-in-Aid for Young Scientists (B) to D.S. Maintenance of the Polara electron microscope facility is partially supported by the Structural Biology Center at the UT Houston Medical School.
Footnotes
Publisher's Disclaimer: This is a PDF file of an unedited manuscript that has been accepted for publication. As a service to our customers we are providing this early version of the manuscript. The manuscript will undergo copyediting, typesetting, and review of the resulting proof before it is published in its final citable form. Please note that during the production process errors may be discovered which could affect the content, and all legal disclaimers that apply to the journal pertain.
References
- Aksyuk AA, Leiman PG, Kurochkina LP, Shneider MM, Kostyuchenko VA, Mesyanzhinov VV, Rossmann MG. The tail sheath structure of bacteriophage T4: a molecular machine for infecting bacteria. EMBO J. 2009;28(7):821–829. doi: 10.1038/emboj.2009.36. [DOI] [PMC free article] [PubMed] [Google Scholar]
- Bendezu FO, Hale CA, Bernhardt TG, de Boer PA. RodZ ((YfgA) is required for proper assembly of the MreB actin cytoskeleton and cell shape in E. coli. EMBO J. 2009;28:193–204. doi: 10.1038/emboj.2008.264. [DOI] [PMC free article] [PubMed] [Google Scholar]
- Bohm J, Lambert O, Frangakis AS, Letellier L, Baumeister W, Rigaud JL. FhuA-mediated phage genome transfer into liposomes: a cryo-electron tomography study. Curr Biol. 2001;11(15):1168–1175. doi: 10.1016/s0960-9822(01)00349-9. [DOI] [PubMed] [Google Scholar]
- Caspar DL. Movement and self-control in protein assemblies. Quasi-equivalence revisited. Biophys J. 1980;32(1):103–138. doi: 10.1016/S0006-3495(80)84929-0. [DOI] [PMC free article] [PubMed] [Google Scholar]
- Crawford JT, Goldberg EB. The function of tail fibers in triggering baseplate expansion of bacteriophage T4. J Mol Biol. 1980;139(4):679–690. doi: 10.1016/0022-2836(80)90054-6. [DOI] [PubMed] [Google Scholar]
- Fokine A, Chipman PR, Leiman PG, Mesyanzhinov VV, Rao VB, Rossmann MG, Eisenberg DS. Molecular architecture of the prolate head of Bacteriophage T4. Proc Natl Acad Sci U S A. 2004;101(16):6003–6008. doi: 10.1073/pnas.0400444101. [DOI] [PMC free article] [PubMed] [Google Scholar]
- Furukawa H, Kuroiwa T, Mizushima S. DNA injection during bacteriophage T4 infection of Escherichia coli. J Bacteriol. 1983;154(2):938–945. doi: 10.1128/jb.154.2.938-945.1983. [DOI] [PMC free article] [PubMed] [Google Scholar]
- Gelbart WM, Knobler CM. Virology. Pressurized viruses. Science. 2009;323(5922):1682–1683. doi: 10.1126/science.1170645. [DOI] [PubMed] [Google Scholar]
- Goldberg E, Grinius L, Letellier L. Recognition, attachment, and injection. In: Karam JD, Drake JW, editors. Molecular biology of bacteriophage T4. American Society for Microbiology; Washington, DC: 1994. [Google Scholar]
- Grayson P, Molineux IJ. Is phage DNA ‘injected’ into cells--biologists and physicists can agree. Curr Opin Microbiol. 2007;10(4):401–409. doi: 10.1016/j.mib.2007.04.004. [DOI] [PMC free article] [PubMed] [Google Scholar]
- Hershey AD, Chase M. Independent functions of viral protein and nucleic acid in growth of bacteriophage. J Gen Physiol. 1952;36(1):39–56. doi: 10.1085/jgp.36.1.39. [DOI] [PMC free article] [PubMed] [Google Scholar]
- Kanamaru S, Leiman PG, Kostyuchenko VA, Chipman PR, Mesyanzhinov VV, Arisaka F, Rossmann MG. Structure of the cell-puncturing device of bacteriophage T4. Nature. 2002;415(6871):553. doi: 10.1038/415553a. [DOI] [PubMed] [Google Scholar]
- Kostyuchenko VA, Chipman PR, Leiman PG, Arisaka F, Mesyanzhinov VV, Rossmann MG. The tail structure of bacteriophage T4 and its mechanism of contraction. Nat Struct Mol Biol. 2005;12(9):810–813. doi: 10.1038/nsmb975. [DOI] [PubMed] [Google Scholar]
- Kostyuchenko VA, Leiman PG, Chipman PR, Kanamaru S, van Raaij MJ, Arisaka F, Mesyanzhinov VV, Rossmann MG. Three-dimensional structure of bacteriophage T4 baseplate. Nat Struct Mol Biol. 2003;10(9):688–693. doi: 10.1038/nsb970. [DOI] [PubMed] [Google Scholar]
- Kremer JR, Mastronarde DN, McIntosh JR. Computer visualization of three-dimensional image data using IMOD. J Struct Biol. 1996;116(1):71–76. doi: 10.1006/jsbi.1996.0013. [DOI] [PubMed] [Google Scholar]
- Labedan B, Goldberg EB. Requirement for membrane potential in injection of phage T4 DNA. Proc Natl Acad Sci U S A. 1979;76(9):4669–4673. doi: 10.1073/pnas.76.9.4669. [DOI] [PMC free article] [PubMed] [Google Scholar]
- Leiman PG, Chipman PR, Kostyuchenko VA, Mesyanzhinov VV, Rossmann MG. Three-dimensional rearrangement of proteins in the tail of bacteriophage T4 on infection of its host. Cell. 2004;118(4):419–429. doi: 10.1016/j.cell.2004.07.022. [DOI] [PubMed] [Google Scholar]
- Letellier L, Boulanger P, Plancon L, Jacquot P, Santamaria M. Main features on tailed phage, host recognition and DNA uptake. Front Biosci. 2004;9:1228–1339. doi: 10.2741/1333. [DOI] [PubMed] [Google Scholar]
- Liu J, Bartesaghi A, Borgnia MJ, Sapiro G, Subramaniam S. Molecular architecture of native HIV-1 gp120 trimers. Nature. 2008;455(7209):109–113. doi: 10.1038/nature07159. [DOI] [PMC free article] [PubMed] [Google Scholar]
- Liu J, Lin T, Botkin DJ, McCrum E, Winkler H, Norris SJ. Intact flagellar motor of Borrelia burgdorferi revealed by cryo-electron tomography: evidence for stator ring curvature and rotor/C-ring assembly flexion. J Bacteriol. 2009;191(16):5026–5036. doi: 10.1128/JB.00340-09. [DOI] [PMC free article] [PubMed] [Google Scholar]
- Liu X, Zhang Q, Murata K, Baker ML, Sullivan MB, Fu C, Dougherty MT, Schmid MF, Osburne MS, Chisholm SW, Chiu W. Structural changes in a marine podovirus associated with release of its genome into Prochlorococcus. Nat Struct Mol Biol. 2010;17(7):830–836. doi: 10.1038/nsmb.1823. [DOI] [PMC free article] [PubMed] [Google Scholar]
- Lucic V, Forster F, Baumeister W. Structural studies by electron tomography: from cells to molecules. Annu Rev Biochem. 2005;74:833–865. doi: 10.1146/annurev.biochem.73.011303.074112. [DOI] [PubMed] [Google Scholar]
- Medalia O, Weber I, Frangakis AS, Nicastro D, Gerisch G, Baumeister W. Macromolecular architecture in eukaryotic cells visualized by cryoelectron tomography. Science. 2002;298(5596):1209–1213. doi: 10.1126/science.1076184. [DOI] [PubMed] [Google Scholar]
- Molineux IJ. No syringes please, ejection of phage T7 DNA from the virion is enzyme driven. Mol Microbiol. 2001;40(1):1–8. doi: 10.1046/j.1365-2958.2001.02357.x. [DOI] [PubMed] [Google Scholar]
- Molineux IJ. Fifty-three years since Hershey and Chase; much ado about pressure but which pressure is it? Virology. 2006;344(1):221–229. doi: 10.1016/j.virol.2005.09.014. [DOI] [PubMed] [Google Scholar]
- Panja D, Molineux IJ. Dynamics of bacteriophage genome ejection in vitro and in vivo. Phys Biol. 7(4):045006. doi: 10.1088/1478-3975/7/4/045006. [DOI] [PubMed] [Google Scholar]
- Pettersen EF, Goddard TD, Huang CC, Couch GS, Greenblatt DM, Meng EC, Ferrin TE. UCSF Chimera--a visualization system for exploratory research and analysis. J Comput Chem. 2004;25(13):1605–1612. doi: 10.1002/jcc.20084. [DOI] [PubMed] [Google Scholar]
- Reeve JN. Bacteriophage infection of minicells: a general method for identification of “in vivo” bacteriophage directed polypeptide biosynthesis. Mol Gen Genet. 1977;158(1):73–79. doi: 10.1007/BF00455121. [DOI] [PubMed] [Google Scholar]
- Riede I. Receptor specificity of the short tail fibres (gp12) of T-even type Escherichia coli phages. Mol Gen Genet. 1987;206(1):110–115. doi: 10.1007/BF00326544. [DOI] [PubMed] [Google Scholar]
- Rossmann MG, Mesyanzhinov VV, Arisaka F, Leiman PG. The bacteriophage T4 DNA injection machine. Curr Opin Struct Biol. 2004;14(2):171–180. doi: 10.1016/j.sbi.2004.02.001. [DOI] [PubMed] [Google Scholar]
- Shiomi D, Sakai M, Niki H. Determination of bacterial rod shape by a novel cytoskeletal membrane protein. EMBO J. 2008;27:3081–3091. doi: 10.1038/emboj.2008.234. [DOI] [PMC free article] [PubMed] [Google Scholar]
- Simon LD, Anderson TF. The infection of Escherichia coli by T2 and T4 bacteriophages as seen in the electron microscope. I. Attachment and penetration. Virology. 1967;32(2):279–297. doi: 10.1016/0042-6822(67)90277-2. [DOI] [PubMed] [Google Scholar]
- Singer M, Baker TA, Schnitzler G, Deischel SM, Goel M, Dove W, Jaacks KJ, Grossman AD, Erickson JW, Gross CA. A collection of strains containing genetically linked alternating antibiotic resistance elements for genetic mapping of Escherichia coli. Microbiol Rev. 1989;53(1):1–24. doi: 10.1128/mr.53.1.1-24.1989. [DOI] [PMC free article] [PubMed] [Google Scholar]
- Sun Q, Margolin W. Influence of the nucleoid on placement of FtsZ and MinE rings in Escherichia coli. J Bacteriol. 2001;183(4):1413–1422. doi: 10.1128/JB.183.4.1413-1422.2001. [DOI] [PMC free article] [PubMed] [Google Scholar]
- Wachsman G, Heidstra R. The CRE/lox system as a tool for developmental studies at the cell and tissue level. Methods Mol Biol. 2010;655:47–64. doi: 10.1007/978-1-60761-765-5_4. [DOI] [PubMed] [Google Scholar]
- Walker JT, Walker DH., Jr Coliphage P1 morphogenesis: analysis of mutants by electron microscopy. J Virol. 1983;45(3):1118–1139. doi: 10.1128/jvi.45.3.1118-1139.1983. [DOI] [PMC free article] [PubMed] [Google Scholar]
- Winkler H, Zhu P, Liu J, Ye F, Roux KH, Taylor KA. Tomographic subvolume alignment and subvolume classification applied to myosin V and SIV envelope spikes. J Struct Biol. 2009;165(2):64–77. doi: 10.1016/j.jsb.2008.10.004. [DOI] [PMC free article] [PubMed] [Google Scholar]
- Yarmolinsky MB, Sternberg N. Bacteriophage P1. In: Calendar R, editor. The Bacteriophages. 1. 2. Plenum Press; New York: 1988. [Google Scholar]
- Zhang P, Khursigara CM, Hartnell LM, Subramaniam S. Direct visualization of Escherichia coli chemotaxis receptor arrays using cryo-electron microscopy. Proc Natl Acad Sci U S A. 2007;104(10):3777–3781. doi: 10.1073/pnas.0610106104. [DOI] [PMC free article] [PubMed] [Google Scholar]
- Zorzopulos J, Delong S, Chapman V, Kozloff LM. Host receptor site for the short tail fibers of bacteriophage T4D. Virology. 1982;120(1):33–41. doi: 10.1016/0042-6822(82)90004-6. [DOI] [PubMed] [Google Scholar]