Abstract
Both NMR spectroscopy and MRI were used to investigate the dependencies of multi-component T2 and T1ρ relaxation on the anisotropy of bovine nasal cartilage (BNC). The non-negative least square (NNLS) method and the multi-exponential fitting method were used to analyze all experimental data. When the collagen fibrils in nasal cartilage were oriented at the magic angle (55°) to the magnetic field B0, both T2 and T1ρ were single components, regardless of the spin-lock field strength or the echo spacing time in the pulse sequences. When the collagen fibrils in nasal cartilage were oriented at 0° to B0, both T2 and T1ρ at a spin-lock field of 500 Hz had two components. When the spin-lock field was increased to 1000 Hz or higher, T1ρ relaxation in nasal cartilage became a single component, even when the specimen orientation was 0°. These results demonstrate that the specimen orientation must be considered for any multi-component analysis, even for nasal cartilage that is commonly considered homogenously structured. Since the rapidly and slowly relaxing components can be attributed to different portions of the water population in tissue, the ability to resolve different relaxation components could be used to quantitatively examine individual molecular components in connective tissues.
Keywords: Multi-component relaxation, anisotropy, nasal cartilage, T2, T1ρ, magic angle, spin lock, MRI, NMR
Introduction
The transverse relaxation time T2 measures the decay in phase coherence between the individual nuclear spins and is sensitive to the structure and orientation of the collagen fibrils in connective tissues (e.g., articular cartilage) in the external magnetic field B0 [1; 2]. This strong T2 anisotropy in articular cartilage is depth-dependent [2; 3], which causes the laminar appearance in MRI of articular cartilage; this is also known as the magic angle effect since the tissue laminae would disappear when the fibril orientation was set at 54.7° to B0 [3-7]. Because of its sensitivity to the fibril orientation, T2 relaxation and its anisotropy have been used to study the degradation of articular cartilage [8-11], which is the hallmark of degenerative joint diseases, such as osteoarthritis, that affect a significant portion of the adult population.
In addition to T2 relaxation, T1ρ relaxation (the spin-lattice relaxation in the rotating frame) is found to be sensitive to the proteoglycan content in osteoarthritic cartilage [12-15] because of its sensitivity to the slow motional interactions between local macromolecular environments and the confined water molecules [13; 16]. Different from the anisotropy of T2 relaxation, which can mainly be manipulated by the fibril orientation, the anisotropy of T1ρ relaxation can also be manipulated by the spin-lock technique. Consequently, T1ρ could have more uniform sensitivity toward the detection of osteoarthritis, regardless of the local fibril orientation, which is a welcome advantage over T2 in clinical diagnose using MRI [17].
Another important aspect of T2 relaxation is its multi-component characteristics in connective tissues including nasal cartilage, articular cartilage, tendon, and muscle [1; 11; 18-29]. In bulk tissues measured by NMR spectroscopy, T2 seems consistently multi-component. For example, Fullerton et al. found the T2 relaxation in bovine tendons to be bi-exponential (4 ms and 22 ms) [18], which was also confirmed in a later study [11]. In bovine articular cartilage, Henkelman et al. [1] showed that the distribution profiles of bulk T2 relaxation had at least two peaks, centered around 20 ms and 55 ms at 0°, and that the 20-ms peak largely disappeared when the tissue's orientation was about 55° to B0. In bovine nasal cartilage (BNC), Reiter et al. [26] found three T2 components (2.3 ms (6.2%), 25.2 ms (14.5%), 96.3 ms (79.3%)).
Unlike the multiple T2 components in bulk specimens, the multi-component analysis of T2 relaxation in high-resolution MRI remains highly inconsistent. One of the first studies on the issue was carried out by Keinan-Adamsky et al. [24], who noticed that the deep part of swine articular cartilage had two age-dependent T2 components (e.g., 12 ms (39%) and 45 ms (61%) for 12-month-old tissue) by MRI. A similar imaging result in both young and mature bovine nasal cartilage was recently reported by Reiter et al. that T2 had two major components in BNC [30]. However, this multi-component T2 in nasal and articular cartilage was not observed in two microscopic MRI (μMRI) work in our lab, where T2 in both types of tissue was found to be single component [11; 29]. Reiter et al. recently attempted to discover the cause of this controversy; they considered the disruption of cartilage microstructure by the freeze-thawing storage procedure [30]. Our hypothesis concerning this controversial issue of whether T2 in nasal cartilage by MRI was single or multiple component came from a different direction – the recent observation that nasal cartilage, which had been largely known as a homogeneous connective tissue [31; 32], actually had weak but measurable anisotropy in its fibril structure. The first observation on the topic, to the best of our knowledge, was a biomechanical work that noticed the mechanical modulus of the tissue to be different if the tissue was compressed from three orthogonal directions [33]. A comprehensive set of experiments in our lab [34] that measured the same bovine nasal cartilage block using μMRI, polarized light microscopy, and mechanical indentation led to the re-discovery that the collagen fibrils in nasal cartilage were anisotropically oriented.
The goal of this project was to investigate the multi-component issue of both T2 and T1ρ, with the knowledge of the collagen fibril orientation in bovine nasal cartilage. The T2 and T1ρin the specimens were measured when the tissue block was oriented at 0° and 55°. Furthermore, the influences of two additional experimental issues on the measurement of T2 and T1ρ relaxation were also studied: the influence of different echo spacing on T2 relaxation in NMR spectroscopy and the influence of different spin-lock fields on multi-components of T1ρ in both NMR spectroscopy and MRI at microscopic resolution.
Materials and Methods
Bovine nasal cartilage
Bovine tissue was obtained fresh from a local slaughterhouse. The central part of a large piece of nasal cartilage was harvested, immersed in physiological saline (154 mM NaCl in deionized water) with 1% protease inhibitor (Sigma, Missouri), and stored at -20 °C before the experiments. Before the specimen preparation, the BNC block was thawed to the room temperature and cut into 10 specimens, each approximately 3 mm × 3 mm × 8 mm. The orientations of the individual specimens with respect to the large BNC block and the animal were noted; the fibril direction in the block was perpendicular to the long dimension of the block [34].
NMR spectroscopy and microscopic MRI
NMR spectroscopic and μMRI experiments were performed at room temperature on a Bruker AVANCEII300 NMR spectrometer equipped with a 7-Tesla/89-mm vertical-bore superconducting magnet and micro-imaging accessory (Bruker Instrument, Billerica, MA). A homemade 5 mm solenoid coil was used in the NMR spectroscopy and μMRI experiments. The BNC specimens were surface-blotted dry to remove excess surface water and subsequently immersed in Fluorinert FC-77 liquid (3M, St. Paul, MN), which has similar susceptibility to tissue and low water solubility [29]. This immersion fluid produced no NMR and/or MRI signal while minimizing the influence of the magnetic susceptibility difference between the tissue and air. The first-order automatic shimming was performed before each imaging and spectroscopy experiment.
Each block was imaged when the fibril direction of the block was 0° and 55° with respect to B0 respectively. T2 imaging experiments were performed using a Carr-Purcell-Meiboom-Gill (CPMG) magnetization-prepared T2 imaging sequence [11; 29]. The echo spacing in the CPMG T2-weighting segment was 1 ms to avoid the spin-locking effect [35]. The number of echo times was 46, resulting in 46 delays from 2 to 600 ms. The T1ρ imaging sequence consisted of a T1ρ-weighting segment, which had a 90° pulse followed by a spin-lock pulse. The power of the spin-lock pulse varied from 0.5 - 2 kHz (500, 1000, 2000 Hz). The strength of the spin-lock field was calibrated by the strength of the 90° rf pulse. The lengths of the spin-lock pulses were equaled to the 46 echo times in the T2 imaging experiments. The 2D imaging parameters were consistent for all experiments: the echo time/pulse repetition = 3 ms / 2 s; the number of scans = 12; the field of view (FOV) = 4.5 mm × 4.5 mm. The imaging matrix size was 32 × 32, which yielded the transverse pixel resolution of 140 μm. The slice thickness was 1 mm. A minimum SNR of 1000 was achieved for all experiments. The typical length of a 90° rf pulse was 6.5 μs.
The bulk T2 relaxation by NMR spectroscopy was measured by the standard CPMG sequence, which was similar to that of the MRI experiments except without the 2D imaging segment. 75 data points were acquired for each of the three echo spacings (0.6 ms, 1 ms, 3 ms). The repetition time was 8 s; the number of dummy scans was 8; the number of scans was 8; and a minimum SNR of about 3000 was achieved for all experiments. The parameters of T1ρ experiments were similar to T2 experiments, while the length of spin-lock pulse was equaled to the 75 echo times in the CPMG experiments.
T2 and T1ρ relaxation analysis
To calculate both T2 and T1ρ relaxation times, the non-negative least-squares (NNLS) method [36; 37], implemented with Matlab codes (MathWorks, Natick, MA), and the multi-variable exponential fitting in KaleidaGraph (Synergy Software, Reading, PA) were used [29]. In MRI data analysis, the central region of 8 pixels by 8 pixels was averaged to improve the signal-to-noise ratio. In the NNLS analysis of the T2 and T1ρ spectrum, any T2 or T1ρ component with a value below or above two constant thresholds (1.5 ms, 250 ms) was ignored to eliminate the dependence of the fit on the experimental noise [19; 23; 38]. The use of the NNLS meant that the results in this project were calculated without a priori assumptions about the number of T2 and T1ρ components and any initial guesses of the solution.
Results
Proton intensity images
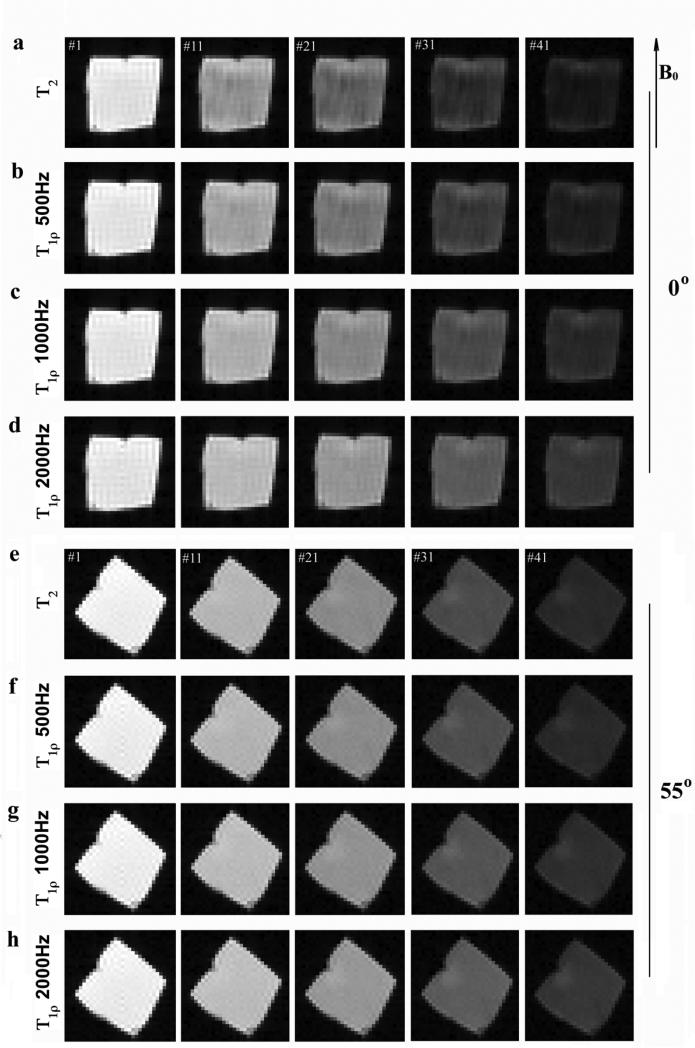
Forty-six intensity images were acquired for each specimen during each multi-component imaging experiment, each image at a different T2 or T1ρ weighting. Fig 1 shows the representative sets of BNC images at the specimen orientation of 0° (Fig 1a-d) and 55° (Fig 1e-h) with respect to B0. Two features could be identified from these intensity images. First, the tissue showed stronger anisotropy when the specimen orientation changed in the T2 and the T1ρ at low spin-lock field (500Hz) experiments (comparing Fig 1a-b and Fig e-f) – likely due to the minimization of the dipolar interaction at the magic angle. Second, T1ρ images at high spin-lock fields (1000Hz and higher) appeared considerably more uniform, especially at the magic angle.
Fig 1.
The representative proton images from MRI experiments where each specimen was imaged 46 times, each with a different T2 or T1ρ weighting. All intensity images were displayed using the same maximum (32767) and minimum (0) values on the usual gray scale. The direction of the main magnetic field was directed upwards. The fibril orientation of the specimen was in parallel with the main magnetic field in (a)-(d) and 55° to the field in (e)-(h).
T2 and T1ρ by NMR Spectroscopy and MRI
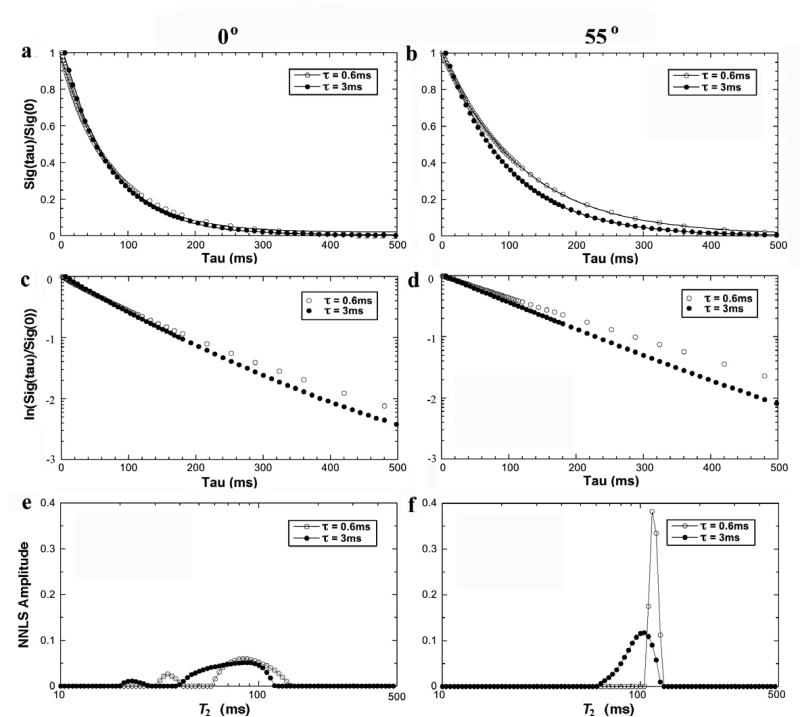
Fig 2 shows the T2 relaxation as the functions of the echo spacing (τ = 0.6ms, 3ms), both at 0° (left) and 55° (right) in NMR spectroscopy. At the 0° orientation, the signal decay at any echo spacing could not be fitted by a single exponential component (Fig 2a). In contrast, the signal decays could be fitted well by a single exponential component at the magic angle (Fig 2b). A visually convenient way of distinguishing whether the data had single or multiple components was to plot the data in the natural log scale, shown in Fig 2c-d. Multi-component analysis by the NNLS method in Fig 2e and Fig 2f clearly shows that while T2 was a single component centered at ~ 110 ms at the magic angle, two components were clearly evident at the 0° orientation, regardless of the echo spacing. In addition, while all long T2 components at 0° were consistently centered around 80-90 ms, the short T2 component at 0° depended upon the echo spacing – becoming shorter as the echo spacing became longer.
Fig 2.
The T2 results from NMR spectroscopy using different echo spacing (0.6ms, 3ms) at 0° (left) and 55° (right). (a) and (b) are the normalized signal decay in the NMR spectroscopy experiments, where the solid line in the Figure is an exponential fit with one decay-constant (i.e., one T2 component). (c) and (d) are the natural log plots of data shown in (a) and (b). (e) and (f) are the T2 distribution profiles by the NNLS calculation from the same data.
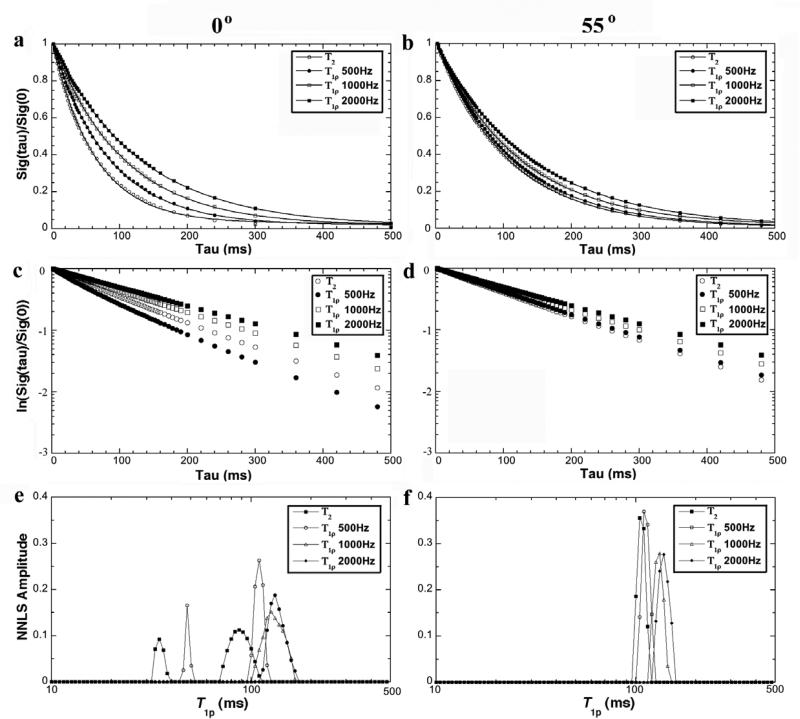
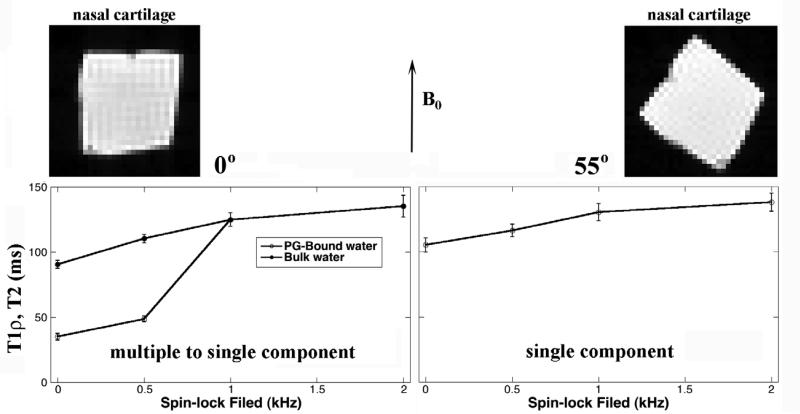
Fig 3 summarizes the results of the T1ρ relaxation times from NMR spectroscopy at different spin-lock fields (500Hz, 1000Hz, 2000Hz), together with T2 (τ = 1ms) as the reference. T1ρ at 500 Hz was very similar to the T2 characteristics in Fig 2: at the magic angle, T1ρ could be fitted with a single exponential component, while at the 0° orientation, T1ρ must be fitted with two exponential components. When the spin-lock field was 1000Hz or larger, any T1ρ relaxation could be fitted well by a single exponential component regardless of the specimen orientation in B0.
Fig 3.
The T1ρ results from NMR spectroscopy experiments at 0° (left) and 55° (right). (a) and (b) are the normalized signal decay in the NMR experiments, where the solid line in the figure is an exponential fit with one decay-constant. (c) and (d) are the natural log plots of data shown in (a) and (b). (e) and (f) are the T1ρ distribution profiles by the NNLS calculation from the same data.
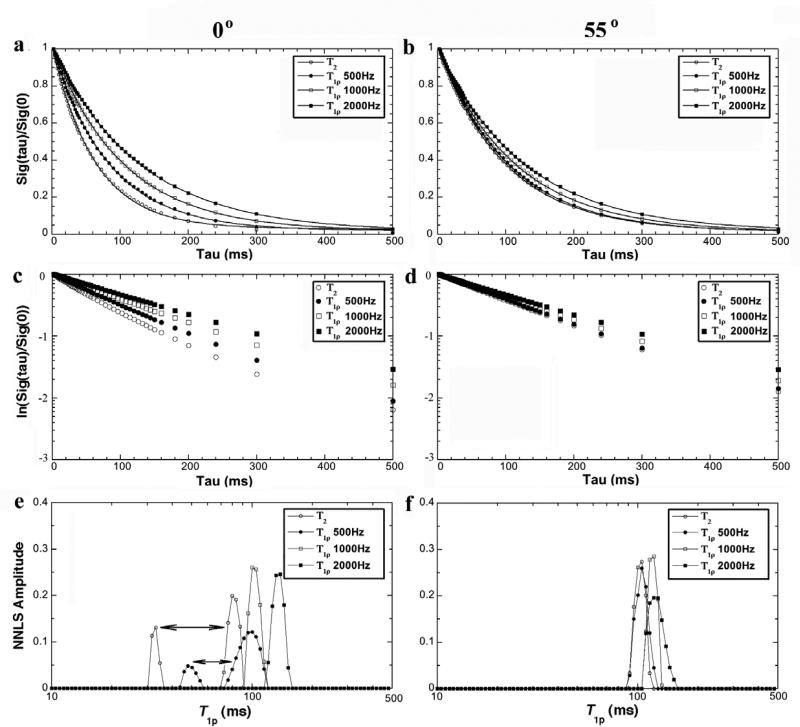
The results of T2 and T1ρ in MRI experiments were similar to the results of the NMR spectroscopy, summarized in Fig 4. Once more, T2 and T1ρ at low spin-lock fields (500Hz) had two components at 0° and became a single component at the magic angle. When the spin-lock fields were 1000Hz or higher, both T2 and T1ρ decays could be fitted well by a single-exponential component regardless of the specimen orientation in B0.
Fig 4.
The T1ρ results from MRI experiments at 0° (left) and 55° (right). (a) and (b) are the normalized signal decay in the MRI experiments, where the solid line in the figure is an exponential fit with a one decay-constant. (c) and (d) are the natural log plots of data shown in (a) and (b). (e) and (f) are the T1ρ distribution profiles by the NNLS calculation from the same data.
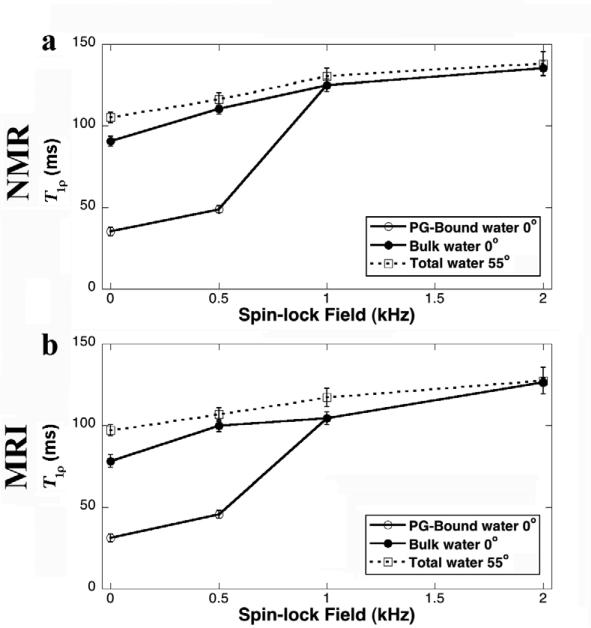
Table 1 and Table 2 summarize all calculated results of T2 and T1ρ by both NMR spectroscopy and MRI, from both the exponential fitting and NNLS methods. In the NNLS method, additional minor components occasionally appeared in the T2 and T1ρ plots. Since these additional components were small (all less than 3% in population) and not consistent (either absent or having a variable value between 1 ms and 10 ms in this group of BNC specimens), these minor components were attributed to the influence of experimental noise or sample inhomogeneity. Several features could be noted from Table 1 and Table 2. First, the average T1ρ values increased when the spin-lock field increased, with T2 (regardless of τ value) being the lowest. Second, the T2 and T1ρ values by MRI were always lower than their corresponding values by NMR spectroscopy, probably indicating the damping effect of the imaging gradients. Finally, both the exponential fitting method and the NNLS method were capable of analyzing the multi-component data from NMR spectroscopy and MRI, with little difference between the two methods. Most of these features are illustrated more clearly in Fig 5.
Table 1.
Summary of NMR spectroscopy results
| T1ρ Dispersion | Exp fit (KG) | NNLS (Matlab) | ||||||
|---|---|---|---|---|---|---|---|---|
| 0° | 55° | 0° | 55° | |||||
| T2 (ms) | % | T2 (ms) | % | T2 (ms) | % | T2 (ms) | % | |
| T2 (0.6ms) | 33.8±1.1 | 18.3±1.8 | 117.0±3.8 | 100 | 35.3±3.1 | 23.2±1.5 | 119.3±2.1 | 100 |
| 93.3±0.8 | 81.7±1.2 | 92.5±0.8 | 76.8±2.0 | |||||
| T2 (1ms) | 32.7±1.2 | 26.1±1.6 | 107.4±3.3 | 100 | 35.2±2.6 | 25.1±0.9 | 105.2±5.3 | 100 |
| 90.3±1.1 | 75.9±1.4 | 90.6±3.0 | 74.9±2.6 | |||||
| T2 (3ms) | 14.1±0.5 | 10.2±0.9 | 95.4±1.3 | 100 | 17.1±0.51 | 7.8±0.6 | 99.5±4.7 | 100 |
| 75.2±0.4 | 89.8±1.5 | 84.5±3.6 | 92.2±3.1 | |||||
| T1ρ (500Hz) | 48.1±0.8 | 22.7±1.8 | 112.1±3.7 | 100 | 48.8±2.3 | 22.4±1.8 | 116.5±4.9 | 100 |
| 109.7±2.1 | 77.3±2.5 | 110.4±3.1 | 77.6±2.4 | |||||
| T1ρ (1000Hz) | 120.4±3.9 | 100 | 123.3±6.4 | 100 | 124.9±5.1 | 100 | 130.4±6.3 | 100 |
| T1ρ (2000Hz) (2000Hz) | 138.2±7.8 | 100 | 141.8±8.2 | 100 | 135.4±8.2 | 100 | 138.0±7.1 | 100 |
Table 2.
Summary of MRI results
| T1ρ Dispersion | Exp fit (KG) | NNLS (Matlab) | ||||||
|---|---|---|---|---|---|---|---|---|
| 0° | 55° | 0° | 55° | |||||
| T2 (ms) | % | T2 (ms) | % | T2 (ms) | % | T2 (ms) | % | |
| T2 (1ms) | 27.1±1.4 | 17.9±2.6 | 100.7±2.6 | 100 | 31.3±2.5 | 19.3±0.4 | 97.1±3.4 | 100 |
| 76.9±1.7 | 82.1±2.5 | 78.2±3.8 | 80.7±1.1 | |||||
| T1ρ (500Hz) | 39.8±3.0 | 18.8±3.4 | 105.4±2.2 | 100 | 45.7±3.4 | 20.1±1.6 | 106.8±4.1 | 100 |
| 94.1±2.8 | 81.2±2.8 | 99.8±3.7 | 79.9±3.0 | |||||
| T1ρ (1000Hz) | 106.4±3.8 | 100 | 115.8±5.9 | 100 | 104.5±4.0 | 100 | 117.2±5.6 | 100 |
| T1ρ (2000Hz) | 127.6±8.1 | 100 | 128.8±7.7 | 100 | 126.6±7.7 | 100 | 127.4±8.1 | 100 |
Fig 5.
The T1ρ dispersion curves from NMR spectroscopy (a) and MRI experiments (b) at both 0° (solid lines) and 55° (dash line).
Discussions
The issue of multi-component T2 and T1ρ relaxation times in connective tissues is complicated because of a number of interdependent complications: the complex nature of the relaxation mechanisms, a variety of experimental subtleties, and the complex structures of connective tissues. In this project, several critical aspects related to the issue of multi-component T2 and T1ρ relaxation times were investigated in the context of the anisotropic structure of bovine nasal cartilage. These aspects included (1) the orientation of the BNC specimens with respect to the magnetic field B0 (0° and the magic angle); (2) the influence of different echo spacing times on T2 relaxation (from 0.6ms to 3ms); and (3) the effect of different spin-lock fields on T1ρ relaxation (from 500Hz to 2000kHz). Both NMR spectroscopy and MRI experimental methods were used in data acquisition; and both NNLS and exponential fit approaches were incorporated in data analysis. The dependency of the relaxation components on the orientation of the nasal cartilage in the magnetic field demonstrated the importance of the dipole interaction in even seemingly homogeneous nasal cartilage.
Multi-component T2 relaxation in Nasal Cartilage
Compared with the structurally heterogeneous articular cartilage, in which the tissue has three distinct depth-dependent collagen orientations across the tissue depth [2], nasal cartilage has been considered structurally homogeneous, hence being used as a transplant material in reconstructive surgery (e.g. facial and orthopaedic surgery) [31; 39] and a testing specimen in MRI and NMR experiments [11; 26; 29; 30; 40-42] where the orientation of the specimen was not specifically monitored. Our intention, to investigate the controversial multi-component issues in nasal cartilage, led to the re-discovery of the collagen anisotropy in bovine nasal cartilage [34]. The results in this project could provide an indisputable answer to the controversy of whether the T2 relaxation in nasal cartilage was single [11] or multi component [24; 26; 42], since the orientation of a BNC specimen with respect to the main magnetic field was never documented in all published reports on multi component T2 using nasal cartilage before this project.
Our results from both MRI and NMR spectroscopy show two T2 components in nasal cartilage at the 0° orientation. This two-component T2 result was stable at different echo spacings (Table 1 and Table 2). At the magic angle, however, only one T2 component could be observed in nasal cartilage, which was consistent with a recent result in our lab [11]. (Even though we did not mention the orientation of the specimens used in that earlier work, the specimen orientation was recorded during the sample harvesting.) This transition from two components (at 0°) to one component (at 55°) must come from the changing influence of dipolar interactions.
Two experimental details should be noted here. First, the measurement of multi-component T2 relaxation was very sensitive to experimental conditions and parameters [29] such as signal-to-noise ratio, echo spacing, shimming, the accuracy of 90° pulse, as well as a number of specimen details. In our project, all experimental conditions were kept identical, except the specimen orientation with respect to B0. The clear differences between 0° and 55° from the NNLS data illustrated that the multi-component features of the BNC specimens were unquestionably due to the specimen orientation in B0. Second, occasionally, there was one additional component in the NNLS calculation using the NMR spectroscopic data. This additional component was always minor (less than 3% population) and only appeared when the 0.6 ms echo spacing was used in our experiments. This experiment-parameter influence might help to explain some 3-component results in BNC by NMR spectroscopy, where the fraction of the fastest relaxing component was also small [26]. Of course, we could not rule out several other possible influences in this project on the multi-component measurement (e.g., the source of animals, different parts of the nasal cartilage structure, the storage temperatures and protocols of the tissues, the salt components and pH values of tissue storage solution, etc), which will await further investigation.
Multi-component T1ρ Relaxation in Nasal Cartilage
The dispersion characteristics of T1ρ relaxation had many similarities with that of T2 relaxation, with one additional variable in T1ρ measurement: the strength of the spin-lock field. Several features can be summarized for the T1ρ characteristics. First, T1ρ relaxation at a sufficient spin-lock field (> 1000 Hz) has only one high-value T1ρ component in both MRI and NMR spectroscopy. Second, when the spin-lock field is weak (e.g., 500Hz) and the specimen is oriented at 0°, two T1ρ components can been seen in nasal cartilage by both MRI and NMR. Third, even when T1ρ becomes one component (at 0° with high spin-lock field), its value increases slightly when the spin-lock field increases. Finally, at the magic angle, the single-component T1ρ dispersion curve increases steadily with the increase of the spin-lock field.
This transition between multi-component and single-component might become useful in the clinical MRI study of connective tissues, where the tissue environment is altered due to the degradation of the tissue, such as the loss of one of the macromolecular constituents, the proteoglycans. Although a single-component analysis is convenient and time-efficient in clinical MRI, it might be advantageous to use a spin-lock field of 500 Hz in a T1ρ experiment. This is a compromised balance between the need to reduce the influence of the dipole interaction and would result in high T1ρ values (hence, a bigger MRI signal) and the capability to differentiate the multiple molecular components, hence providing the ability to monitor the early degradation of the tissue.
Association of Multi-component Relaxation with different Molecular Populations
It is generally accepted that the more rapidly relaxing (short) component is assigned to water that is more tightly bound to macromolecules (proteoglycans and collagens), and the slowly relaxing (long) component is assigned to bulk water that is relatively loose. The fact that multi-component T2 at 55° reduces to one (long) component (~ 100 ms) implies that the macromolecule-bonded water is influenced heavily by the dipolar interaction. A tight bonding reduces the water mobility and increases the anisotropy of the water dynamics. The minimization of the dipole interaction at the magic angle helps to keep uniform the molecular environments in the tissue and to increase the relaxation time for the tightly bonded component. Note that the long (loosely bonded) component also increases its value at the magic angle.
Different T1ρ components can be similarly attributed to different portions of the water population, each portion being associated with a unique molecular environment [1; 11; 18; 29; 30; 42; 43]. When the dipole interaction is insufficiently minimized (at 0° orientation and with an insufficient spin-lock field), two T1ρ components can also be resolved, with the populations of approximately 20% for the short component and 80% for the long component. A more sufficient minimization of the dipole interaction (either at 55° or with higher spin-lock fields) can effectively null the short T1ρ component.
Conclusions
To the best of our knowledge, this is the first NMR and MRI investigation on the multi-component relaxation in nasal cartilage, with the full knowledge of the structural anisotropy of the tissue. It was found that both T2 and T1ρ could be either single component or multi-component, depending upon the tissue orientation in B0 and the strength of the spin-lock field in the T1ρ case. When the specimen was oriented at the magic angle and with sufficient spin lock field, only one component was observed in BNC for all T2 and T1ρ experiments. These results clearly demonstrate that the orientation with respect to the main magnetic field should be considered for multi-component analysis in nasal cartilage. This is a novel observation in the NMR/MRI study of cartilage and provides a satisfactory explanation that unites both single-component and multi-component relaxation studies of nasal cartilage in the literature. Furthermore, since the long and short components could be assigned to different portions of the water populations in biological tissue, the visualization of different relaxation populations could become a useful tool to examine the fractional populations of different macromolecular components, which often signal the degradation of the tissue in clinical diseases.
Research Highlights.
(Wang and Xia, 2011 manuscript on multi-component T2 and T1ρ in BNC anisotropy)
Fiber anisotropy of nasal cartilage influences multi-component T2 and T1ρ measurement
Both T2 and T1ρ have one component when nasal cartilage is at the magic angle
T2 has two components when nasal cartilage is at 0° to B0
T1ρ has two components when nasal cartilage is at 0° and with 500 Hz spin-lock field
T1ρ becomes one component at 0° and with the spin-lock field of 1000 Hz or higher
Acknowledgment
Yang Xia is grateful to the National Institutes of Health for the R01 grants (AR 045172 and AR 052353). The authors thank C Roy (Yale, MI, USA) for providing BNC tissue, Ms Carol Searight (Dept of Physics, Oakland University) and Miss Aimee Xia (University of Michigan) for editorial comments on the manuscript.
Grant Support: NIH R01 grants (AR 45172, AR 52353)
Footnotes
Publisher's Disclaimer: This is a PDF file of an unedited manuscript that has been accepted for publication. As a service to our customers we are providing this early version of the manuscript. The manuscript will undergo copyediting, typesetting, and review of the resulting proof before it is published in its final citable form. Please note that during the production process errors may be discovered which could affect the content, and all legal disclaimers that apply to the journal pertain.
References
- 1.Henkelman R, Stanisz G, Kim J, Bronskill M. Anisotropy of NMR properties of tissues. Magn. Reson. Med. 1994;32:592–601. doi: 10.1002/mrm.1910320508. [DOI] [PubMed] [Google Scholar]
- 2.Xia Y. Relaxation anisotropy in cartilage by NMR microscopy (μMRI) at 14μm resolution. Magn. Reson. Med. 1998;39:941–949. doi: 10.1002/mrm.1910390612. [DOI] [PubMed] [Google Scholar]
- 3.Xia Y, Farquhar T, Burton-Wurster N, Lust G. Origin of cartilage laminae in MRI. J. Magn. Reson. Imaging. 1997;7:887–894. doi: 10.1002/jmri.1880070518. [DOI] [PubMed] [Google Scholar]
- 4.Erickson S, Cox I, Hyde J, Carrera G, Strandt J, Estkowski L. Effect of tendon orientation on MR imaging signal intensity: a manifestation of the “magic angle” phenomenon. Radiol. 1991;181:389. doi: 10.1148/radiology.181.2.1924777. [DOI] [PubMed] [Google Scholar]
- 5.Rubenstein JD, Kim JK, Morava-Protzner I, Stanchev PL, Henkelman RM. Effects of collagen orientation on MR imaging characteristics of bovine articular cartilage. Radiol. 1993;188:219–226. doi: 10.1148/radiology.188.1.8511302. [DOI] [PubMed] [Google Scholar]
- 6.Xia Y. Magic-angle effect in magnetic resonance imaging of articular cartilage: a review. Invest. Radiol. 2000;35:602–621. doi: 10.1097/00004424-200010000-00007. [DOI] [PubMed] [Google Scholar]
- 7.Mlynarik V, Mosher T, Smith H, Dardzinski B. Magic angle effect in articular cartilage. Am. J. Roentgenol. 2002;178:1287. doi: 10.2214/ajr.178.5.1781287. [DOI] [PubMed] [Google Scholar]
- 8.Gray ML, Burstein D, Xia Y. Biochemical (and Functional) Imaging of Articular Cartilage. Semin. Musculoskelet Radiol. 2001;5:329–344. doi: 10.1055/s-2001-19043. [DOI] [PubMed] [Google Scholar]
- 9.Alhadlaq H, Xia Y, Moody JB, Matyas J. Detecting Structural Changes in Early Experimental Osteoarthritis of Tibial Cartilage by Microscopic MRI and Polarized Light Microscopy. Ann. Rheum. Dis. 2004;63:709–717. doi: 10.1136/ard.2003.011783. [DOI] [PMC free article] [PubMed] [Google Scholar]
- 10.Gold GE, Han E, Stainsby J, Wright G, Brittain J, Beaulieu C. Musculoskeletal MRI at 3.0 T: relaxation times and image contrast. Am. J. Roentgenol. 2004;183:343–51. doi: 10.2214/ajr.183.2.1830343. [DOI] [PubMed] [Google Scholar]
- 11.Zheng S, Xia Y. Multi-components of T2 relaxation in ex vivo cartilage and tendon. J. Magn. Reson. 2009;198:188–196. doi: 10.1016/j.jmr.2009.02.005. [DOI] [PMC free article] [PubMed] [Google Scholar]
- 12.Regatte RR, Akella SV, Borthakur A, Kneeland JB, Reddy R. Proteoglycan depletion-induced changes in transverse relaxation maps of cartilage: comparison of T2 and T1rho. Acad. Radiol. 2002;9:1388–94. doi: 10.1016/s1076-6332(03)80666-9. [DOI] [PubMed] [Google Scholar]
- 13.Akella S, Regatte R, Borthakur A, Kneeland J, Leigh J, Reddy R. T1rho MR Imaging of the Human Wrist in Vivo. Acad. Radiol. 2003;10:614–619. doi: 10.1016/s1076-6332(03)80079-x. [DOI] [PubMed] [Google Scholar]
- 14.Bolbos R, Link T, Benjamin Ma C, Majumdar S, Li X. T1rho relaxation time of the meniscus and its relationship with T1rho of adjacent cartilage in knees with acute ACL injuries at 3 T. Osteoarthritis Cartilage. 2009;17:12–18. doi: 10.1016/j.joca.2008.05.016. [DOI] [PMC free article] [PubMed] [Google Scholar]
- 15.Li X, Benjamin Ma C, Link TM, Castillo DD, Blumenkrantz G, Lozano J, Carballido-Gamio J, Ries M, Majumdar S. In vivo T1rho and T2 mapping of articular cartilage in osteoarthritis of the knee using 3 T MRI. Osteoarthritis Cartilage. 2007;15:789–97. doi: 10.1016/j.joca.2007.01.011. [DOI] [PMC free article] [PubMed] [Google Scholar]
- 16.Mäkelä H, Gröhn O, Kettunen M, Kauppinen R. Proton exchange as a relaxation mechanism for T1 in the rotating frame in native and immobilized protein solutions. Biochem. Biophys. Res. Commun. 2001;289:813–818. doi: 10.1006/bbrc.2001.6058. [DOI] [PubMed] [Google Scholar]
- 17.Akella S, Regatte R, Wheaton A, Borthakur A, Reddy R. Reduction of residual dipolar interaction in cartilage by spin lock technique. Magn. Reson. Med. 2004;52:1103–1109. doi: 10.1002/mrm.20241. [DOI] [PubMed] [Google Scholar]
- 18.Fullerton G, Cameron I, Ord V. Orientation of tendons in the magnetic field and its effect on T2 relaxation times. Radiol. 1985;155:433. doi: 10.1148/radiology.155.2.3983395. [DOI] [PubMed] [Google Scholar]
- 19.Peto S, Gillis P. Fiber-to-field angle dependence of proton nuclear magnetic relaxation in collagen. Magn. Reson. Imaging. 1990;8:705–712. doi: 10.1016/0730-725x(90)90005-m. [DOI] [PubMed] [Google Scholar]
- 20.Maroudas A. Different ways of expressing concentration of cartilage constituents with special reference to the tissue's organization and functional properties. Methods in Cartilage Res. 1990 [Google Scholar]
- 21.Stanisz G, Henkelman R. Diffusional anisotropy of T2 components in bovine optic nerve. Magn. Reson. Med. 1998;40:405–410. doi: 10.1002/mrm.1910400310. [DOI] [PubMed] [Google Scholar]
- 22.Prior B, Foley J, Jayaraman R, Meyer R. Pixel T2 distribution in functional magnetic resonance images of muscle. J. Appl. Physiol. 1999;87:2107. doi: 10.1152/jappl.1999.87.6.2107. [DOI] [PubMed] [Google Scholar]
- 23.Saab G, Thompson R, Marsh G. Multicomponent T2 relaxation of in vivo skeletal muscle. Magn. Reson. Med. 1999;42:150–157. doi: 10.1002/(sici)1522-2594(199907)42:1<150::aid-mrm20>3.0.co;2-5. [DOI] [PubMed] [Google Scholar]
- 24.Keinan-Adamsky K, Shinar H, Navon G. Multinuclear NMR and MRI studies of the maturation of pig articular cartilage. Magn. Reson. Med. 2006;55:532–40. doi: 10.1002/mrm.20775. [DOI] [PubMed] [Google Scholar]
- 25.Reiter DA, Lin PC, Fishbein KW, Spencer RG. Multicomponent T2 relaxation in bovine nasal cartilage; the 54th Annual Meeting of the Orthopaedic Research Society.2008. p. 1648. [Google Scholar]
- 26.Reiter D, Lin P, Fishbein K, Spencer R. Multicomponent T2 relaxation analysis in cartilage. Magn. Reson. Med. 2009;61:803–809. doi: 10.1002/mrm.21926. [DOI] [PMC free article] [PubMed] [Google Scholar]
- 27.Qin Q, Gore J, de Graaf R, Does M. Quantitative T2 measurement of a single voxel with arbitrary shape using pinwheel excitation and CPMG acquisition. Magn. Reson. Material Phys. Biol. Med. 2007;20:233–240. doi: 10.1007/s10334-007-0088-9. [DOI] [PMC free article] [PubMed] [Google Scholar]
- 28.Qian Y, Williams AA, Chu CR, Boada FE. Multicomponent T2* mapping of knee cartilage: technical feasibility ex vivo. Magn. Reson. Med. 2010;64:1426–31. doi: 10.1002/mrm.22450. [DOI] [PMC free article] [PubMed] [Google Scholar]
- 29.Zheng S, Xia Y. On the measurement of multi-component T2 relaxation in cartilage by MR spectroscopy and imaging. Magn. Reson. Imaging. 2010;28:537–545. doi: 10.1016/j.mri.2009.12.006. [DOI] [PMC free article] [PubMed] [Google Scholar]
- 30.Reiter D, Roque R, Lin P, Irrechukwu O, Doty S, Longo D, Pleshko N, Spencer R. Mapping proteoglycan bound water in cartilage: Improved specificity of matrix assessment using multiexponential transverse relaxation analysis. Magn. Reson. Med. 2011;65:377–84. doi: 10.1002/mrm.22673. [DOI] [PMC free article] [PubMed] [Google Scholar]
- 31.Glasgold MJ, Kato YP, Christiansen D, Hauge JA, Glasgold AI, Silver FH. Mechanical properties of septal cartilage homografts. Otolaryngol. Head Neck Surg. 1988;99:374–9. doi: 10.1177/019459988809900404. [DOI] [PubMed] [Google Scholar]
- 32.Grellmann W, Berghaus A, Haberland EJ, Jamali Y, Holweg K, Reincke K, Bierogel C. Determination of strength and deformation behavior of human cartilage for the definition of significant parameters. J. Biomed. Mater. Res. A. 2006;78:168–74. doi: 10.1002/jbm.a.30625. [DOI] [PubMed] [Google Scholar]
- 33.Richmon J, Sage A, Wong V, Chen A, Sah R, Watson D. Compressive biomechanical properties of human nasal septal cartilage. Am. J. Rhinol. 2006;20:496–501. doi: 10.2500/ajr.2006.20.2932. [DOI] [PubMed] [Google Scholar]
- 34.Xia Y, Zheng S, Szarko M, Lee J. Structural Anisotropies of Bovine Nasal Cartilage by μMRI, PLM, and Mechanical Compression; the 57th Conference of Orthopaedic Research Society.2011. p. 2094. [Google Scholar]
- 35.Santyr G, Henkelman R, Bronskill M. Variation in measured transverse relaxation in tissue resulting from spin locking with the CPMG sequence. J. Magn. Reson. 1988;79:28–44. [Google Scholar]
- 36.Hanson R, Lawson C. Solving least squares problems. Prentice-Hall Englewood Cliffs; NJ: 1974. [Google Scholar]
- 37.Whittall K, MacKay A. Quantitative interpretation of NMR relaxation data. J. Magn. Reson. 1989;84:134–152. [Google Scholar]
- 38.Regatte R, Akella S, Lonner J, Kneeland J, Reddy R. T1 relaxation mapping in human osteoarthritis (OA) cartilage: Comparison of T1 with T2. J. Magn. Reson. Imaging. 2006;23:547–553. doi: 10.1002/jmri.20536. [DOI] [PubMed] [Google Scholar]
- 39.Rotter N, Tobias G, Lebl M, Roy AK, Hansen MC, Vacanti CA, Bonassar LJ. Age-related changes in the composition and mechanical properties of human nasal cartilage. Arch. Biochem. Biophys. 2002;403:132–40. doi: 10.1016/S0003-9861(02)00263-1. [DOI] [PubMed] [Google Scholar]
- 40.Jelicks LA, Paul PK, O'Byrne E, Gupta RK. Hydrogen-1, Sodium-23, and Carbon-13 MR spectroscopy of cartilage degradation in vitro. J. Magn. Reson. Imaging. 1993;3:565–568. doi: 10.1002/jmri.1880030403. [DOI] [PubMed] [Google Scholar]
- 41.Zheng S, Xia Y. The impact of the relaxivity definition on the quantitative measurement of glycosaminoglycans in cartilage by the MRI dGEMRIC method. Magn. Reson. Med. 2010;63:25–32. doi: 10.1002/mrm.22169. [DOI] [PMC free article] [PubMed] [Google Scholar]
- 42.Reiter D, Peacock A, Spencer R. Effects of frozen storage and sample temperature on water compartmentation and multiexponential transverse relaxation in cartilage. Magn. Reson. Imaging. 2011 doi: 10.1016/j.mri.2010.10.011. in press. [DOI] [PMC free article] [PubMed] [Google Scholar]
- 43.Cole W, Leblanc A, Jhingran S. The origin of biexponential T2 relaxation in muscle water. Magn. Reson. Med. 1993;29:19–24. doi: 10.1002/mrm.1910290106. [DOI] [PubMed] [Google Scholar]


