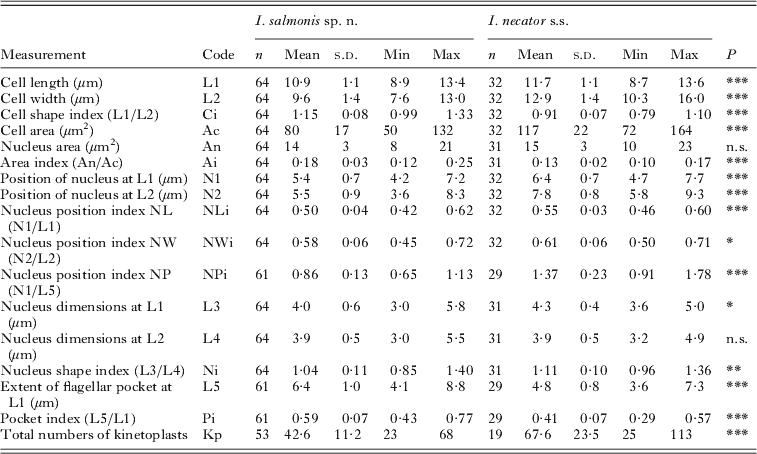
Table 4.
Comparison of the free form of Ichthyobodo salmonis sp. n. and Ichthyobodo necator s.s. (data from Isaksen et al. 2007) from Atlantic salmon (Salmo salar)

n.s., Not significant ;
P<0·05;
P<0·01;
P<0·001.
(n, Number of cells examined. Last column (P) gives the results of Student's t-tests, comparing measurements of I. salmonis and I. necator.)
