Abstract
Epigenetic regulation of gene expression, through covalent modification of histones, is a key process controlling growth and development. Accordingly, the transcription factors regulating these processes are important targets of genetic diseases. However, surprisingly little is known about the relationship between aberrant epigenetic states, the cellular process affected, and their phenotypic consequences. By chromosomal breakpoint mapping in a patient with a Noonan syndrome–like phenotype that encompassed short stature, blepharoptosis, and attention deficit hyperactivity disorder, we identified haploinsufficiency of the histone acetyltransferase gene MYST histone acetyltransferase (monocytic leukemia) 4 (MYST4), as the underlying cause of the phenotype. Using acetylation, whole genome expression, and ChIP studies in cells from the patient, cell lines in which MYST4 expression was knocked down using siRNA, and the Myst4 querkopf mouse, we found that H3 acetylation is important for neural, craniofacial, and skeletal morphogenesis, mainly through its ability to specifically regulating the MAPK signaling pathway. This finding further elucidates the complex role of histone modifications in mammalian development and adds what we believe to be a new mechanism to the pathogenic phenotypes resulting from misregulation of the RAS signaling pathway.
Introduction
Regulation of gene transcription includes dynamic structural changes of the packaged DNA, the chromatin. Nucleosomes, the basic units of chromatin, are composed as histone octamers, containing 2 copies of each subunit, H2A, H2B, H3, and H4, wrapped 1.6 times by DNA (1). The surface of nucleosomes exposes the amino-terminal tails of histones, which are the main sites for posttranslational modifications, such as acetylation, phosphorylation, methylation, ubiquitylation, and sumoylation (2).
Histone acetylation at promoters is a hallmark of actively transcribed genes, and acetylation levels are correlated with transcription rates (2). Of note, histone acetylation is a dynamic process established by complexes of histone acetyltransferases (HATs) and histone deacetylases (3). Abnormal histone acetylation was found as a feature of human cancer and neurological diseases (4, 5), and the essential role played by histone acetylation during mammalian development is illustrated by the observation that mice lacking H4K16 acetylation, as a result of a mutation in the MYST HAT 1 (MYST1) gene, fail to develop beyond the blastocyst stage (6). Despite major progress in the identification of lysine residues of protein complexes targeted by acetylation, the effect of individual HATs on regulatory networks is still largely unknown (7).
In this report, we found the MYST4 gene, which encodes 1 out of 5 members of the MYST HAT family, disrupted by a balanced chromosomal translocation in a patient with clinical features resembling Noonan syndrome. Noonan syndrome is a common monogenic condition, occurring in 1:1,000–1:2,500 individuals (8). It is characterized by postnatal reduced growth, cardiac defects, distinctive facial dysmorphism, and variable cognitive deficits. The main underlying pathomechanism is hyperactivation of the RAS/MAPK transduction pathway, with a heterozygous germline mutation in PTPN11, SOS1, KRAS, RAF1, SHOC2, NRAS, BRAF, or MEK1 being detected in approximately 70% of patients with this disorder or a clinically related phenotype. These genes encode signal transducers that promote RAS/MAPK signaling, the majority regulated by complex autoinhibitory mechanisms that are impaired by mutations (8).
We present data to demonstrate that the HAT MYST4 specifically regulates the MAPK signaling pathway via H3 acetylation in vivo and in vitro in human and mice. We show that MYST4 deficiency leads to hyperphosphorylation of proteins of the MAPK signaling pathway and, like mutations of previously identified disease genes from this pathway, underlies a phenotype with clinical features overlapping Noonan syndrome. Such surprisingly specific effects of a single chromatin factor should prompt consideration of epigenetic factors, even in monogenic human disorders that typically have a characteristic pathology.
Results
MYST4 is disrupted in a patient with a Noonan syndrome–like phenotype.
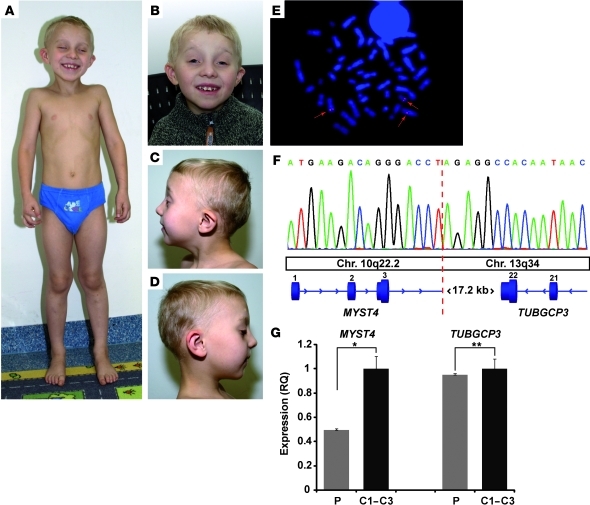
We identified a patient with an apparently balanced de novo chromosomal translocation t(10;13)(q22.3;q34) in our cohort of patients with Noonan syndrome–like features, in whom mutations in the known disease genes from the RAS/MAPK pathway were excluded. The boy was born at term with normal birth weight (3,500 g, –0.28 standard deviation score [SDS]) and length (52 cm, –0.25 SDS) as the second child to healthy, nonconsanguineous parents of European descent. During infancy, his growth and weight fell below the third centile. When referred at age 6.2 years, he presented with proportionately short stature (101 cm, –4.2 SDS; 14 kg, BMI 13.7; head circumference, 49 cm, –2.44 SDS), with marked retarded bone age, ligamentous laxity, attention deficit hyperactivity disorder with learning disability (IQ 75–80), and distinct facial features with blepharophimosis, ptosis, high arched eyebrows, low-set ears with overfolded helix and fleshy lobe, smooth philtrum, retrognathia, and a high arched palate (Figure 1, A–D). A cerebral MRI scan at the age of 5.3 years was reported normal. Endocrinological evaluation was suggestive of growth hormone deficiency, but the mother declined further investigations. No disease-related lesions within the entire coding sequence of the known Noonan syndrome genes had been identified. While cardiac anomalies were not present, he had a suggestive facial appearance, short stature, broad thorax, and mild mental retardation, fulfilling the established van der Burgt criteria for Noonan syndrome (9).
Figure 1. Phenotype and genetic studies in the patient with MYST4 haploinsufficiency at age 6 years.
(A) Note the mild funnel chest and the genua valga and facial dysmorphism (B–D) with blepharophimosis, ptosis, high arched eyebrows, low-set ears, smooth philtrum, and retrognathia and a high arched palate. Ptosis was surgically treated at age 5 and 6 years. (E) Representative metaphase spread of the patient using the BAC clone RP11-668A2 (red, arrows), with hybridization signals localized on both derivative chromosomes, spanning the breakpoint region. Original magnification, ×1,000. (F) Breakpoint sequencing after long-range PCR indicating the breakpoint (red dotted line) disrupting the MYST4 gene in intron 3. Chr., chromosome. (G) Relative mRNA expression levels of the haploinsufficient MYST4 gene and the TUBGCP3 gene 3′ of the breakpoint region in the peripheral blood of the patient (P) and 3 healthy age-matched controls (C1–C3). Note the significant decrease of MYST4 expression levels in the patient (*P < 0.001, t test) but unchanged relative expression levels of TUBGCP3 (**P < 0.8, t test). RQ, relative quantification.
Karyotyping using GTG banding in the patient and both parents revealed a balanced de novo chromosomal translocation t(10;13)(q22.3;q34) in the patient. Genome-wide molecular karyotyping using an Affymetrix GeneChip Mapping 6.0 array excluded relevant copy number changes, suggesting a disruption of a gene at one of the translocation breakpoints associated with the phenotype. We mapped the translocation breakpoints using FISH analysis and long-range PCR (Figure 1, E and F) and found the breakpoint in 10q22.3 to disrupt the MYST4 gene within intron 3 after the first coding exon. A 50% reduction of mRNA expression levels of this gene was confirmed by quantitative RT-PCR in the patient’s leucocytes (Figure 1G). The breakpoint in 13q34 was not located within a gene previously associated with Noonan syndrome, and the TUBGCP3 gene, which is located 17.2-kb downstream, showed normal expression levels in the patient (Figure 1G). Western blot analysis (Supplemental Figure 1; supplemental material available online with this article; doi: 10.1172/JCI43428DS1) and gene structure prediction using GENSCAN (10) showed no evidence of an aberrant MYST4 protein.
Mutation scanning of the entire coding sequence of the MYST4 gene was then performed in the patient to exclude a second hit, suggesting haploinsufficiency as a possible pathogenetic mechanism. No disease-associated mutation was identified by sequencing MYST4 in an additional 131 subjects who had the clinical features associated with Noonan syndrome but without mutations in previously identified disease genes. This showed that intragenic mutations in MYST4 do not represent a common event in Noonan syndrome and further illustrated the genetic heterogeneity underlying the common clinical features of this syndrome.
MYST4 haploinsufficiency impairs histone acetylation.
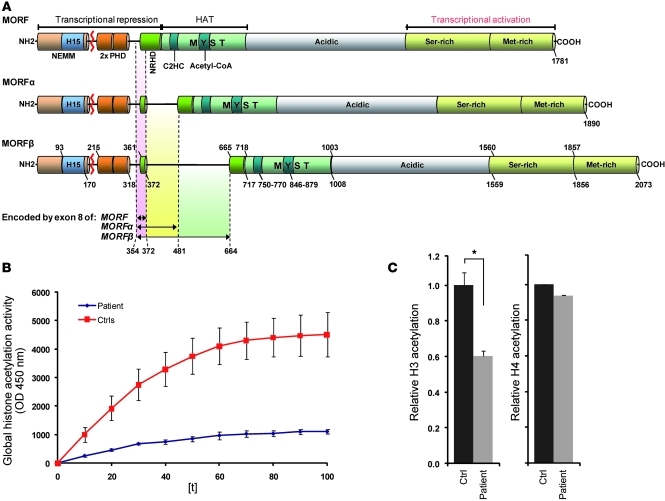
MYST4 belongs to the family of MYST HATs characterized by a highly conserved lysine acetyltransferase domain (Figure 2A) shared by MOZ, Ybf2/Sas3, Sas2 and TIP60 (MYST3) (11–13). The human MYST family has 5 members, making it the largest family of lysine acetyltransferases (14, 15). Despite a high homology between MYST3 and MYST4 (16, 17), studies in mice and zebrafish revealed that they are not functionally redundant (11, 17–21).
Figure 2. Structure and histone acetylation of MYST4.
(A) Three MYST4 isoforms have been identified (MORF, MORFα, and MORFβ) to differ in the negative regulator for HAT domain (NRHD) coded by exon 8. The red line indicates the site of translocation (exon 3/4 boundary at amino acid position 207) with respect to protein structure. Note histones H1- and H5-like domain (H15), C4HC3 PHD-zinc fingers (PHD), and the N-terminal part of Enok, MOZ, or MORF (NEMM). Numbers represent amino acids. NH2, N-terminal end of the protein; 2x PHD, 2-times PHD domain; C2HC, zinc finger motif domain. (B) Time course of histone acetylation activity in a cell line of the patient compared with that of controls (Ctrls). (C) Significant decrease of global H3 (*P < 0.05, t test) but normal H4 acetylation in the patient (t test).
To determine the histone acetylation effect in our patient, we generated a lymphoblastoid cell line and examined the level of histone acetylation (Figure 2B). In line with recent data indicating that MYST3 primarily acetylates histone 3, at least at Hox loci (22), we observed significantly reduced H3 acetylation but unchanged H4 acetylation in these cells lacking MYST4 (Figure 2C).
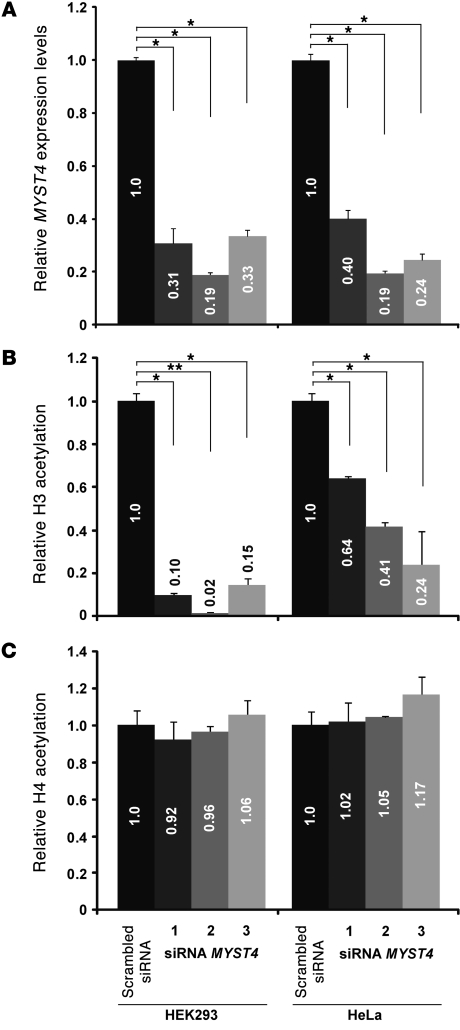
To further investigate the role of MYST4 in acetylation, and to exclude secondary effects on the histone acetylation by immortalization of the patient’s lymphoblastoid cell line, we also performed siRNA knockdown experiments in HEK293 and in HeLa cell lines. We used 3 independent siRNAs to exclude off-target effects; each siRNA transfection experiment resulted in a reduction in the level of MYST4 mRNA of between 60%–80% (Figure 3A). The reduction in MYST4 levels was similar in both HEK293 and HeLa cells. Reduction in MYST4 levels showed a substantial reduction in global histone 3 acetylation levels, with HEK293 cells showing a slightly more pronounced effect than HeLa cells. The extent of the effect of MYST4 deficiency strongly correlates with the reduction of H3 acetylation (Figure 3B). No change in global histone 4 acetylation levels could be detected as a result of transfection of these siRNAs (Figure 3C). From these results, we conclude that MYST4, like the closely related MYST3 protein, primarily acts on histone 3.
Figure 3. Effect of different MYST4 siRNAs on H3 and H4 acetylation.
(A) Results of quantitative RT-PCR revealed significantly reduced MYST4 mRNA expression levels in both cell lines (*P < 0.05, t test), HEK293 and HeLa, after exposure to 3 different MYST4 siRNAs (1, HSS118879; 2, HSS118880; 3, HSS118881). (B) Significant decrease of global H3 but (C) normal H4 acetylation was confirmed in HEK293 and HeLa cell lines (*P < 0.05, t test; **P < 0.00001, t test). Note the correlation between MYST4 depletion levels and loss of H3 acetylation (P < 0.02793, rank correlation coefficient) but not H4 acetylation (P < 0.9349, rank correlation coefficient). Based on these results the siRNA HSS118880 was used for further analysis. Numbers in the bars are the relative quantification.
Myst4-depleted Querkopf mice present with features resembling those of Noonan syndrome.
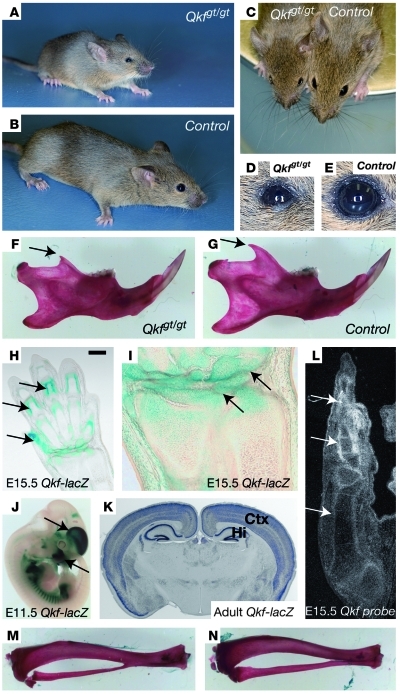
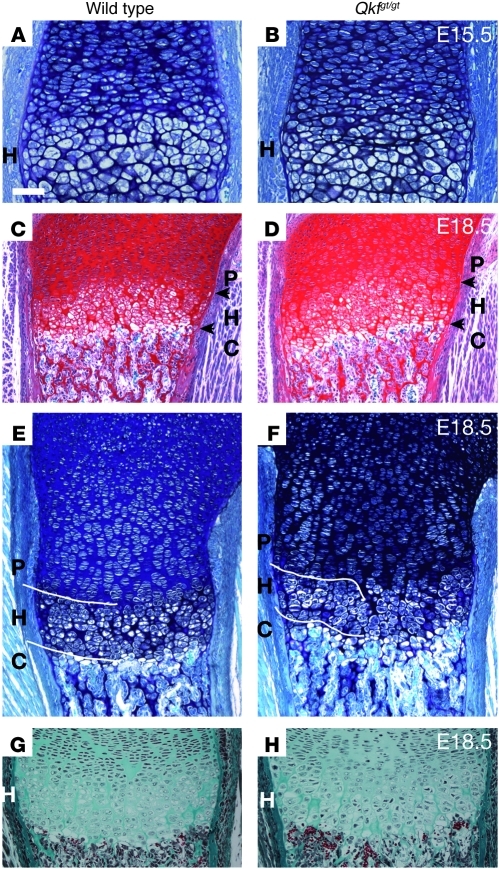
Mice homozygous for a hypomorphic gene trap allele of Myst4, known as Querkopf mice (Qkfgt/gt mice), also showed a failure-to-thrive phenotype (Figure 4, A–C), ventrally positioned ears, small eyes with frequently occluded nasolacrimal duct (Figure 4, D and E), reduced muscle mass and body fat, and retarded suture closure as a sign of retarded bone age (17). In addition, compared with those of wild-type mice, mutant mouse brains were shorter and reduced in size, had small olfactory bulbs and paucity of large pyramidal cells, and showed a neuronal migration defect, resulting in reduced size of the cortical plate (17). Furthermore, QKF is required for the establishment and maintenance of adult neural stem cells and neurogenesis in the adult (23, 24). The Qkfgt allele is due to a transgenic insertion that reduces the mRNA level such that homozygous mice have approximately 10% of wild-type mRNA levels. In the light of the phenotype of our patient, we also documented proportionate short length and small processes of the lower jaws in the Qkfgt/gt mouse (Figure 4, F and G). In addition, mice heterozygous for an N-terminal deletion in the MYST4 protein showed a 15% (P < 0.0001) reduction in body weight at 5 to 7 weeks of age. Analysis of the lacZ-reporter gene activity showed high expression in mesenchyme surrounding cartilage primordia of the developing skeletal system, the dorsal telencephalon, and the adult parietal cortex and hippocampus (Figure 4, H–K). Subtle changes in the columnization of the growth plate seen in the histological presentation might explain the growth phenotype (Figures 4 and 5). Thus, the Qkfgt/gt mouse resembles the human phenotype in growth retardation, facial dysmorphism, and developmental brain anomalies.
Figure 4. Qkfgt/gt mutant mice deficient in Myst4.
Qkfgt/gt mutant mice deficient in MYST4 exhibit facial and skeletal abnormalities. (A–C) External appearance of Qkfgt/gt mutant mice versus that of controls at 7 weeks of age. (D and E) Close-up images of the eyes. (F and G) Skeletal preparation of the lower jaw. (H–K) β-Galactosidase reporter activity (blue) representing the high Qkf gene expression domains (H and I) in cartilage primordia of the developing skeletal system at E15.5, (J) primordia of the cerebral cortex and skeletal elements at E12.5, and (K) the adult parietal cortex (Ctx) and hippocampus (Hi). (L) Endogenous Qkf mRNA detected by in situ hybridization in skeletal primordia of the E15.5 hind limb (precipitated silver grains corresponding to Qkf mRNA appear white in dark-field image). Arrows indicate coronoid process in F and G, strongly Qkf–β-galactosidase–positive cells in H and I, telencephalon and mandibular process in J and K, and endogenous Qkf mRNA expressing cells in skeletal primordia in L. (M) In mice, the tibia and the fibula normally fuse in their distal third. (M) The Qkfgt/gt mutant mice lack the fusion of the tibia and fibula (N) normally observed in wild-type mice. Scale bar: 190 μm (H); 65 μm (I); 160 μm (J); 790 μm (K); 910 μm (L); and 3.6 mm (M and N).
Figure 5. Myst4 deficiency alters growth plate in mice.
(A, C, E, and G) Wild-type and (B, D, F, and H) Qkfgt/gt mutant growth plates. (A, B, E, and F) Toluidine blue/fast green, (C and D) safranin O/fast green, and (G and H) Masson’s trichrome–stained sections of (A and B) E15.5 distal femur, (C and D) E18.5 proximal and (E–H) distal femur. (A and B) Disorganization in the Qkfgt/gt mutant hypertrophic (H) region was visible at E15.5 and (c–f) more pronounced at E18.5 and enlarged in G and H. Arrows delineate the border of the hypertrophic zone. Note the poor demarcation between the Qkfgt/gt proliferative (P), hypertrophic, and chondrolytic (C) regions, as compared with those of wild-type regions, particularly in F versus E (indicated with white lines), the reduced height of the hypertrophic region (167 μm in E versus mean height of 136 μm in F; P value < 0.05), and the aberrant columnar structure in the hypertrophic region (H versus g). Scale bar: 55 μm (A and B); 180 μm (C and D); 95 μm (E and F); and 90 μm (G and H).
Human MYST4 isoform-specific expression pattern is consistent with the phenotypic traits.
Since the NRH domain, which might influence the HAT activity, differs between the 3 MYST4 transcripts (16), developmental stage–specific and tissue-specific functions were suggested for the different isoforms (25). We therefore analyzed total MYST4 expression and the proportion of each isoform in various human tissues by transcript-specific real-time PCR (Supplemental Figure 2). In accordance with the phenotype in humans and mice and the published data from mouse in situ assays, we observed, by far, the highest expression levels in fetal whole brain extracts, while in adult tissues, whole brain, skeletal muscle, and pancreas showed the highest levels. The pattern of the isoform distribution changed in most of the analyzed tissues but again most remarkably in the skeletal muscle and the brain (Supplemental Figure 2, C and D).
MYST4 depletion in human and mice leads to similar changes of the genome-wide transcriptome profiles.
To uncover the target genes and involved pathways of MYST4 histone acetylation, we investigated the Qkfgt/gt mouse as well as HEK293 and HeLa MYST4 siRNA cell lines by genome-wide expression studies and the latter also by ChIP-CHIP experiments. Although HATs might represent general modulators of transcriptional activation by ubiquitous acetylation of histones, of those genes with a fold change of less than –1.5 or more than 1.5, we found only 689 genes differentially expressed in the HEK/HeLa MYST4 siRNA approach (Supplemental Figure 3), 329 genes in the mouse Qkfgt/gt versus wild-type adult dorsal cortex, and 619 genes in the mouse Qkfgt/gt versus wild-type E12.5 dorsal telencephalon. With reference to the human cell lines, 510 (74%) differentially expressed genes were downregulated (Supplemental Table 1), while in the adult Qkfgt/gt mouse cerebral cortex only 110 genes (33%) were downregulated and, in the E12.5 Qkfgt/gt mouse dorsal telencephalon, 345 genes (56%) were downregulated (Supplemental Tables 2 and 3). The expression level changes in the mouse of up to 6.11 were comparable to those from the HEK/HeLa approach (up to 5.75). Consistent with the high MYST4 expression level in brain, we found the largest proportion of differentially expressed genes to be ordinarily predominantly expressed in the brain but also in placenta, epithelium, and bone marrow (Supplemental Figure 4A and Supplemental Table 4). Gene ontology analysis of the differentially expressed genes revealed similar distinct categories of intracellular component and molecular function in all cell and tissue comparisons (Supplemental Figure 4, B–G, and Supplemental Tables 5–10). We found the highest percentage of genes coding for proteins located in the cytoplasm (42%–44%), nucleus (26%–35%), and endoplasmatic reticulum (6%–20%) (Supplemental Figure 4, B, D, and F) and functionally involved in general binding (40%–56%), protein binding (26%–27%), and catalytic activity (16%–27%) (Supplemental Figure 4, C, E, and G).
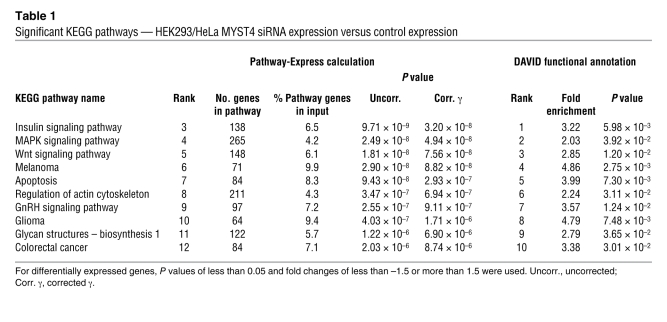
We also analyzed the differentially expressed genes for groups of molecular interaction and reaction networks with reference to the Kyoto encyclopedia of genes and genomes (KEGG) pathway database (Supplemental Tables 11–16 and ref. 26). For the combined HEK/HeLa siRNA comparison, we found significant enrichment of genes in 10 KEGG pathways involved in signaling processes, such as insulin, MAPK, Wnt, and GnRH signaling pathways, but also in structural processes of actin cytoskeleton and glycan biosynthesis and in regulation of apoptosis (Table 1). These networks are part of basic regulatory mechanisms of brain development, cell assembly, and limb formation.
Table 1 .
Significant KEGG pathways — HEK293/HeLa MYST4 siRNA expression versus control expression
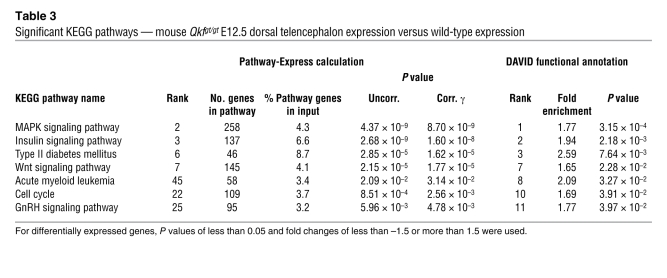
In the adult cerebral cortex of Qkfgt/gt versus wild-type mouse comparison, we discovered 4 significantly altered networks of neuronal development, namely the neuroactive ligand-receptor interaction, axon guidance, calcium signaling, and the MAPK signaling pathways (Table 2). In the dorsal telencephalon of the E12.5 Qkfgt/gt mouse, our data revealed 7 enriched KEGG pathways (Table 3). Of note, we detected the MAPK signaling pathway in all 3 approaches, indicating this pathway as a major target of MYST4. The insulin, Wnt, and GnRH signaling pathways were enriched in the HEK/HeLa approach and the dorsal telencephalon of the E12.5 Qkfgt/gt mouse, demonstrating an involvement of MYST4 in embryonic development, especially of the brain, which has been proposed before (17, 21).
Table 2 .
Significant KEGG pathways — mouse Qkfgt/gt adult dorsal cortex expression versus wild-type expression
Table 3 .
Significant KEGG pathways — mouse Qkfgt/gt E12.5 dorsal telencephalon expression versus wild-type expression
The MAPK signaling pathway represents a major target of MYST4 gene regulation.
In order to distinguish between primary and secondary target genes of MYST4, we performed genome-wide ChIP using an anti-MYST4 antibody on HEK293 and HeLa cell lines (Supplemental Table 17 and Supplemental Figure 5). Antibody specificity was confirmed by Western blotting, showing identification of protein bands consistent in size with the 3 known protein coding transcripts of MYST4 only (Supplemental Figure 1). Using Pathway-Express and DAVID, 4,540 genes showing a P value of less than 0.05 were used to determine involved pathways. Ten pathways were significantly enriched in the Pathway-Express analysis, namely MAPK signaling, mTOR signaling, regulation of actin cytoskeleton, gap junction, phosphatidylinositol signaling, long-term depression, focal adhesion, circadian rhythm, basal cell carcinoma, and thyroid cancer pathways (Supplemental Table 18). Of these, only the MAPK signaling and the thyroid cancer pathways were also enriched in the DAVID functional annotation of KEGG pathways, which, in contrast to Pathway-Express, does not take into account the probability of ChIP-CHIP binding for each region (model-based analysis of tiling arrays [MAT] scores) (Table 4 and Supplemental Table 19).
Table 4 .
Significant KEGG pathways of genes with ChIP-on-CHIP binding sites
We repeated the pathway analyses using both programs with the 467 genes that were significantly differentially expressed in the human cell lines and in addition showed MAT score P values of less than 0.05 (Supplemental Table 20). Using these genes, both programs again revealed only the MAPK signaling and the thyroid cancer pathways as both being significantly regulated by MYST4 (Table 5 and Supplemental Tables 21–23). These results were independently confirmed by quantitative real-time PCR of 9 significantly downregulated genes and 2 unaltered control genes of the MAPK signaling pathway (Supplemental Table 24). Our finding that expression was not altered in all genes with MYST4 binding revealed by ChIP-CHIP may be explained by the fact that MYST4 is only 1 out of several proteins that modulate gene expression. On the other hand, many differentially expressed genes did not show MYST4 binding, indicating an indirect regulation by MYST4. The 467 differentially expressed genes with a high probability of MYST4 binding indicative of direct regulation showed a similar tissue expression pattern as that of the MYST4 gene (Supplemental Table 25 and Supplemental Figure 5C). Supporting a mainly transcriptional activation of MYST4 (Supplemental Figure 5B), 80.9% were downregulated.
Table 5 .
Significant KEGG pathways of significant differentially expressed genes with ChIP-on-CHIP binding sites
MYST4 insufficiency causes enhanced phosphorylation of major genes from the MAPK pathway.
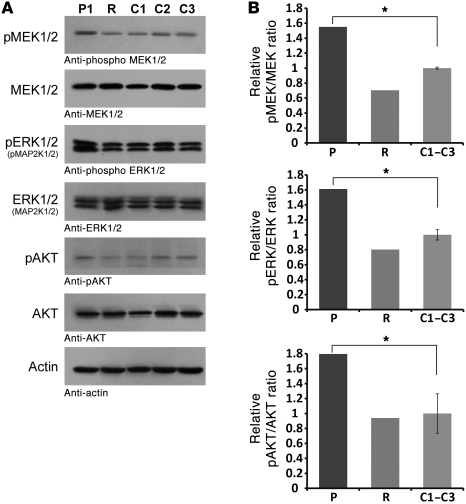
To investigate whether MYST4 haploinsufficiency resulted in dysregulation of the MAPK signaling pathway, we explored the phosphorylation levels of MEK1/2 (MAP2K1/2) and ERK1/2 (MAPK1/3) in the patient’s lymphoblastoid cell line. As shown in Supplemental Figure 6, similar to what is generally observed for most Noonan syndrome–causing SHP2, SOS1 and RAF1 mutants, an increased phosphorylation of MEK1/2 and ERK1/2 was documented. In addition, we also found enhanced AKT phosphorylation (Figure 7). To demonstrate that this effect is indeed MYST4 dependent, we transiently transfected the patient’s cell line with an MYST4 wild-type construct at the extent of mean MYST4 expression levels. This resulted in complete rescue of the increased phosphorylation to a phosphorylated to nonphosphorylated protein ratio, as observed in wild-type cell lines (Figure 6).
Figure 6. Biochemical characterization of MEK, ERK, and AKT phosphorylation levels.
(A) Increased MAPK signaling activity of the patient (P1) containing the MYST4 mutation compared with 3 control samples (C1–C3). The patient cell line transiently transfected with an MYST4 wild-type construct (R) demonstrated a normalization of the phosphorylation levels. Cells were analyzed for the phosphorylation level of MEK/pMEK1/2 (MAP2K/pMAP2K1/2), ERK/pERK1/2, and AKT/pAKT. Total amounts of MEK, ERK, and AKT and actin in cell lysates are shown, and the specificity of the antibody is specified below each panel. (B) After normalization to actin, densitometric analysis confirmed significantly increased ratios of all 3 measured parameters (*P < 0.05, t test) and normalization to wild-type ratios after rescue of MYST4 expression levels.
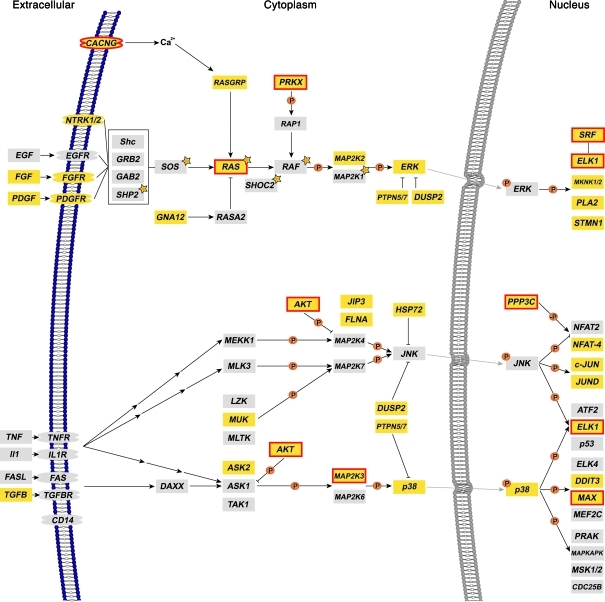
Figure 7. The MAPK signaling pathway.
Overview of genes with ChIP-CHIP binding sites and differential expression. Three out of the four major branches of the MAPK signaling pathway are shown: ERK1/2 (MAP2K1/2), c-Jun, and p38 (modified from KEGG pathway map 04010; http://www.genome.jp/kegg/). Mutations affecting the ERK1/2 (MAP2K1/2) branch are identified in approximately 70% of patients with Noonan syndrome (genes marked with orange stars). Note that genes with significant ChIP-on-CHIP bindings sites (Supplemental Table 23) are marked in yellow; additional significantly differentially expressed genes in the human cell lines are marked with red boxes.
Discussion
We identified disruption of the MYST4 gene as what we believe to be a novel, rare cause of a Noonan syndrome–like phenotype. Our extensive studies in vivo and in vitro in humans and mice reveal that the H3 histone acetylase MYST4 primarily regulates the MAPK signaling pathway. In general, MAPK activity influences many different developmental stages by regulation of cell proliferation, differentiation, migration, and apoptosis (27–29). Four main MAPK pathways have been recognized: ERK1/2, c-Jun, p38 (MAPK14), and ERK-5 (MAPK7). Mutations in the genes PTPN11, SOS1, KRAS, RAF1, SHOC2, NRAS, BRAF, and MEK1 from the classical RAS/MAPK transduction pathway (ERK1/2) are detected in 70%–75% of patients with Noonan syndrome or closely related phenotypes. These disorders share short stature, intellectual deficits, cardiac defects, and distinctive facial dysmorphism. Other associated features commonly include ectodermal and skeletal anomalies, cryptorchism, lymphatic dysplasias, mild bleeding diathesis, and, rarely, predisposition to childhood hematologic malignancies. The underlying biochemical defect is increased signal traffic through the MAPK cascade, and increased phosphorylation of MEK1/2 and ERK has been shown for patients with Noonan syndrome carrying a mutation in N-RAS (30). A similarly enhanced phosphorylation of MEK1/2 and ERK was confirmed in our patient with MYST4 haploinsufficiency, who also showed enhanced AKT phosphorylation as part of the RAS effector pathway (Figures 6 and 7). We also strengthened the MYST4 effect on the phosphorylation of these proteins by transfecting the patient cell line with an MYST4 wild-type construct and confirming normalization of the phosphorylation ratio.
Investigation of genes with ChIP-CHIP binding and significant differential expression by MYST4 yielded 10 downregulated genes (AKT2, CACNA2D2, ELK1, MAP2K3, MAX, MRAS, PPP3CB, PRKX, SMAD4, and SRF) modulating the ERK1/2, c-Jun, and p38 branches of the MAPK signaling pathway (Supplemental Tables 23 and 24, and Figure 7). Notably, MRAS and PRKX, the latter highly expressed in adult and fetal brain, are modulators of the transcription factors ELK1 and SRF, which are part of the ERK1/2 pathway. Therefore, our data suggest that dysregulation of ERK1/2 signaling in general leads to Noonan syndrome–like features, as seen in our patient and the Qkfgt/gt mouse (Figure 1, A–D, and Figure 4). MRAS is also involved in membrane targeting of the SHOC2-PP1C complex, which is required for efficient RAF1 translocation to the membrane and activation (31). AKT and ERK are major regulators on early limb bud formation (32–34), but MYST4 haploinsufficiency in our patient did not result in a specific limb phenotype as distinct from an overall reduction in skeletal growth. AKT2 and MAP2K3 are part of the p38 and JNK pathway that is involved in ELK1 and MAX regulation. MAP2K3 phosphorylates and activates p38 during skeletal muscle development, neuronal regulation, and chondrocyte differentiation (35, 36). The involvement of MYST4 in chondrocyte differentiation is shown by the aberrant columnar structure of the hypertrophic region of the Qkfgt/gt growth plate (Figure 5). Interestingly, AKT2 also plays a key role in myoblast differentiation and interacts with p38 and PI 3-kinase, regulating cell cycle progression and apoptosis (37). Smad4 is involved in BMP-Smad signaling, which regulates stem cell renewal, cell proliferation, differentiation, migration, and apoptosis and controls embryo development and postnatal tissue homeostasis (38, 39).
Somatic, oncogenic transformations due to MYST3 or MYST4 transfusion genes caused by recurrent chromosomal translocations are observed in leukemia and uterine leiomyomata cells, but target genes are unknown (40–43). Here, the generation of a fusion protein with hyperactivated acetyltransferase activity seems to be the underlying cause. While oncogenic transformation was neither seen associated with MYST4 haploinsufficiency in our patient nor in the Qkfgt/gt mouse, increased tumor risk is a feature of Rubinstein-Taybi syndrome, the only known human phenotype with defective HAT, the CREB binding protein (5). Of note, both the Noonan syndrome–like syndrome reported here and the Rubinstein-Taybi syndrome result from haploinsufficiency; both have strong phenotypic similarities, presenting with short stature, intellectual disability, and facial dysmorphism, including ptosis.
Even though heterozygous Qkfgt mice with approximately 55% MYST4 mRNA show mild but recognizable phenotypical features, including reduced body size, the range of phenotypes seen in our MYST4 haploinsufficient patient is more clearly identifiable in the more severely affected homozygous querkopf mice. The mouse phenotype, which results from a hypomorphic allele producing approximately 10% normal mRNA, reflects the failure-to-thrive together with craniofacial and skeletal anomalies. Interestingly, cardiac defects were neither noted in our patient nor the Qkfgt/gt mouse. However, only 65%–86% of patients with PTPN11 mutations (44, 45), 60% of patients with KRAS mutations (46), and 76% of patients with SOS1 mutations show cardiac defects (47), indicating reduced penetrance for the heart phenotype. In addition, myeloproliferative disease, as described in the Noonan syndrome Ptpn11 (D61G/+) mouse, was neither observed in our patient nor in the Qkfgt/gt mouse. As MYST3 is involved in hematopoiesis and leukemia, any role that MYST4 might play in the hematopoietic system might be performed equally by MYST3 (11, 20). This might also explain morphological differences, as observed in the cerebral structural anomalies of Noonan syndrome and MYST4 mice models.
We note that inhibitors of lysine deacetylases, mimicking HATs, are used to induce pluripotent stem cells (48) and are widely emerging as important drug targets for the treatment of a range of cancer and neurodegenerative diseases (49, 50). With the knowledge of the acetylation targets and the pathways modulated, new applications for lysine deacetylases may evolve and resulting effects may become more predictable.
We conclude that the Noonan syndrome–like phenotype in the patient with MYST4 haploinsufficiency as well as in the Qkfgt/gt mouse is explained by disturbed MAPK signaling. Although disturbed epigenetic modifications might be expected to have a major general effect, our data indicate that failure of a distinct HAT, such as MYST4, acetylating the histone H3, may specifically affect only a certain pathway. Such epigenetic effects should therefore be considered in genetically heterogeneous conditions like Noonan syndrome and may represent a future target for novel therapeutic strategies.
Methods
Fluorescence in situ hybridization.
Region-specific BAC clones for FISH mapping were selected from the NCBI and UCSC genome browsers. FISH analysis was performed using metaphase chromosomes prepared from the patient’s cell suspension and lymphoblastoid cell lines. Genomic BAC DNA was fluorescently labeled with Cy3-dCTP (Amersham Biosciences) by standard nick translation with the DIG-Nick-Translation Kit (Roche). The probes were blocked with Cot-1 DNA. Metaphase spreads were hybridized at 37°C overnight with the Cy3-labeled BAC probes and a specific FluoroX-labeled (Amersham Biosciences) subtelomeric control probe. After posthybridization washes, chromosomes were counterstained with DAPI (Serva). Images were captured on a Zeiss Axioplan 2 microscope with a CCD camera and processed with the Isis Software (Metasystems).
Long-template PCR and mini-FISH analyses.
All long-template PCRs were performed with the Expand Long Template PCR-System (Roche Diagnostics) according to the manufacturer instructions, with primer pairs (480K16-F1-F ACCATTAGGTGTCCATTTTTAAGAAACA, 480K16-F1-R CAGCTTACGGAGAATGTAGGAGACTTAG, 88E10-F5-F TGCTTTAGCTAGAATAGGGACAGAAAGA, 88E10-F5-R TGCACTACAGTCACAGCACAATAAAATA) chosen from the genomic sequence of the breakpoint-spanning BAC clones. Purified long-template PCR-products (QIAquick PCR Purification Kit, Qiagen) were labeled with Cy3-dCTPs by standard nick translation as described above, and FISH was performed on metaphase spreads.
Breakpoint sequencing.
Primer pairs for breakpoint-spanning PCRs were chosen from the genomic sequence of the breakpoint regions on chromosomes 10 and 13. Different combinations of forward and reverse primers were used to amplify a breakpoint-spanning PCR product with the Expand 20kbPlus PCR-System, dNTPack (Roche Diagnostics), according to the manufacturer’s instructions.
Cell culture and transfection of HeLa and HEK293 cells.
HeLa and HEK293 cells were maintained in DMEM/HAM’s F12 (BIOCHROM AG), supplemented with 10% heat-inactivated fetal bovine serum (BIOCHROM AG) and 1% penicillin/streptomycin (10,000 U/10,000 μg/ml) (BIOCHROM AG) at 37°C, 5% CO2, 91% relative air moisture. Three independent RNAi siRNAs targeting MYST4 mRNA (MYST4 HSS118880, HSS177468 and HSS177469; Invitrogen) were validated by real-time RT-PCR. Cells were then transfected with 1 out of 3 different Stealth RNAi siRNA targeting MYST4 mRNA (HSS118879, HSS118880, HSS118881; Invitrogen) or Scrambled Negative Control Stealth RNA (Invitrogen) according to the manufacturer’s instructions. Medium was changed to growth medium without antibiotics 12 hours after transfection. Cells were harvested 51.75 hours after transfection. After evaluation of siRNA efficiency by quantitative RT-PCR and histone acetylation assay, HSS118880 was used for further studies.
Global histone H3/H4 acetylation assay.
Histone extraction and detection of global histone H3/H4 acetylation were performed using EpiQuik Global Histone H3/H4 Acetylation Assay Kits, according to the manufacturer’s instructions (Epigentek), with an input of 1 μg of histone proteins extracted from lymphoblastoid cell lines of the patient and 3 unrelated healthy controls and HEK293 and HeLa cells. Data analysis was performed according to the manufacturer’s instruction. Acetylation levels were calculated for the patient with reference to the 3 healthy controls and for the HEK293 and HeLa MYST4 siRNA cell lines with reference to Scrambled Negative Control Stealth RNA transfected cell lines.
HAT activity assay.
Histone extraction and detection of HAT activity were performed using the EpiQuik HAT Activity/Inhibition Assay Kit, according to the manufacturer’s instructions (Epigentek). Briefly, histone substrate was stably spotted on wells where active HATs bind and acetylate histone substrate. The acetylated substrate was colorimetrically quantified after binding of high-affinity antiacetylated histone antibody.
RNA isolation from human cells.
Harvested cell pellets were washed using PBS. RNA was isolated using the QIAcube instrument in combination with the RNeasy Mini Kit, QIAshredder, and RNase-Free DNase Set, according to the manufacturer’s instructions (QIAGEN).
cDNA synthesis.
cDNA was synthesized using the SuperScript II Reverse Transcriptase Kit with random hexamer primers (Invitrogen) from RNA extracted from fresh blood samples collected in PAXgene tubes (Becton Dickinson) or from cell cultures.
Relative mRNA expression levels of all MYST4/MORF isoforms in fetal and adult human tissues.
For relative expression analysis of MYST4/MORF isoforms, real-time PCR primers and mgb probes were designed according to the manufacturer’s instructions (Applied Biosystems) to obtain primer/probe sets specific for each isoform: MORF forward (F), TGTCTGTAACCAGTGATGAAGGA; MORF probe (P), 6FAM-TCACCTGATACTGAAATAA; MORFα F, AAAAAGGTCTCTCAGAAACAGTCATG; MORFα P, 6FAM-TGTTGGCTACAGATACTGAA; MORFβ F, GAGCTTGACAGACGGAAGGATT; MORFβ P, 6FAM-CAGGATGATGATACTGAAATA; and all isoforms reverse, CATCTGCACTTTCTTGTTTGATGTT.
The tissue expression pattern was determined using 4 commercial available cDNA panels (Human Fetal MTCTM Panel and Human MTCTM Panel I [both from Clonetech]; C8244525 and C8234504 [both from BioChain Institute]). All real-time RT-PCRs were performed in quadruplicates in 384-well plates, with a final volume of 20 μl each on an ABI 7900HT, using the TaqMan Gene Expression Mastermix, according to the manufacturer’s instructions (Applied Biosystems). The expression levels of the individual isoforms were calculated using the ΔΔCt method with 2 endogenous controls (B2m, phosphoglyceratekinase 1 [PGK1]). Levels of significance were determined by a 2-sample equal-variance t test applied to the log-expression values.
Mutation analysis.
All exon and flanking intron sequences of MYST4 gene, except the 3ι UTR, were amplified from patient DNA by PCR using intronic primers designed with the Primer3 software. The PCR products were purified with the AMPure Kit (Agencourt) on a Biomek NX instrument (Beckman Coulter). Sequencing reactions were performed on both strands using the BigDye Terminator Cycle Sequencing Kit v3.1 (Applied Biosystems) according to the manufacturer’s instructions. After purification using the CleanSEQ Kit (Agencourt), the products were analyzed on an ABI Genetic Analyzer 3730 (Applied Biosystems), and the traces were evaluated using the SeqPilot 3.2.1.5 software (JSI Medical Systems). Variants were explored against the SNP database (NM_012330.2; http://www.ncbi. nlm.nih.gov/projects/SNP/).
Extraction of protein lysates from human cells.
Harvested cell pellets were washed using PBS and frozen at –70°C for a minimum of 1 hour. After thawing on ice, pellets were resuspended in lysis buffer (0.01 M Tris; 0.15 M NaCl; 1% Triton-X, pH 7.5) and shook at 4°C for 20 minutes. Shearing of cells was performed using a 14-gauge needle. Lysates were stored at –70°C.
Western blotting.
Western blot analysis using protein lysates extracted from lymphoblastoid cell lines of the patient, HeLa and HEK293 cells, respectively, transfected with either Stealth RNA siRNA targeting MYST4 mRNA (MYST4 HSS118880, Invitrogen) or Scrambled Negative Control Stealth RNA (Invitrogen) was performed. Electrophoresis was performed on a 3%–8% Tris-Acetate gel using the NuPage Novex system from Invitrogen. The KAT6B/MORF antibody (ab58823, Abcam) and the β-actin antibody (ab8227, Abcam) were used as loading controls. As secondary antibody, we used the HRP-conjugated goat anti-rabbit IgG antibody (170-6515, Bio-Rad).
Mouse preparation.
Mice heterozygous for a mutation in the Querkopf (also known as Qkf, Myst4, Morf, and Kat6b) gene, Qkfgt/+ mice (17), were used to generate E15.5 and newborn Qkfgt/gt and Qkf+/+ control pups. Skeletal preparations were conducted as described previously (51), with modifications. In brief, bodies were eviscerated; fixed in ethanol and acetone for 4 days each; rinsed in H2O; stained in a solution of 0.015% Alcian Bue 8GX (Sigma-Aldrich), 0.005% Alizarin Red S (Sigma-Aldrich), and 0.05% acetic acid in H2O for 10 days; and then cleared in a solution of 1% potassium hydroxide and 20% glycerol in H2O, followed by further clearing through 40%, 60%, and 80% glycerol in H2O.
β-Galactosidase staining, in situ hybridization, and histology of mice.
β-Galactosidase staining was conducted as described previously (52), and in situ hybridization was carried out as described previously (17). Embryos and pups were fixed in 4% paraformaldehyde and Bouin’s fixative, respectively, and processed for serial paraffin sections as described previously (53). Each block of 4 consecutive sections of the hind limb was stained with (a) hematoxylin and eosin, (b) toluidine blue and fast green, (c) safranin O and fast green, and (d) Masson’s trichrome to visualize specific cell types in developing bone and cartilage, cartilage matrix, ossifying cartilage, and bone structures.
Expression array and analysis of data.
The RNA quality was controlled by an Agilent Bioanalyzer (Agilent Technologies). Affymetrix GeneChip Human Genome U133 Plus 2.0 arrays (Affymetrix) were used for HEK293 and HeLa gene expression analyses, and Affymetrix GeneChip Mouse Exon 1.0 ST arrays were used for Qkfgt/gt and control mouse gene expression analysis. Probe synthesis, hybridization, and initial expression analysis of the Affymetrix GeneChip microarrays were performed according to the protocol recommended by Affymetrix. MYST4 siRNA silencing in HEK293 and HeLa cell lines was performed in 3 individual experiments and hybridized on separate arrays (i.e., 6 arrays were run for HEK293 and 6 arrays were run for HeLa cell lines). All data are MIAME compliant and were uploaded to Gene expression omnibus (GEO; http://www.ncbi.nlm.nih.gov/geo/). The 12 arrays were analyzed together. Data processing and normalization were performed using the Partek Genomic Suite Software Package (Partek Incorporated). For each gene, a 2-way ANOVA was calculated, and an F-test was conducted for an MYST4 effect, adjusting for differences between the 2 cell lines. Genes were determined as regulated by MYST4 if the false discovery rates were less than 0.05 and the fold change was greater than 1.5. Experiments for the Qkfgt/gt and control mouse expression were performed likewise. Qkfgt/gt versus wild-type adult dorsal cortex and Qkfgt/gt versus wild-type E12.5 dorsal telencephalon were analyzed in triplicates with 3 animals per genotype, 1 array per animal and tissue. The Qkfgt/gt arrays were analyzed using Bioconductor software ( http://www.bioconductor.org/). Data from all tissues were analyzed together. Expression values were normalized using the gcRMA algorithm. Gene-wise linear models were fitted using the limma software package. Empirical Bayes-moderated t-statistics were computed for each tissue to test for differences between the Qkfgt/gt mutants and normal controls (54). The t-statistics were adjusted for age differences and for correlation between sibs (55). P values were adjusted to control the false discovery rate using the method of Benjamini and Hochberg. Genes were determined as regulated by MYST4 if the unadjusted P value was less than 0.05 and the fold change was greater than 1.5.
ChIP.
HeLa and HEK293 cells were processed with the LowCell ChIP Kit (Diagenode) shearing the DNA with a Bioruptor (Diagenode) according to the manufacturer’s instructions, including positive and negative controls (10,000 cells/IP). Two micrograms of MYST4 (KAT6B/MORF) antibody (ab58823, Abcam) were used in parallel to 2 μg of negative control IgG from rabbit (Diagenode). The immunoprecipitates were amplified using the GenomePlex Complete Whole Genome Amplification (WGA2) Kit (Sigma-Aldrich) as described in the Farnham laboratory WGA protocol for ChIP amplicons ( http://www.genomecenter.ucdavis.edu/farnham/pdf/8-18-06WGA.pdf).
Tiling array and analysis of data.
ChIP and control input DNA samples were hybridized in triplicates on separate Affymetrix human promoter 1.0 arrays, as described in the Affymetrix Analysis Technical Manual. All data are MIAME compliant and were uploaded to ArrayExpress (ArrayExpress accession, E-MEXP-2591; http://www.ebi.ac.uk/microarray-as/ae/). Enrichment values (ChIP/control input DNA) were calculated using the MAT algorithm implemented in the Partek Genomic Suite Software. RefSeq genes were assigned to the MAT regions with MAT score P values of 0.1, 0.05, 0.01, and 0.0001.
Quantitative real-time PCR validation of whole-genome expression array and ChIP-CHIP results.
All real-time RT-PCRs were performed in quadruplicates in 384-well plates with a final volume of 20 μl each on an ABI 7900HT using the TaqMan Gene Expression Mastermix according to the manufacturer’s instructions (Applied Biosystems). The expression levels of the individual isoforms were calculated using the ΔΔCt method with 4 endogenous controls (B2m, PGK1, β-actin, and TATA-box binding protein). Levels of significance were determined by a 2-sample equal-variance t test applied to the log-expression values. Nine significantly differentially expressed genes of the MAPK signaling pathway were validated using the following gene expression assays (Applied Biosystems): SMAD4 (Hs00929647_m1), MAX (Hs00231142_m1), PRKX (Hs00746337_s1), AKT2 (Hs01086102_m1), MRAS (Hs00171926_m1), ELK1 (Hs00428286_g1), SRF (Hs00182371_m1), PPP3CB (Hs00184176_m1), and MAP2K3 (Hs00177127_m1) and, 2 unaltered control genes, NTRK1 (Hs01021011_m1) and DUSP2 (Hs00358879_m1).
Gene ontology and pathway analysis.
Gene ontology and pathway analysis (KEGG pathways; ref. 26) was carried out using the DAVID functional annotation tool ( http://david.abcc.ncifcrf.gov/) and Pathway-Express as part of Onto-Tools ( http://vortex.cs.wayne.edu/ontoexpress/) scoring the pathways, with a significant P value/corrected gamma P value of less than 0.05 in both methods. This was performed individually for the HEK293/HeLa MYST4 siRNA expression data, the mouse Qkfgt/gt adult dorsal cortex versus control expression data, the mouse Qkfgt/gt E12.5 dorsal telencephalon versus control expression data, and the HEK293/HeLa MYST4 siRNA ChIP-CHIP data.
MEK, ERK, and AKT activation assays.
The patient cell line was transiently transfected with a human MYST4 wild-type construct (SC308942, Origene) using Lipofectamine 2000 (Invitrogen). Normalization of expression levels were measured by quantitative real-time PCR as mentioned above. Amounts of MEK1/2, ERK1/2, AKT, phospho-MEK1/2, phospho-ERK1/2, and phospho-AKT were determined by Western blotting of the cell lysates from patient and control lymphoblastoid cell lines as well as from the MYST4-transfected patient cell line. Cells were lysed (lysis buffer containing 50 mM Tris/HCl, pH 7.5, 100 mM NaCl, 2 mM MgCl2, 1% Igepal CA-630, 10% glycerol, 20 mM β-glycerolphosphate, 1 mM orthovanadate, EDTA-free inhibitor cocktail-Roche), and the lysates were cleared by centrifugation. For similar loading the protein amount was normalized by Bradford assay (Bio-Rad), and the proteins were separated by SDS-PAGE (10% polyacrylamide) and detected by Western blotting using antibodies against MEK1/2 (Cell Signaling Technology), ERK1/2 (Cell Signaling Technology), AKT (Cell Signaling Technology), phospho-MEK1/2 (Ser 217/221, Cell Signaling Technology), phospho-ERK1/2 (Thr202/Tyr204, Cell Signaling Technology), and phospho-AKT (Ser473, Cell Signaling Technology).
Statistics.
Quantitative real-time PCR statistical analysis was performed according to the ΔΔCt method. All experiments were performed in triplicate, and error bars represent SD unless otherwise stated. All statistical analysis of the expression and ChIP-CHIP results were generated with Partek Genomic Suite 6.5. These analyses were performed in triplicate, and the ANOVA calculation was applied to identify the fold changes of differentially expressed genes and the MAT score of ChIP-CHIP binding sites. Unless otherwise stated, P values of less than 0.05 were considered significant.
Study approval.
This study was approved by the Ethical Review Board of the Medical Faculty of the Friedrich-Alexander University Erlangen-Nuremberg. After written informed consent, peripheral blood samples for DNA and RNA extraction and cell culture were obtained from the family members.
Supplementary Material
Acknowledgments
We thank the family for giving their consent for this study. This study was supported by the IZKF grant E5 to A. Rauch, the BMBF network grant SKELNET (GFGM01141901) to A. Rauch and A. Reis, the DFG grant ZE524/4-1 to M. Zenker, the DFG grant TH896/3-1 to C.T. Thiel, and grants from the F.R.S.-FNRS and the Australian NHMRC. This work was performed as part of our research study addressing the genetics of mental retardation, which was approved by the research ethics committee of the Medical Faculty of the University of Erlangen-Nuremberg. M.R. Ahmadian was supported by the NGFNplus-program of the German Ministry of Science and Education [BMBF, grant 01GS08100] and the Research Committee of the Medical Faculty of the Heinrich-Heine University Düsseldorf.
Footnotes
Conflict of interest: The authors have declared that no conflict of interest exists.
Citation for this article: J Clin Invest. 2011;121(9):3479–3491. doi:10.1172/JCI43428.
Hamish Scott’s present address is: Department of Molecular Pathology, The Centre for Cancer Biology, The Institute of Medical and Veterinary Science and The Hanson Institute, SA Pathology, and The School of Medicine, The University of Adelaide, Australia.
References
- 1.Kornberg RD, Lorch Y. Twenty-five years of the nucleosome, fundamental particle of the eukaryote chromosome. Cell. 1999;98(3):285–294. doi: 10.1016/S0092-8674(00)81958-3. [DOI] [PubMed] [Google Scholar]
- 2.MacDonald VE, Howe LJ. Histone acetylation: where to go and how to get there. Epigenetics. 2009;4(3):139–143. doi: 10.4161/epi.4.3.8484. [DOI] [PubMed] [Google Scholar]
- 3.Ekwall K. Genome-wide analysis of HDAC function. Trends Genet. 2005;21(11):608–615. doi: 10.1016/j.tig.2005.08.009. [DOI] [PubMed] [Google Scholar]
- 4.Fraga MF, Esteller M. Towards the human cancer epigenome: a first draft of histone modifications. Cell Cycle. 2005;4(10):1377–1381. doi: 10.4161/cc.4.10.2113. [DOI] [PubMed] [Google Scholar]
- 5.Urdinguio RG, Sanchez-Mut JV, Esteller M. Epigenetic mechanisms in neurological diseases: genes, syndromes, and therapies. Lancet Neurol. 2009;8(11):1056–1072. doi: 10.1016/S1474-4422(09)70262-5. [DOI] [PubMed] [Google Scholar]
- 6.Thomas T, Dixon MP, Kueh AJ, Voss AK. Mof (MYST1 or KAT8) is essential for progression of embryonic development past the blastocyst stage and required for normal chromatin architecture. Mol Cell Biol. 2008;28(16):5093–5105. doi: 10.1128/MCB.02202-07. [DOI] [PMC free article] [PubMed] [Google Scholar]
- 7.Choudhary C, et al. Lysine acetylation targets protein complexes and co-regulates major cellular functions. Science. 2009;325(5942):834–840. doi: 10.1126/science.1175371. [DOI] [PubMed] [Google Scholar]
- 8.Tartaglia M, Zampino G, Gelb BD. Noonan syndrome: clinical aspects and molecular pathogenesis. Mol Syndromol. 2010;1(1):2–26. doi: 10.1159/000276766. [DOI] [PMC free article] [PubMed] [Google Scholar]
- 9.van der Burgt., I Noonan syndrome. Orphanet J Rare Dis. 2007;2:4. doi: 10.1186/1750-1172-2-4. [DOI] [PMC free article] [PubMed] [Google Scholar]
- 10.Burge C, Karlin S. Prediction of complete gene structures in human genomic DNA. J Mol Biol. 1997;268(1):78–94. doi: 10.1006/jmbi.1997.0951. [DOI] [PubMed] [Google Scholar]
- 11.Borrow J, et al. The translocation t(8;16)(p11;p13) of acute myeloid leukaemia fuses a putative acetyltransferase to the CREB-binding protein. Nat Genet. 1996;14(1):33–41. doi: 10.1038/ng0996-33. [DOI] [PubMed] [Google Scholar]
- 12.Reifsnyder C, Lowell J, Clarke A, Pillus L. Yeast SAS silencing genes and human genes associated with AML and HIV-1 Tat interactions are homologous with acetyltransferases. Nat Genet. 1996;14(1):42–49. doi: 10.1038/ng0996-42. [DOI] [PubMed] [Google Scholar]
- 13.Voss AK, Thomas T. MYST family histone acetyltransferases take center stage in stem cells and development. Bioessays. 2009;31(10):1050–1061. doi: 10.1002/bies.200900051. [DOI] [PubMed] [Google Scholar]
- 14.Yang XJ. The diverse superfamily of lysine acetyltransferases and their roles in leukemia and other diseases. Nucleic Acids Res. 2004;32(3):959–976. doi: 10.1093/nar/gkh252. [DOI] [PMC free article] [PubMed] [Google Scholar]
- 15.Yang XJ, Ullah M. MOZ and MORF, two large MYSTic HATs in normal and cancer stem cells. Oncogene. 2007;26(37):5408–5419. doi: 10.1038/sj.onc.1210609. [DOI] [PubMed] [Google Scholar]
- 16.Champagne N, et al. Identification of a human histone acetyltransferase related to monocytic leukemia zinc finger protein. J Biol Chem. 1999;274(40):28528–28536. doi: 10.1074/jbc.274.40.28528. [DOI] [PubMed] [Google Scholar]
- 17.Thomas T, Voss AK, Chowdhury K, Gruss P. MYST family histone acetyltransferase, is required for normal cerebral cortex development. Development. 2000;127(12):2537–2548. doi: 10.1242/dev.127.12.2537. [DOI] [PubMed] [Google Scholar]
- 18.Miller CT, Maves L, Kimmel CB. MOZ regulates Hox expression and pharyngeal segmental identity in zebrafish. Development. 2004;131(10):2443–2461. doi: 10.1242/dev.01134. [DOI] [PubMed] [Google Scholar]
- 19.Pelletier N, Champagne N, Stifani S, Yang XJ. MOZ and MORF histone acetyltransferases interact with the Runt-domain transcription factor Runx2. Oncogene. 2002;21(17):2729–2740. doi: 10.1038/sj.onc.1205367. [DOI] [PubMed] [Google Scholar]
- 20.Thomas T, et al. Monocytic leukemia zinc finger protein is essential for the development of long-term reconstituting hematopoietic stem cells. Genes Dev. 2006;20(9):1175–1186. doi: 10.1101/gad.1382606. [DOI] [PMC free article] [PubMed] [Google Scholar]
- 21.Thomas T, Voss AK. Querkopf, a histone acetyltransferase, is essential for embryonic neurogenesis. Front Biosci. 2004;9:24–31. doi: 10.2741/1208. [DOI] [PubMed] [Google Scholar]
- 22.Voss AK, Collin C, Dixon MP, Thomas T. Moz and retinoic acid coordinately regulate H3K9 acetylation, Hox gene expression, and segment identity. Dev Cell. 2009;17(5):674–686. doi: 10.1016/j.devcel.2009.10.006. [DOI] [PubMed] [Google Scholar]
- 23.Merson TD, et al. The transcriptional coactivator Querkopf controls adult neurogenesis. J Neurosci. 2006;26(44):11359–11370. doi: 10.1523/JNEUROSCI.2247-06.2006. [DOI] [PMC free article] [PubMed] [Google Scholar]
- 24.Rietze RL, Valcanis H, Brooker GF, Thomas T, Voss AK, Bartlett PF. Purification of a pluripotent neural stem cell from the adult mouse brain. Nature. 2001;412(6848):736–739. doi: 10.1038/35089085. [DOI] [PubMed] [Google Scholar]
- 25.Lee KK, Workman JL. Histone acetyltransferase complexes: one size doesn’t fit all. Nat Rev Mol Cell Biol. 2007;8(4):284–295. doi: 10.1038/nrm2145. [DOI] [PubMed] [Google Scholar]
- 26.Kanehisa M, et al. KEGG for linking genomes to life and the environment. Nucleic Acids Res. 2008;36(Database issue):D480–D484. doi: 10.1093/nar/gkm882. [DOI] [PMC free article] [PubMed] [Google Scholar]
- 27.Chang L, Karin M. Mammalian MAP kinase signalling cascades. Nature. 2001;410(6824):37–40. doi: 10.1038/35065000. [DOI] [PubMed] [Google Scholar]
- 28.Nishida E, Gotoh Y. The MAP kinase cascade is essential for diverse signal transduction pathways. Trends Biochem Sci. 1993;18(4):128–131. doi: 10.1016/0968-0004(93)90019-J. [DOI] [PubMed] [Google Scholar]
- 29.Pearson G, et al. Mitogen-activated protein (MAP) kinase pathways: regulation and physiological functions. Endocr Rev. 2001;22(2):153–183. doi: 10.1210/er.22.2.153. [DOI] [PubMed] [Google Scholar]
- 30.Cirstea IC, et al. A restricted spectrum of NRAS mutations causes Noonan syndrome. Nat Genet. 2010;42(1):27–29. doi: 10.1038/ng.497. [DOI] [PMC free article] [PubMed] [Google Scholar]
- 31.Rodriguez-Viciana P, Oses-Prieto J, Burlingame A, Fried M, McCormick F. A phosphatase holoenzyme comprised of Shoc2/Sur8 and the catalytic subunit of PP1 functions as an M-Ras effector to modulate Raf activity. Mol Cell. 2006;22(2):217–230. doi: 10.1016/j.molcel.2006.03.027. [DOI] [PubMed] [Google Scholar]
- 32.Bobick BE, Kulyk WM. Regulation of cartilage formation and maturation by mitogen-activated protein kinase signaling. Birth Defects Res C Embryo Today. 2008;84(2):131–154. doi: 10.1002/bdrc.20126. [DOI] [PubMed] [Google Scholar]
- 33.Corson LB, Yamanaka Y, Lai KM, Rossant J. Spatial and temporal patterns of ERK signaling during mouse embryogenesis. Development. 2003;130(19):4527–4537. doi: 10.1242/dev.00669. [DOI] [PubMed] [Google Scholar]
- 34.Kawakami Y, et al. MKP3 mediates the cellular response to FGF8 signalling in the vertebrate limb. Nat Cell Biol. 2003;5(6):513–519. doi: 10.1038/ncb989. [DOI] [PubMed] [Google Scholar]
- 35.Keren A, Tamir Y, Bengal E. The p38 MAPK signaling pathway: a major regulator of skeletal muscle development. Mol Cell Endocrinol. 2006;252(1–2):224–230. doi: 10.1016/j.mce.2006.03.017. [DOI] [PubMed] [Google Scholar]
- 36.Takeda K, Ichijo H. Neuronal p38 MAPK signalling: an emerging regulator of cell fate and function in the nervous system. Genes Cells. 2002;7(11):1099–1111. doi: 10.1046/j.1365-2443.2002.00591.x. [DOI] [PubMed] [Google Scholar]
- 37.Gonzalez I, et al. Akt2, a novel functional link between p38 mitogen-activated protein kinase and phosphatidylinositol 3-kinase pathways in myogenesis. Mol Cell Biol. 2004;24(9):3607–3622. doi: 10.1128/MCB.24.9.3607-3622.2004. [DOI] [PMC free article] [PubMed] [Google Scholar]
- 38.Fuentealba LC, et al. Integrating patterning signals: Wnt/GSK3 regulates the duration of the BMP/Smad1 signal. Cell. 2007;131(5):980–993. doi: 10.1016/j.cell.2007.09.027. [DOI] [PMC free article] [PubMed] [Google Scholar]
- 39.Li B. Bone morphogenetic protein-Smad pathway as drug targets for osteoporosis and cancer therapy. Endocr Metab Immune Disord Drug Targets. 2008;8(3):208–219. doi: 10.2174/187153008785700127. [DOI] [PubMed] [Google Scholar]
- 40.Kojima K, et al. A novel fusion variant of the MORF and CBP genes detected in therapy-related myelodysplastic syndrome with t(10;16)(q22;p13). Br J Haematol. 2003;120(2):271–273. doi: 10.1046/j.1365-2141.2003.04059.x. [DOI] [PubMed] [Google Scholar]
- 41.Moore SD, et al. Uterine leiomyomata with t(10;17) disrupt the histone acetyltransferase MORF. Cancer Res. 2004;64(16):5570–5577. doi: 10.1158/0008-5472.CAN-04-0050. [DOI] [PubMed] [Google Scholar]
- 42.Panagopoulos I, et al. Fusion of the MORF and CBP genes in acute myeloid leukemia with the t(10;16)(q22;p13). Hum Mol Genet. 2001;10(4):395–404. doi: 10.1093/hmg/10.4.395. [DOI] [PubMed] [Google Scholar]
- 43.Van Beekum O, Kalkhoven E. Aberrant forms of histone acetyltransferases in human disease. Subcell Biochem. 2007;41:233–262. [PubMed] [Google Scholar]
- 44.Shaw AC, Kalidas K, Crosby AH, Jeffery S, Patton MA. The natural history of Noonan syndrome: a long-term follow-up study. Arch Dis Child. 2007;92(2):128–132. doi: 10.1136/adc.2006.104547. [DOI] [PMC free article] [PubMed] [Google Scholar]
- 45.Sznajer Y, et al. The spectrum of cardiac anomalies in Noonan syndrome as a result of mutations in the PTPN11 gene. Pediatrics. 2007;119(6):e1325–e1331. doi: 10.1542/peds.2006-0211. [DOI] [PubMed] [Google Scholar]
- 46.Zenker M, et al. Expansion of the genotypic and phenotypic spectrum in patients with KRAS germline mutations. J Med Genet. 2007;44(2):131–135. doi: 10.1136/jmg.2006.046300. [DOI] [PMC free article] [PubMed] [Google Scholar]
- 47.Roberts AE, et al. Germline gain-of-function mutations in SOS1 cause Noonan syndrome. Nat Genet. 2007;39(1):70–74. doi: 10.1038/ng1926. [DOI] [PubMed] [Google Scholar]
- 48.Huangfu D, et al. Induction of pluripotent stem cells by defined factors is greatly improved by small-molecule compounds. Nat Biotechnol. 2008;26(7):795–797. doi: 10.1038/nbt1418. [DOI] [PMC free article] [PubMed] [Google Scholar]
- 49.Marchion D, Munster P. Development of histone deacetylase inhibitors for cancer treatment. Expert Rev Anticancer Ther. 2007;7(4):583–598. doi: 10.1586/14737140.7.4.583. [DOI] [PubMed] [Google Scholar]
- 50.Wiech NL, Fisher JF, Helquist P, Wiest O. Inhibition of histone deacetylases: a pharmacological approach to the treatment of non-cancer disorders. Curr Top Med Chem. 2009;9(3):257–271. doi: 10.2174/156802609788085241. [DOI] [PubMed] [Google Scholar]
- 51. Kaufman M.The Atlas Of Mouse Development . New York, New York, USA: Academic Press; 1995. [Google Scholar]
- 52.Voss AK, Thomas T, Gruss P. Efficiency assessment of the gene trap approach. Dev Dyn. 1998;212(2):171–180. doi: 10.1002/(SICI)1097-0177(199806)212:2<171::AID-AJA3>3.0.CO;2-E. [DOI] [PubMed] [Google Scholar]
- 53.Voss AK, Thomas T, Gruss P. Mice lacking HSP90beta fail to develop a placental labyrinth. Development. 2000;127(1):1–11. doi: 10.1242/dev.127.1.1. [DOI] [PubMed] [Google Scholar]
- 54.Smyth GK. Linear models and empirical bayes methods for assessing differential expression in microarray experiments. Stat Appl Genet Mol Biol. 2004;3:Article3. doi: 10.2202/1544-6115.1027. [DOI] [PubMed] [Google Scholar]
- 55.Smyth GK, Michaud J, Scott HS. Use of within-array replicate spots for assessing differential expression in microarray experiments. Bioinformatics. 2005;21(9):2067–2075. doi: 10.1093/bioinformatics/bti270. [DOI] [PubMed] [Google Scholar]
Associated Data
This section collects any data citations, data availability statements, or supplementary materials included in this article.


