Abstract
We have developed a fast, simple, and accurate DNA-based screening method to identify the fish species present in fresh and processed seafood samples. This versatile method employs PCR amplification of genomic DNA extracted from fish samples, followed by restriction fragment length polymorphism (RFLP) analysis to generate fragment patterns that can be resolved on the Agilent 2100 Bioanalyzer and matched to the correct species using RFLP pattern matching software.
The fish identification method uses a simple, reliable, spin column- based protocol to isolate DNA from fish samples. The samples are treated with proteinase K to release the nucleic acids into solution. DNA is then isolated by suspending the sample in binding buffer and loading onto a micro- spin cup containing a silica- based fiber matrix. The nucleic acids in the sample bind to the fiber matrix. The immobilized nucleic acids are washed to remove contaminants, and total DNA is recovered in a final volume of 100 μl. The isolated DNA is ready for PCR amplification with the provided primers that bind to sequences found in all fish genomes. The PCR products are then digested with three different restriction enzymes and resolved on the Agilent 2100 Bioanalyzer. The fragment lengths produced in the digestion reactions can be used to determine the species of fish from which the DNA sample was prepared, using the RFLP pattern matching software containing a database of experimentally- derived RFLP patterns from commercially relevant fish species.
Protocol
1: Prepare the Fish Samples for DNA Extraction
For each fish sample to be tested, place a piece of the fish tissue, weighing between 10 mg and 1 g (raw or cooked), into a single 1.5-ml microcentrifuge tube. Use the figure below as a guideline for estimating the weight of a raw fish sample based on sample size.
 Figure 1. Mass Estimations of Fish Samples Based on Sample Size.
Pre-warm the Proteinase K Digestion Buffer to 65°C for 5 minutes in an incubator or water bath.
Prepare a working solution of Proteinase K by combining 200 μl of Proteinase K Digestion Buffer and 20 μl of Proteinase K per sample. Note: Prepare a fresh working solution of Proteinase K before each use.
Add 220 μl of the Proteinase K working solution to each 1.5-ml tube of fish sample. Incubate the tubes at 65°C for 10 minutes in an incubator or water bath.
Spin the tubes in a microcentrifuge for 3 5 minutes at 14,000 x g to pellet any undigested tissues.
Transfer 150 μl of each supernatant into a fresh 1.5-ml tube. Avoid transferring any undigested material from the bottom of the tube or any oily material that may be present at the top of the tube. These tubes of supernatant are the samples from which genomic DNA will be extracted.
2: Extract Genomic DNA
In a sterile container (polypropylene tube or glass bottle), prepare a working solution of sulfolane and Nucleic Acid Binding Buffer by combining 320 μl of 90% sulfolane and 170 μl of Nucleic Acid Binding Buffer per sample. You may want to prepare a sufficient quantity of this mixture to process as many samples as you plan to examine within the next 4 weeks. This mixture can be stored for up to 30 days at room temperature. Avoid exposing the mixture to light during storage.
Add 490 μl of the sulfolane/Binding Buffer mixture (prepared in step 1 above) to each fish sample. Vortex or pipet the sample repeatedly until homogenized. The addition of this mixture will bring the total volume of each sample to 640 μl.
Transfer each sample to a DNA Binding Spin Cup that has been seated within a 2-ml receptacle tube (provided) and snap the cap of the tube onto the top of the spin cup.
Spin the samples in a microcentrifuge for 1 minute at 14,000 x g to load the DNA onto the spin cup matrix.
Remove and retain the spin cups and discard the filtrates. For each sample, replace the spin cup in the receptacle tube, then add 500 μl of 1x High Salt Wash Buffer and cap the tube.
Spin the samples in a microcentrifuge at 14,000 x g for 1 minute.
Remove and retain the spin cups and discard the filtrates. For each sample, replace the spin cup in the receptacle tube, then add 500 μl of 80% ethanol and cap the tube.
Spin the samples in a microcentrifuge at 14,000 x g for 1 minute.
Repeat steps 7 and 8 two more times for a total of 3 washes with 500 μl of 80% ethanol.
After the third wash in 80% ethanol, remove and retain the spin cups and discard the filtrates. Replace the spin cups in their receptacle tubes and spin in a microcentrifuge for 2 minutes at 14,000 x g to dry the fiber matrix.
Transfer the spin cups to 1.5-m1 collection tubes. Add 100 μl of Elution Buffer to each spin cup directly on the fiber matrix inside the cup. Snap the caps of the collection tubes onto the spin cups and incubate at room temperature for 1 minute.
Spin the samples in a microcentrifuge at maximum speed for 1 minute.
The purified DNA is in the Elution Buffer in the microcentrifuge tube. Discard the spin cup and cap the tubes. The DNA may be stored at 4°C for up to one month. For long-term storage, store the DNA at 20°C or 80°C.
If desired, you may measure the concentration of the DNA samples in a spectrophotometer.
The genomic DNA extraction protocol typically yields samples with a concentration ranging from 5 ng/μl to 500 ng/μl. The PCR-RFLP protocol works wells with DNA samples ranging anywhere from 0.05 ng/μl to 2000 ng/μl.
3: Set up the PCR Reactions
Prepare a 50 ng/μl dilution of the positive control salmon DNA by combining 8 μl of the DNA stock with 32 μl of sterile, DNase-free water. Vortex to mix. The diluted sample may be stored at 4°C for future use.
- Prepare the reactions by combining the components in the table below in order. Prepare a single reagent mixture for all PCR reactions that will be run simultaneously by scaling up the volumes listed in the table. In addition to the test DNA samples, include a positive control reaction and a no-template control reaction. Preparing duplicate PCR reactions for each test DNA sample is recommended. Prepare enough reagent mixture for all your reactions plus one reaction volume excess. For example, if you have 5 test DNA samples, prepare enough reagent mixture for either 8 reactions (5 test reactions, 1 positive control, 1 no-template control, and 1 excess) or 13 reactions if you are including duplicates of the test reactions (10 duplicate test reactions, 1 positive control, 1 no-template control and 1 excess).PCR Reagent Mixture
Component Volume 1 Reaction Volume 5 Reactions dH2O, sterile 9 μl 45 μl 2x PCR Master Mix 12.5 μl 62.5 μl Primer Mix 2.5 μl 12.5 μl Total volume 24 μl 120 μl Vortex the reagent mixture well, then distribute 24 μl to each individual thin-walled PCR reaction tube.
Add 1 μl of the diluted positive control DNA to the positive control reaction tube. To the test sample tubes, add 1 μl of test DNA sample. For the no-template control reaction, add 1 μl of DNase-free water in place of the DNA.To avoid cross-contamination, use a fresh pipet tip for each DNA sample. After adding the sample, mix the reaction by quickly pipetting the contents of the tube up and down.
Cap the reaction tubes, vortex the tubes to mix and centrifuge the tubes briefly.
4: Run the PCR Protocol
- Place the reactions in the thermal cycler and run the PCR program shown below. PCR Cycling Protocol
Segment Number of Cycles Temperature Duration 1 1 95°C 5 minutes 2 40 95°C50°C72°C 30 seconds30 seconds30 seconds 3 1 72°C 7 minutes
5: Digest PCR Products with Restriction Enzymes
Label the 0.5-ml tubes or 0.2-ml strip tubes that are to be used for the restriction digest reactions. Each PCR reaction will be digested with three different restriction enzymes: DdeI, HaeIII and NlaIII. Therefore, for each PCR reaction, label three separate tubes with the name of the PCR sample and the name of the restriction enzyme.
- Prepare the reagent mixture for the DdeI digestions by combining the components below in order. Prepare a single reagent mixture for all DdeI digestion reactions (plus at least one reaction volume excess) using multiples of each component. Once the PCR is complete, the PCR reactions are treated with restriction enzymes for restriction fragment length polymorphism (RFLP) analysis. DdeI Digestion Reagent Mixture
Component Volume dH2O, sterile 1.5 μl 10x DdeI Buffer 0.5 μl 10x DdeI enzyme 0.5 μl Vortex the reagent mixture well, then distribute 2.5 μl to the individual reaction tubes that were labeled for DdeI.
- Prepare the reagent mixture for the HaeIII digestions by combining the components below in order. Prepare a single reagent mixture for all HaeIII digestion reactions (plus at least one reaction volume excess) using multiples of each component. HaeIII Digestion Reagent Mixture
Component Volume dH2O, sterile 1.5 μl 10x HaeIII Buffer 0.5 μl 10x HaeIII enzyme 0.5 μl Vortex the reagent mixture well, then distribute 2.5 μl to the individual reaction tubes that were labeled for HaeIII.
- Prepare the reagent mixture for the NlaIII digestions by combining the components below in order. Prepare a single reagent mixture for all NlaIII digestion reactions (plus at least one reaction volume excess) using multiples of each component. NlaIII Digestion Reagent Mixture
Component Volume dH2O, sterile 1.5 μl 10x NlaIII Buffer 0.5 μl 10x NlaIII enzyme 0.5 μl Vortex the reagent mixture well, then distribute 2.5 μl to the individual reaction tubes that were labeled for NlaIII.
For each digestion reaction, add 2.5 μl of the appropriate PCR product to the labeled tubes. All of the test PCR reactions as well as the positive control reaction need to be digested with all three restriction enzymes.
Vortex the digestion reactions and then briefly centrifuge the tubes.
Incubate all the digestion reactions at 37°C for 2 hours. This incubation can be performed in the thermal cycler. If desired, reactions may be left at 37°C overnight.
Transfer the reactions to 65°C for 15 minutes. This step can be performed in the thermal cycler.
Add 1 μl of 60 mM EDTA (provided with the kit) to each reaction and vortex well.
6: Analyze the restriction digest patterns
Prepare the gel-dye mix, place a DNA chip on the chip priming station, and load the mix onto the DNA chip.
Pipet 5 μl of DNA marker into the well marked with the ladder symbol and into each of the 12 sample wells on the chip. DNA marker is provided in the DNA 1000 Reagent Kit in a green-capped tube.
Pipet 1 μl of DNA ladder into the well marked with a ladder symbol. DNA ladder is provided in the DNA 1000 Reagent Kit in a yellow-capped tube.
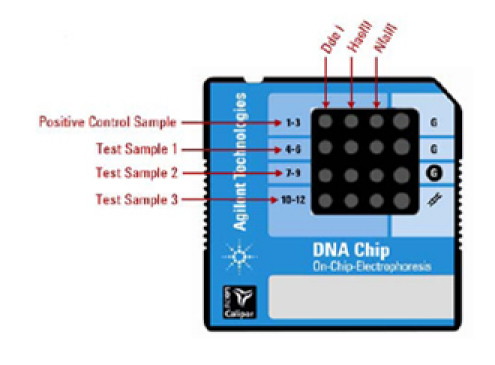
For each of the DNA samples, pipet 1 μl of each restriction digest reaction into one of the 12 sample wells on the chip according to the guidelines in the figure below. Using this approach, wells 1-3 are for the 3 digestion reactions for the positive control sample, wells 4-6 are for the 3 digestion reactions for test sample 1, wells 7-9 are for the 3 digestion reactions for test sample 2, and wells 10-12 are for the 3 digestion reactions for test sample 3.Analyze the restriction digest reactions on the Agilent 2100 Bioanalyzer to determine the fragment lengths produced during digestion. The Agilent DNA 1000 Kit Guide has complete instructions for running the lab chips on the Bioanalyzer. A brief protocol is provided below for your convenience.
 Figure 2. Organization of Samples on Chip.
If you have less than 4 DNA samples, pipet 1 μl of water into the unused wells. If you have more than 4 DNA samples, you will need to run more than one chip. Note that it is not necessary to run the positive control sample on every chip.
Figure 2. Organization of Samples on Chip.
If you have less than 4 DNA samples, pipet 1 μl of water into the unused wells. If you have more than 4 DNA samples, you will need to run more than one chip. Note that it is not necessary to run the positive control sample on every chip.Place the chip horizontally in the adapter of the IKA vortex mixer and vortex for 60 seconds at 2400 rpm.
Insert the chip into the Agilent 2100 Bioanalyzer and start the chip run. The incoming raw signals are displayed in the Instrument context. After the run has finished, peaks are identified for all samples using the settings of the peak find algorithm. If you believe the algorithm has failed to detect a genuine peak, you may lower the Height Threshold setpoint to a value that allows the algorithm to identify the peak.
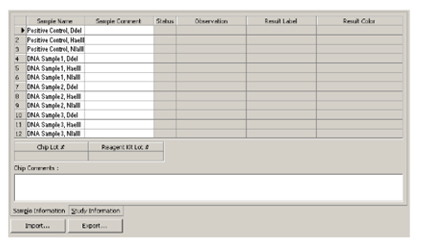
Go to the Assay context and select the Chip Summary tab. In the Sample Name field, enter a sample name for all 12 wells on the chip as shown in the figure below.
 Figure 3. Sample Name Entry in Chip Summary Tab.
7: Identify the test sample species using RFLP Matcher
The Agilent software application RFLP Decoder may be used to identify the fish species for the test DNA samples based on the fragment lengths produced in the digestion reactions. Table 7 Expected DNA Fragment Sizes in the Positive Control Restriction Enzyme Expected Product Size (bp) DdeI 117, 332, 340 HaeIII 40, 105, 333 NlaIII 459 The instructions provided here use the default analysis settings in RFLP Matcher. Refer to the software s help system for detailed information on operating the software and interpreting the display.
Launch the RFLP Decoder program.
Click File > Open > XAD File. The Open dialog box will open.
Select the XAD file for the DNA chip that included the restriction digest reactions. Click Open. A dialog box will open listing the samples that were loaded on the chip.
Select three digestion reactions corresponding to one DNA sample and specify the appropriate restriction enzyme for each sample using the drop-down menus under the Enzyme column. In the figure below, the Enzyme column has been filled out for DNA Sample 1.
 Figure 4. Specifying Restriction Enzyme for each Sample.
In the field labeled min peak height as % of lower marker", the default value is 10.0%. If needed, this value may be lowered to identify small peaks that was missed, or raised to discard peaks resulting from non-specific noise in the electropherogram. Click Reintegrate after making any adjustments to the min peak height value.
 Figure 5. Assigning Minimum Peak Height.
Click Calc at the bottom of the dialog box. The fragment length data obtained from the Bioanalyzer run will populate the software fields.
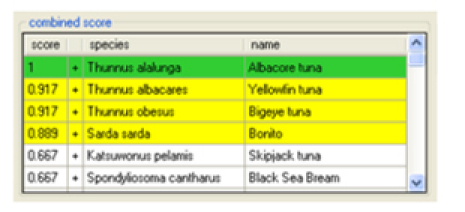
In the score drop-down list in the top left corner of the screen, select the appropriate algorithm for analysis of the data. If the fish sample being analyzed consists of a single fish species, select Dice (Nei Li) in the score drop-down list. If the samples may consist of a mixture of species, select Mixture. The table at the bottom of the screen labeled combined score lists the best species matches based on the results of all three digestion reactions. The species name as well as the common name are listed in the table (see below). Perfect matches (those with a score of 1) are highlighted in green. Matches highlighted in yellow are considered near matches. You may double-click on a species name to bring up the FishBase webpage for that species.
 Figure 6. Species Identification Based on Digestion.
In the lower cutoff and match tolerance fields at the top of the screen, you may adjust the default settings to improve the score of the best species match. The lower cutoff value is used to discard any fragments shorter than the length designated in the field. The match tolerance value determines how close in length a fragment must be to the predicted fragment to be considered a match.
Repeat steps 4 through 8 for the remaining DNA samples that were included on this same chip.
8: Representative Results:
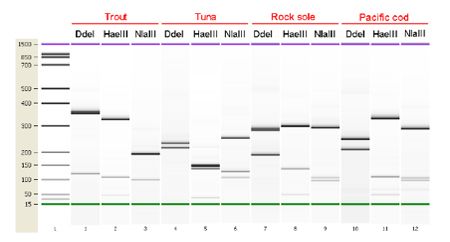
An image of a Bioanlyzer gel with restriction digest samples from 4 different fish species is shown in the figure below. The expected results for the positive DNA sample are summarized in the table below.
 Figure 7. Bioanalyzer gel image of restriction digest reaction samples. Each gel lane is labeled with the restriction enzyme used in that reaction.
Expected DNA Fragment Sizes in the Salmon Positive Control
 Figure 8. Expected DNA Fragment Sizes in the Salmon Positive Control.
Discussion
We demonstrate a simple, fast, and accurate DNA-based screening method for the identification of fish species in seafood products. This powerful method provides reproducible, precise results in less than one working day and it can be implemented in commercial testing facilities due to streamlined protocols and simple setup. It is characterized by the generation of objective data that is analyzed using RFLP Decoder software with an expandable database of experimentally-derived fish species profiles.
With routine implementation, this testing method has the potential to prevent mislabeling of seafood products and assist in maintaining accurate records suitable for compliance with governmental regulations.
Acknowledgments
Agilent Stratagene Products Division
Harini Ravi
Natalia Novorodovskaya
Scott Basehore
Jeff Braman
Rachel Formosa
Ronda Allen
Rajesh Bagga
Derek Hall
Sarah Jandle
Danielle Huffman
Agilent Laboratories
Robert Kincaid
Mary McBride
Agilent Europe
Nigel Skinner
Juergen Schneider
Stephen Mueller
Martin Kratzmeier
Campden BRI
Steve Garrett
References
- Dooley JJ, Sage HD, Brown HM, Garrett SD. Improved fish species identification by use of lab-on-a-chip technology. Food Control. 2004;16(7):601–607. [Google Scholar]
- Dooley JJ, Sage HD, Clarke M-AL, Brown HM, Garrett SD. Fish species Identification Using PCR-RFLP Analysis and Lab-on-a-Chip Capillary Electrophoresis: Application to Detect White Fish Species in Food Products and an Interlaboratory Study. J. Agric. Food Chem. 2005;53:3348–3357. doi: 10.1021/jf047917s. [DOI] [PubMed] [Google Scholar]
- Dooley J, Garrett S. Determination of PCR-RFLP Profiles for Fish Species Using the Agilent 2100 Bioanalyzer. Agilent Technologies Application Note. 2005 [Google Scholar]
- Dooley JJ, Clarke ML, Sage HD, Brown HM, Garrett SD. Application of a chip-based capillary electrophoresis system to enable simple PCR-RFLP identification of fish species. FSA Final Report Q01069. 2004 [Google Scholar]


