

Abstract
The majority of natural history studies of human immunodeficiency virus (HIV) infection have immune and viral parameters in men. Data demonstrating that women have lower HIV-1 RNA levels than men at the same CD4 cell counts have raised the question of immunologic differences in HIV-seropositive women. This study describes levels and changes in phenotypic markers of immune maturity, function, and activation in the CD4 and CD8 cell subsets in HIV-seropositive and high-risk HIV-seronegative women. Our primary hypothesis was that activation levels would be significantly higher among illicit drug users. However, results showed that HIV-1 RNA level was the strongest predictor of marker level and that both HIV-1 RNA level and CD4 cell count were independently associated with CD4 activation, but illicit drug use was not. In summary, this study demonstrated that immune activation was a significant pathogenic feature in women and that activation was driven by HIV infection and not illicit drug use.
The institution of highly active antiretroviral therapy (HAART) has had a significant impact on the course of human immunodeficiency virus (HIV) disease and has clearly modified how we evaluate immune and viral parameters in the context of natural history studies [1]. However, the majority of the studies evaluating immunopathogenic features of HIV infection have included few women or were performed in cohorts of HIV-seropositive men [2–4]. With the recent demonstration that women have lower HIV-1 RNA levels than men at common CD4 thresholds, it has become essential to assess immune changes in HIV-seropositive women in relation to HIV-1 RNA level, immunologic stage of disease, and therapeutic intervention [5, 6]. Although the mechanism for observed differences in outcome between men and women is not defined, alterations in markers that define the activation level of CD4 and CD8 T cells, memory and naive cells, and those that define functional immune subsets may be quite different in women, compared with men, because of inherent biologic differences. For example, the level of immune activation seen among T cell subsets, which has been clearly shown to be an important pathogenic feature that leads to CD4 T cell loss and a predictor of host response to antiviral therapy [7–11], may be higher in women with lower RNA thresholds. It already has been demonstrated that persistent levels of immune activation in subjects with undetectable plasma virus levels may be predictive of virologic failure [11]. Markers of immune maturation that define CD4 and CD8 memory and naive T cells also can be variably influenced by the plasma HIV RNA level, leading to loss of important functional immune responses and subsequent development of opportunistic infections or malignancies [12–14]. There are additional functional molecules (CD28) present on CD4 and CD8 T cells that are required for T cell interaction with antigen-presenting cells [15–17]. Finally, the Fas antigen, which is functionally involved in the process of apoptosis, is another critical surface antigen influenced by viral replication [18–20]. Although the relationship between the level of viral replication and changes in these markers has been extensively studied, few studies have been performed in cohorts of women. This study of a cohort of HIV-seropositive and high-risk HIV-seronegative women was undertaken to prospectively evaluate immunophenotypic marker changes of lymphocyte populations in relation to HIV-1 RNA level and various demographic and behavioral features. The study was designed to address the hypothesis that women who use illicit drugs will have increased levels of immune activation because of chronic antigenic stimulation, with increased loss in CD4 T cell populations.
Methods
Study population
The Women's Interagency HIV Study (WIHS) is a prospective multicenter study that was established in August 1993 to conduct comprehensive investigations of the impact of HIV infection on women. The organization and epidemiologic features of the WIHS have been described elsewhere [21]. A total of 2059 HIV-seropositive and 569 HIV-seronegative women were enrolled at 6 clinical sites between 1 October 1994 and 15 November 1995. Participants were evaluated at 6-month intervals. Standardized interview instruments were used to determine behavioral and demographic characteristics and antiretroviral medication use. CD4 cell count was measured for all study participants, and HIV-1 RNA level was measured for all HIV-seropositive women. A subgroup of HIV-seropositive women (n = 302) was selected for the current prospective study on the basis of 3 major patterns of drug use, which were self-reported at WIHS visits 1 and 2: (1) women who reported no history of either injection drug use (IDU) or non-IDU of crack, cocaine, or heroin (CCH) at any time in their past (n = 96); (2) women who reported non-IDU of CCH in the 6 months preceding 1 or both visits but gave no history of any IDU (n = 109); and (3) women who reported IDU in the 6 months before 1 or both visits (n = 97). These women were stratified according to CD4 cell count (0–200, 201–500, and >500 cells/mm3) and number of lifetime male sex partners (1–3, 4–10, and >10 male sex partners). HIV-1–seronegative women (n = 79) were selected as control subjects and also were stratified according to the 3 major drug-use groups (no use [n = 26]; CCH [n = 32]; and IDU [n = 21]) and number of male sex partners; in addition, they were chosen to parallel, when feasible, the drug groups, number of sex partners, age, and geographic site of the HIV-seropositive women. Of the eligible women, 228 HIV-seropositive women (75%) and 58 HIV-seronegative women (73%) remained in active follow-up during the recruitment period (31 March 1998 to 2 March 2001). Of the women who remained in active follow-up, 176 HIV-seropositive women (77%) and 48 HIV-seronegative women (83%) agreed to participate in the study, and a written informed consent was obtained from all patients, and human experimentation guidelines of the US Department of Health and Human Services were followed. Participants were asked to give additional information related to drug use, to consent to urine toxicology for cocaine and opiates, and to donate additional specimens for a specialized panel of immunophenotypic markers of immune maturation, function, and activation.
Laboratory methods
HIV antibody status was determined by EIA and confirmed by Western blot for all study participants at enrollment into WIHS and for all HIV-seronegative women at each follow-up visit. Plasma HIV RNA levels were determined on blood samples processed within 6 h of collection by use of the isothermal nucleic acid sequence–based amplification method (BioMerieux) at laboratories participating in the National Institutes of Health (NIH) Virology Quality Assurance program. The lower limit of detection was 400 copies/mL for samples tested from March 1998 through January 1999 and was 80 copies/mL subsequently [22, 23]. CD4 and CD8 T cells were determined by standard flow cytometric methods in laboratories participating in the AIDS Clinical Trials Group (ACTG) quality assurance program and were certified by the Flow Cytometry Quality Assessment Program of the National Institute for Allergy and Infectious Diseases (NIAID) [24]. CD4 and CD8 subset analyses were performed as described elsewhere [25]. In brief, EDTA-anticoagulated whole blood was obtained, and 100 μL were aliquoted per tube. The following monoclonal antibody combinations (PharMingen) were added to each tube and incubated at room temperature for 15 min: HLA-DR/CD38 (activation), CD45RA/CD62L (memory/naive) and CD28/CD95 (functional) for CD4 and CD8 subsets. After this incubation, red blood cells were lysed, and cells were washed with PBS containing 3% fetal bovine serum and 1% sodium azide. Samples were fixed in 1% paraformaldehyde for analysis on a FACSCalibur Flow Cytometer (Becton Dickinson).
Statistical analyses: identification of factors associated with marker levels
The primary goal of this study was to investigate the relationship between HIV-1 RNA level and markers of immune activation, maturation, and function, and to describe the impact of other HIV-specific (CD4 cell count and use of HAART), demographic (age and race), and behavioral (illicit drug use, smoking status, alcohol use, and number of lifetime male sex partners) factors on these relationships.
We performed separate analyses on baseline marker levels and on longitudinal data collected every 6 months over a 3-year period. All factors were categorized for the baseline analysis. We first compared demographic and behavioral characteristics and marker levels between HIV-seronegative and HIV-seropositive women. Then we investigated relationships between all factors and marker levels among HIV-seropositive women only. We used the SAS GENMOD procedure (SAS Institute) for repeated measures to perform longitudinal analysis on HIV-seropositive women only. For the univariate analysis, we included factors that were statistically significant from the baseline analysis or were of particular interest. For the multivariate analysis, we included only factors that were statistically significant from the univariate analysis. We specified models for a total of 12 markers and used a nominal significance level of P = .005 to adjust for multiple comparisons. We considered .005 < P < .05 to be suggestive. We treated HIV-1 RNA level, CD4 cell count, and age as both categorical and continuous in univariate models and as continuous in multivariate models.
Factors that were of particular interest were use of HAART and illicit drug use. We defined 4 HAART groups: (1) women who were HAART-inexperienced throughout the study period; (2) women who initiated HAART after baseline; (3) women who initiated HAART within 1 year before baseline; and (4) women who initiated HAART >1 year before baseline. We used available toxicology results to validate self-reported illicit drug use. Illicit drug use was defined as IDU or non-IDU of crack, cocaine, or heroin and was reported at each 6-month study visit. For the baseline analysis, we defined 3 drug use groups: (1) women who never reported drug use; (2) women whose last reported drug use was >1 year before baseline; and (3) women who reported drug use at least once within 1 year before baseline or during the study period. For the univariate analysis, we defined 3 drug use groups: (1) women who did not report drug use during the study period; (2) women who reported drug use intermittently; and (3) women who reported drug use at every visit. For univariate and multivariate analysis, we also treated drug use as a time-dependent dichotomous variable (i.e., any drugs vs. no drugs assessed at each 6-month time interval).
Impact of HIV-1 RNA level change on change in marker level
Average 6-month changes in levels for 12 markers and in log10 HIV-1 RNA level over the 3-year study period were estimated for each of the 176 HIV-seropositive women as slopes from a linear regression model. We then specified 12 linear models with marker slopes as the outcome and baseline HIV-1 RNA level and HIV-1 RNA level slopes as predictors. P < .005 was considered to be significant, and .005 < P < .05 was considered to be suggestive.
Results
The demographic and behavioral features for the HIV-seropositive and HIV-seronegative participants were similar by design (table 1). HIV-seropositive women had a longer median follow-up time, equivalent to 1 observation (2.0 vs. 1.5 years; P < .0001). The median log10 HIV-1 RNA level among HIV-seropositive women was 3.56, equivalent to 3650 copies/mL, and about half reported use of HAART during the previous 6 months. Significant differences were noted in a majority of the CD4 and CD8 populations examined at baseline. HIV-seropositive women had significantly higher CD4 cell counts and significantly lower CD8 cell counts, with the exception of CD8-naive cells (234 vs. 260; P = .38). HIV-seropositive women had significantly lower expression of CD28+ (43% vs. 67.5%; P < .0001) and significantly higher expression of CD95+ (75% vs. 57%; P < .0001) on CD8+ T cells, but corresponding differences with CD4 T cells were not significant. In terms of activation, HIV-seropositive women had significantly elevated levels of CD38+/DR+ in both CD4 T cells (12% vs. 3%; P < .0001) and CD8 T cells (49.5% vs. 11%; P < .0001).
Table 1. Comparison of baseline demographics and marker levels for human immunodeficiency virus (HIV)–seronegative vs. HIV-seropositive women.
| Characteristic | HIV-seronegative women (n = 48) |
HIV-seropositive women (n = 176) |
Pa |
|---|---|---|---|
| Duration of follow-up, median years (range) | 1.5 (0–2.3) | 2.0 (0–2.8) | <.0001 |
| Age, median years (range) | 37 (24–57) | 38 (25–60) | .45 |
| Race/ethnicity | |||
| Black | 27 (56) | 101 (57) | .51 |
| Latina | 12 (25) | 34 (19) | |
| White/other | 8 (17) | 41 (23) | |
| No. of lifetime male sex partners | |||
| 0–3 | 5 (10) | 28 (16) | .27 |
| 4–10 | 16 (33) | 40 (23) | |
| >10 | 27 (56) | 108 (61) | |
| Smoking status | |||
| Never | 9 (19) | 46 (26) | .16 |
| Former | 4 (8) | 27 (16) | |
| Current | 35 (73) | 101 (58) | |
| No. of alcoholic drinks per week | |||
| 0 | 19 (40) | 90 (51) | .22 |
| 1–2 | 19 (40) | 43 (25) | |
| 3–13 | 5 (10) | 24 (14) | |
| >13 | 5 (10) | 18 (10) | |
| Crack, cocaine, or heroin use | |||
| None | 16 (33) | 60 (34) | .84 |
| Not within 1 year | 17 (35) | 55 (31) | |
| Within 1 year | 15 (31) | 61 (35) | |
| Log10 HIV-1 RNA, copies/mL | NA | 3.56 (1.90–5.79) | NA |
| HAART use in past 6 months | NA | 86 (49) | NA |
| CD4+ subset | |||
| Total cell count, cells/mm3 | 1042 (100–2395) | 358 (0–1255) | <.0001 |
| Memory cell count, cells/mm3 | 679 (85–1925) | 230 (3–766) | <.0001 |
| Naive cell count, cells/mm3 | 347 (15–767) | 139 (0–622) | <.0001 |
| CD28+ % | 97 (78–100) | 96 (26–100) | .06 |
| CD95+ % | 63 (31–90) | 65 (15–100) | .67 |
| HLADR+/CD38+ % | 3 (2–10) | 12 (1–83) | <.0001 |
| CD8+ subset | |||
| Total cell count, cells/mm3 | 512 (65–1671) | 826 (37–4510) | <.0001 |
| Memory cell count, cells/mm3 | 257 (44–1019) | 541 (32–3202) | <.0001 |
| Naive cell count, cells/mm3 | 260 (20–668) | 234 (6–1353) | .38 |
| CD28+ % | 67.5 (30–87) | 43 (9–82) | <.0001 |
| CD95+ % | 57 (18–93) | 75 (31–98) | <.0001 |
| HLADR+/CD38+ % | 11 (2–45) | 49.5 (4–89) | <.0001 |
NOTE. Data are no. (%) of women, unless otherwise indicated. NA, not applicable
χ2 test was used to calculate P values for differences in the distributions of race, no. of lifetime male sex partners, smoking status, alcohol use, and drug use between HIV-seronegative and HIV-seropositive women. Wilcoxon rank sum test was used to calculate P values for differences in follow-up time, age, and marker levels. P ≤ .05 (in boldface type) was considered to be significant for all χ2 tests, follow-up time, and age. P≤ .005 (in boldface type) was considered to be significant for marker levels after correction for multiple comparisons.
We examined the relationship between HIV-1 RNA level and marker levels at baseline among HIV-seropositive women (table 2 and figure 1). We observed a highly significant association between HIV-1 RNA level group and CD4 cell count (P < .0001), confirming previous reports that higher HIV-1 RNA levels correspond to lower total CD4 T cell counts and CD4 T cell subsets (table 2). Although the difference in naive CD8 cell counts between HIV-seropositive and HIV-seronegative women was not significant, as noted above, there was an association between HIV-1 RNA level group and naive CD8 cell count (P = .0001), again with lower cell counts corresponding to higher HIV-1 RNA levels. HIV-1 RNA level group was strongly associated with activation (CD38+/DR+) in both T cell populations (P < .0001). Furthermore, we noted that a significant percentage of CD8 T cells was found to be activated, compared with HIV-seronegative women, even for those women with low or undetectable HIV RNA levels (<400 copies/mL). Our data (table 2 and figure 1) indicate that, in CD4 T cells, increased activation occurred at HIV-1 RNA levels >40,000 copies/mL, whereas increased activation in CD8 T cells occurred at much lower HIV-1 RNA levels.
Table 2. Comparison of baseline marker levels for human immunodeficiency virus (HIV)– seropositive women stratified into 4 groups based on HIV-1 RNA level.
| Markers measureda | Baseline HIV-1 RNA level groups | P | |||
|---|---|---|---|---|---|
| <400 (n = 56) |
401–4000 (n = 35) |
4001–40,000 (n = 52) |
>40,000 (n = 33) |
||
| CD4+ subset | |||||
| Total cell count, cells/mm3 | 525 (4–1255) | 406 (23–1098) | 364 (15–942) | 94 (0–526) | <.0001 |
| Memory cell count, cells/mm3 | 296 (3–766) | 241 (22–673) | 218 (10–621) | 91 (4–289) | <.0001 |
| Naive cell count, cells/mm3 | 182 (1–582) | 171 (1–622) | 111 (1–537) | 28 (0–237) | <.0001 |
| CD28+ % | 96 (37–100) | 97 (26–100) | 96.5 (52–100) | 91 (48–100) | .09 |
| CD95+ % | 63 (26–100) | 62 (24–97) | 65 (15–96) | 77.5 (37–99) | .009 |
| HLADR+/CD38+ % | 8 (1–52) | 11 (1–44) | 13 (5–54) | 27 (9–83) | <.0001 |
| CD8+ subset | |||||
| Total cell count, cells/mm3 | 761 (200–2415) | 875 (218–2268) | 906 (128–4510) | 651 (37–2718) | .05 |
| Memory cell count, cells/mm3 | 470 (101–1980) | 561 (100–2064) | 614 (108–3202) | 485 (32–1903) | .06 |
| Naive cell count, cells/mm3 | 291 (26–875) | 281 (48–510) | 196 (20–1353) | 174 (6–815) | .0001 |
| CD28+ % | 49 (13–82) | 42 (9–69) | 41.5 (21–70) | 40 (18–73) | .008 |
| CD95+ % | 71 (36–91) | 77 (48–93) | 79.5 (39–95) | 76 (31–98) | .04 |
| HLADR+/CD38+ % | 32.5 (4–74) | 50 (21–69) | 52.5 (28–89) | 64 (30–84) | <.0001 |
NOTE. Except for P values, data are median (range) for HIV-seropositive women only.
Kruskall Wallis test was used to calculate P values for overall associations among HIV-1 RNA group and marker level. P≤.005 (in boldface type) was considered to be significant after correction for multiple comparisons. .005< P< .05 (in italic type) were considered to be suggestive.
Figure 1.
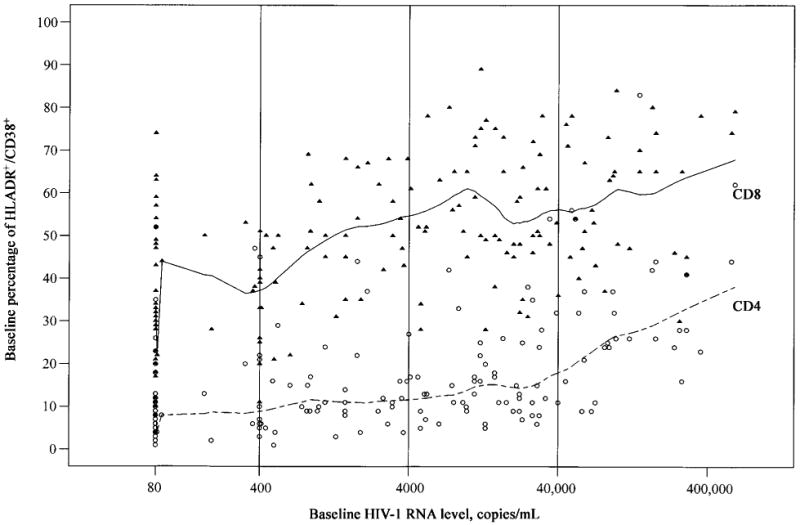
Scatter plots with nonlinear smooth curves of baseline percentage of HLADR+/CD38+ expressed in CD4 (dashed line) and CD8 (solid line) T cells over the range of baseline human immunodeficiency virus type 1 (HIV-1) RNA levels for 176 HIV-seropositive women. Curves were fitted with the S-PLUS lowess function (MathSoft). Open circles represent individual data points for CD4, and closed triangles represent data points for CD8. Vertical lines divide HIV-1 RNA levels into groups corresponding to those in table 2.
A particular interest was to evaluate the impact of illicit drug use on immune activation. We used available toxicology results to validate self-reported illicit drug use. Toxicology results from at least 1 visit were available for 168 (75%) of the 224 participants. No drug use during the study period was reported by 85 women, of whom 69 always tested negative, for a negative confirmation rate of 81%. The other 83 women reported drug use at least once. Of these, 53 had urine toxicology results available for the same visit, of whom 43 tested positive, for a positive confirmation rate of 81%. Drug-use group was not significantly associated with immune activation in either population (CD4 or CD8) in either baseline or univariate longitudinal analysis (data not shown; see Methods for definition of drug-use group). Figure 2 shows the relationship of CD4 activation with CD4 cell count and HIV-1 RNA level (HIV-seropositive women only) for drug users and non–drug users (figure 2; open circles and closed triangles, respectively). Drug use did not impact CD4 activation among HIV-seronegative women. The mean level among was 3.3% non–drug users and 3.7% among drug users (P = .27). In the panels corresponding to HIV-seropositive women, regression lines from interaction models show that activation decreased with higher CD4 T cell count and increased with higher HIV-1 RNA level. There was no significant difference between drug users and non–drug users with respect to the decrease in CD4 activation and increasing CD4 cell count. In a main effects model, cell count was independently associated with activation (P < .0001), but the observed increase among drug users was not (P = .10). The increase in activation with high HIV-1 RNA level was not significantly different for drug users and non–drug users. Again, in a main effects model, HIV-1 RNA level was significant (P < .0001), but drug use was not (P = .09).
Figure 2.
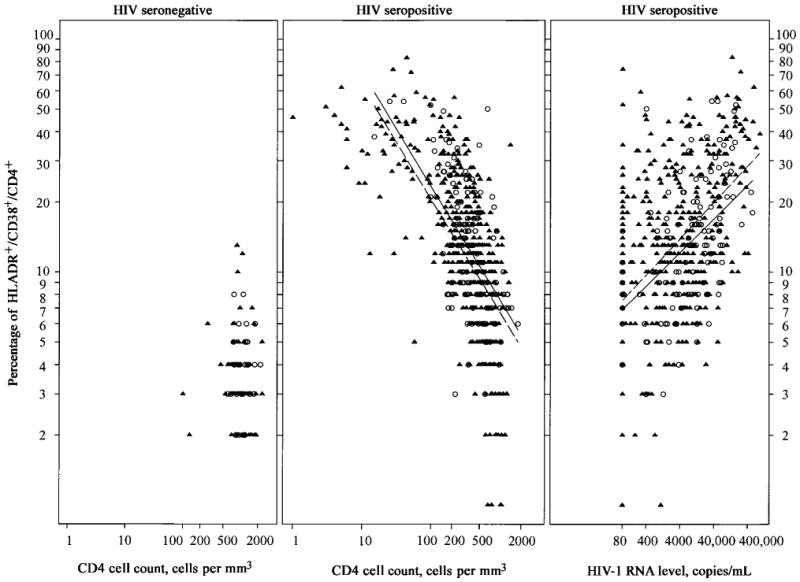
Scatter plots for percentage of CD4 T cell activation level vs. CD4 cell count in human immunodeficiency virus (HIV)–seronegative (left) and HIV-seropositive (center) women and for percentage of CD4 T cell activation level vs. HIV RNA level (right) for drug users (○) and non–drug users (▲). Regression lines from models including CD4 cell count or HIV-1 RNA level, drug use, and their interactions are shown for HIV-seropositive women; solid lines, drug users; dashed lines, non–drug users.
In addition to CD4 cell count and HIV-1 RNA level, age and ethnicity were the only other factors found to be independently associated with level of immune activation and markers of maturation and function from univariate analysis. Table 3 shows the associations between CD4 cell count and HIV-1 RNA level with all markers, adjusted for age and race/ethnicity. Only CD4 cell count and HIV-1 RNA level remained significantly associated with immune activation (CD38+/DR+) in both T cell populations, although age and ethnicity were marginally associated with CD4 activation. In models for cell counts (CD4 was excluded), only HIV-1 RNA level remained significantly associated with overall and memory CD4 and naive CD8, but age, in addition to HIV-1 RNA level, was independently associated with naive CD4. In terms of functional markers, CD4 and age were both independently associated with expression of CD95 on CD4 T cells, but only age predicted CD95 on CD8 T cells. CD4 cell count and HIV-1 RNA level were marginally associated with expression of CD28 on CD8 T cells.
Table 3. Multivariate model results.
| Marker | CD4 cell counta | HIV-1 RNA levelb | Agec | Race/ethnicityd |
|---|---|---|---|---|
| CD4+ | ||||
| Total | Not included | −117 cells (<.0001) | −34 cells (.16) | 52 cells (.19); 155 cells (.007) |
| Memory | Not included | −60 cells (<.0001) | 8 cells (.57) | 7 cells (.78); 75 cells (.05) |
| Naive | Not included | −52 cells (<.0001) | −42 cells (.005) | 36 cells (.18); 82 cells (.01) |
| CD28+ | 0.3% (.36) | − 1.0% (.26) | −0.8% (.58) | 3.3% (.33); 4.1% (.25) |
| CD95+ | −2.5% (<.0001) | −0.6% (.50) | 7.0% (<.0001) | −2.6% (.47); −1.7% (.65) |
| CD38+/DR+ | − 1.9% (<.0001) | 3.1% (<.0001) | 2.3% (.02) | −4.7% (.02); −4.1% (.05) |
| CD8+ | ||||
| Total | Not included | −26 cells (.41) | 91 cells (.07) | −9 cells (.94); 227 cells (.19) |
| Memory | Not included | 14 cells (.56) | 106 cells (.007) | −42 cells (.62); 178 cells (.18) |
| Naive | Not included | −38 cells (<.0001) | −15 cells (.35) | 36 cells (.29); 61 cells (.21) |
| CD28+ | 0.8% (.02) | −2.2% (.006) | −1.4% (.40) | − 1.0% (.73); −2.5% (.43) |
| CD95+ | −0.4% (.21) | 1.2% (.10) | 4.6% (.0002) | 0.9% (.76); 3.4% (.27) |
| CD38+/DR+ | −1.6% (<.0001) | 6.3% (<.0001) | −0.2% (.89) | 2.2% (.43); −1.3% (.70) |
NOTE. Values are the expected difference in cell count or percentage (P values) for comparison between women at the same time point with all factors identical, except for the one given, from linear regression models adjusted for repeated measures. P≤ .005 (in boldface type) was considered to be significant after correction for multiple comparisons. .005< P< .05 (in italic type) was considered to be suggestive.
CD4 cell count was treated as continuous; reference level was 421 cells/mm3; comparison was for a 100-cell difference.
Human immunodeficiency virus type 1 (HIV-1) RNA level was treated as continuous; reference level is log10 3.36 = 2290 copies/mL; comparison is for a 1-log10 difference.
Age was treated as continuous; reference is 39 years; comparison is for a 10-year difference.
For each marker for race/ethnicity, the first difference corresponds to black vs. Latina and the second to white/other vs. Latina.
Table 4 shows how change in HIV-1 RNA level during the study period was related to change in marker level during the same period for women with the same baseline HIV-1 RNA level. In CD4 T cells, an increase in HIV-1 RNA level was significantly associated with a decrease in the expression of CD28 (P = .0007) and an increase in activation (P < .0001). It was marginally associated with decreases in CD4 cell counts and an increase in the expression of CD95. In CD8 T cells, it was significantly associated with increases in the expression of CD95 (P = .0001) and activation (P < .0001). For example, comparing women who have a 1-log increase in HIV-1 RNA level every 6 months with those who have the same baseline HIV-1 RNA level but no change over time, those with increased viral replication demonstrated a 5% increase in CD4 activation (P < .0001) and an 8% increase in CD8 activation (P < .0001).
Table 4. Model results for the association between change in human immunodeficiency virus type 1 (HIV-1) RNA level and change in marker level.
| Marker | CD4+ | CD8+ | ||
|---|---|---|---|---|
| Expected 6-month change | P | Expected 6-month change | P | |
| Total cells | −37 | .02 | 56 | .25 |
| Memory cells | −30 | .04 | 74 | .06 |
| Naive cells | −17 | .03 | −22 | .09 |
| CD28+ % | −2.73 | .0007 | −1.07 | .31 |
| CD95+ % | 2.52 | .01 | 3.02 | .0001 |
| HLADR+/CD38+ % | 4.82 | <.0001 | 8.39 | <.0001 |
NOTE. The model compares women with the same baseline HIV-1 RNA level but a 1-log10 difference in HIV-1 RNA level slope over the 3-year study period. Expected 6-month changes in cell count or percentage correspond to women with higher slopes vs. women with lower slopes. P ≤ .005 (in boldface type) was considered to be significant after correction for multiple comparisons. .005< P< .05 (in italic type) were considered to be suggestive.
Discussion
This is the first study to our knowledge to evaluate the correlates of lymphocyte subset changes in a large cohort of HIV-seropositive and high-risk HIV-seronegative women in reference to CD4 cell count, HIV-1 RNA level, age, and race/ethnicity. We found a strong association between HIV infection and activation of T cells, even for women with an HIV RNA level <400 copies/mL. The level of immune activation on CD4 cells did not increase until the HIV-1 RNA level was >40,000 copies/mL, whereas CD8 cells demonstrated a progressive increase in activation marker expression with increasing HIV-1 RNA levels. We also found that changes in RNA slope were significantly associated with increase in the percentage of expression of activation markers of both CD4 and CD8 T cells. Numerous publications have highlighted the role of immune activation levels, especially on CD8 T cells and disease progression [26–28]. Quantitative expression of CD38 on CD8 cells has been demonstrated to be a marker of disease progression independent of HIV-1 RNA level [8]. The quantitative measurement of CD38 on CD8 cells also has been shown to add additional predictive power to clinical outcome in subjects with low CD4 cell counts [28]. The current study suggests that the quantitative measurement of CD38/DR on CD8 cells may be a valuable monitoring tool in subjects receiving antiretroviral therapy. Indeed, the persistence of CD8 activation, as measured by CD38/DR, in subjects with an HIV-1 RNA level <400 copies/mL may indicate inherent immune dysfunction that occurs even in subjects with maximal suppressed viral replication. More recent studies have focused on levels of CD4 T cell activation and have shown that this marker can add to the prognostic value of HIV-1 RNA level and CD4 T cell counts [10]. The majority of these studies have evaluated cohorts of men and have not analyzed variables of age or race/ethnicity.
Our study is one of the first to show the strong correlation of immune activation level and HIV-1 RNA level in women and to demonstrate the lack of association between drug use and immune activation. The level of activation appears to be determined by HIV-1 infection itself. Even at low HIV-1 RNA levels, activation is associated with HIV infection status and not drug use. In addition, we were able to demonstrate a significant association between age and CD4 activation level, but not CD8 marker status. The age-related association with CD4 activation level may be a contributing factor for enhanced HIV disease progression in older individuals [29–32]. We also found that white persons had higher CD4 cell counts and that both white and black persons had lower CD4 activation levels than did Latina women. This may reflect differences in the use of or adherence to antiretroviral medications or a biologic difference in the study population [33]. The enhanced activation level of CD4 T cells is relevant, because activated CD4 cells serve as a major target for viral replication. Therefore, one of the important goals for therapy should be not only to reduce HIV-1 RNA level but also to reduce immune activation levels so that the susceptible target population is reduced. It has been shown that CD4 recovery does not occur in the setting of virus suppression, unless immune activation levels also are reduced [25]. On the other hand, CD8 activation remained significantly elevated, even in subjects with plasma HIV RNA levels <400 copies/mL. The implication for these data is that immune activation levels might be a more-sensitive marker of ongoing viral replication, especially in tissue reservoirs. We have demonstrated elsewhere [34] that CD4 and CD8 activation levels (CD38/DR) remain elevated in subjects who experience virologic rebound.
We also found that, in the CD4 cell population, higher HIV-1 RNA level was associated with lower cell count in the memory and naive subsets, although age had a significant impact only on naive cells. This reduction in naive cell count with age may be caused by the change in cells from a naive to memory phenotype that occurs with aging and HIV infection [12, 35]. Differences in naive cell count also were noted between Latina and white women, but the association was overshadowed by HIV-1 RNA level and age. In the CD8 cell population, age was the only factor significantly associated with memory, and only HIV-1 RNA level was associated with naive cell count. Overall, these data are consistent with the concept that HIV-1 RNA level is a good predictor of immunodeficiency, as reflected by loss of CD4 subsets. Memory and naive CD4 T cell subsets are critical in generating effective host immune responses. Thus, the significant loss of both CD4 and CD8 naive subsets with increasing HIV-1 RNA level suggests infection of T cell precursors in the thymus that could subsequently affect the ability of an individual to generate new immune responses to HIV or opportunistic pathogens. A number of recent studies have demonstrated that the adult thymus is still functional and has the capability of producing new T cells, even though there is a clear age-related involution. Recently, a newly developed molecular tool, T cell receptor excision circles (TRECs), has been developed to allow for the evaluation of thymic function in peripheral blood samples [36–39]. Future studies of the level of thymic function (TREC analysis) in these subjects will be necessary to confirm this hypothesis.
A significant expansion of CD28−CD8+ cells has been demonstrated in patients with increasing immunodeficiency, as described elsewhere [16, 40, 41]. Our results are consistent with this finding and demonstrate that increasing HIV-1 RNA levels most likely leads to increased cell turnover and loss of CD28 expression. These CD28− cells have been shown to have shorter telomers [42–44] and represent terminally differentiated effector cells. In addition, there is an increasing expression of CD95 associated with age implicating an enhanced propensity of CD8 cells for apoptosis.
These data demonstrate that immune activation is a significant pathogenic feature of HIV replication in women as well as in men. The present study also shows that HIV, and not exposure to illicit drugs, is the driving force for immune activation. The finding of significant CD8 T cell activation with low-to-undetectable HIV-1 RNA levels has implications for the inability of current therapeutic HAART regimens to completely suppress virus replication, especially in tissue reservoirs [45].
Acknowledgments
Data in this manuscript were collected by the Women's Interagency Human Immunodeficiency Virus Study (WIHS) Collaborative Study Group with centers (Principal Investigators) at New York City/Bronx Consortium (Kathryn Anastos); Brooklyn, NY (Howard Minkoff); Washington DC Metropolitan Consortium (Mary Young); Connie Wofsy Study Consortium of Northern California (Ruth Greenblatt and Herminia Palacio); Los Angeles County/Southern California Consortium (Alexandra Levine); Chicago Consortium (Mardge Cohen); and Data Coordinating Center at the Johns Hopkins Bloomberg School of Public Health, Baltimore (Stephen J. Gange and Alvaro Muñoz).
Financial support: National Institute of Allergy and Infectious Diseases, with supplemental funding from the National Cancer Institute, National Institute of Child Health and Human Development (NICHD), National Institute on Drug Abuse, National Institute of Dental and Craniofacial Research, Agency for Health Care Policy and Research; National Center for Research Resources, and Centers for Disease Control and Prevention (U01-AI-35004 [to B.W. and H.B.], U01-AI-31834, U01-AI-34994, U01-AI-34989, U01-HD-32632 [NICHD; to M.N. and A.K.], U01-AI-34993 [to A.L. and J.B.], U01-AI-42590 [to L.B.], M01-RR00079, and M01-RR00083).
References
- 1.Palella FJ, Jr, Delaney KM, Moorman AC, et al. Declining morbidity and mortality among patients with advanced human immunodeficiency virus infection. HIV Outpatient Study Investigators. N Engl J Med. 1998;338:853–60. doi: 10.1056/NEJM199803263381301. [DOI] [PubMed] [Google Scholar]
- 2.Lyles RH, Munoz A, Yamashita TE, et al. Natural history of human immunodeficiency virus type 1 viremia after seroconversion and proximal to AIDS in a large cohort of homosexual men. J Infect Dis. 2000;181:872–80. doi: 10.1086/315339. [DOI] [PubMed] [Google Scholar]
- 3.Mellors JW, Munoz A, Giorgi JV, et al. Plasma viral load and CD4+ lymphocytes as prognostic markers of HIV-1 infection. Ann Intern Med. 1997;126:946–54. doi: 10.7326/0003-4819-126-12-199706150-00003. [DOI] [PubMed] [Google Scholar]
- 4.Yamashita TE, Phair JP, Munoz A, et al. Immunologic and virologic response to highly active antiretroviral therapy in the Multicenter AIDS Cohort Study. AIDS. 2001;15:735–46. doi: 10.1097/00002030-200104130-00009. [DOI] [PubMed] [Google Scholar]
- 5.Sterling TR, Vlahov D, Astemborski J, et al. Initial plasma HIV-1 RNA levels and progression to AIDS in women and men. N Engl J Med. 2001;344:720–5. doi: 10.1056/NEJM200103083441003. [DOI] [PubMed] [Google Scholar]
- 6.Sterling TR, Lyles CM, Vlahov D, et al. Sex differences in longitudinal human immunodeficiency virus type 1 RNA levels among seroconverters. J Infect Dis. 1999;180:666–72. doi: 10.1086/314967. [DOI] [PubMed] [Google Scholar]
- 7.Liu Z, Cumberland WG, Hultin LE, et al. Elevated CD38 antigen expression of CD8+ T cells is a stronger marker for the risk of chronic HIV disease progression to AIDS and death in the Multicenter AIDS Cohort Study than CD4+ cell count, soluble immune activation markers, or combinations of HLA-DR and CD38 expression. J Acquir Immune Defic Syndr Hum Retrovirol. 1997;16:83–92. doi: 10.1097/00042560-199710010-00003. [DOI] [PubMed] [Google Scholar]
- 8.Giorgi JV, Hultin LE, McKeating JA. Shorter survival in advanced human immunodeficiency virus type 1 infection is more closely associated with T lymphocyte activation than with plasma virus burden or virus chemokine coreceptor usage. J Infect Dis. 1999;179:859–70. doi: 10.1086/314660. [DOI] [PubMed] [Google Scholar]
- 9.Orendi JM, Bloem AC, Borleffs JCC, et al. Activation and cell cycle antigens in CD4 + and CD8+ T cells correlate with plasma human immunodeficiency virus (HIV-1) RNA level in HIV-1 infection. J Infect Dis. 1998;178:1279–87. doi: 10.1086/314451. [DOI] [PubMed] [Google Scholar]
- 10.Carbone J, Gil J, Benito JM, et al. Increased levels of activated subsets of CD4 T cells add to the prognostic value of low CD4 T cell counts in a cohort of HIV-infected drug users. AIDS. 2000;14:2823–9. doi: 10.1097/00002030-200012220-00003. [DOI] [PubMed] [Google Scholar]
- 11.Leng Q, Borkow G, Weisman Z, et al. Immune activation correlates better than HIV plasma viral load with CD4 T-cell decline during HIV infection. J Acquir Immune Defic Syndr. 2001;27:389–97. doi: 10.1097/00126334-200108010-00010. [DOI] [PubMed] [Google Scholar]
- 12.Roederer M, Dubs JG, Anderson MT, et al. CD8 naive T cell counts decrease progressively in HIV-infected adults. J Clin Invest. 1995;95:2061–6. doi: 10.1172/JCI117892. [DOI] [PMC free article] [PubMed] [Google Scholar]
- 13.van Noesel CJ, Gruters RA, Terpstra FG, et al. Functional and phenotypic evidence for a selective loss of memory T cells in asymptomatic human immunodeficiency virus–infected men. J Clin Invest. 1990;86:293–9. doi: 10.1172/JCI114698. [DOI] [PMC free article] [PubMed] [Google Scholar]
- 14.Ullum H, Cozzi Lepri A, Victor J, et al. Increased loss of CD4+CD45RA+ cells in late stages of HIV infection is related to increased risk of death: evidence from a cohort of 347 HIV-infected individuals. AIDS. 1997;11:1479–85. doi: 10.1097/00002030-199712000-00012. [DOI] [PubMed] [Google Scholar]
- 15.Saukkonen JJ, Kornfeld H, Berman JS. Expansion of a CD8+CD28− cell population in the blood and lung of HIV-positive patients. J Acquir Immune Defic Syndr. 1993;6:1194–204. [PubMed] [Google Scholar]
- 16.Choremi-Papadopoulou H, Viglis V, Gargalianos P, et al. Downregulation of CD28 surface antigen on CD4+ and CD8+ lymphocytes during HIV-1 infection. J Acquir Immune Defic Syndr. 1994;7:245–53. [PubMed] [Google Scholar]
- 17.Borthwick NJ, Bofill M, Gombert WM, et al. Lymphocyte activation in HIV-1 infection. II. Functional defects of CD28− T cells. AIDS. 1994;8:431–41. doi: 10.1097/00002030-199404000-00004. [DOI] [PubMed] [Google Scholar]
- 18.Debatin KM, Fahrig-Faissner A, Snenkel-Stoodt S, et al. High expression of APO-1 (CD95) on T lymphocytes from human immunodeficiency virus–1–infected children. Blood. 1994;83:3101–3. [PubMed] [Google Scholar]
- 19.Sloand EM, Young NS, Kumar P, et al. Role of Fas ligand and receptor in the mechanism of T-cell depletion in acquired immunodeficiency syndrome: effect on CD4+ lymphocyte depletion and human immunodeficiency virus replication. Blood. 1997;89:1357–63. [PubMed] [Google Scholar]
- 20.Sloand EM, Maciejewski JP, Sato T, et al. The role of interleukin-converting enzyme in Fas-mediated apoptosis in HIV-1 infection. J Clin Invest. 1998;101:195–201. doi: 10.1172/JCI530. [DOI] [PMC free article] [PubMed] [Google Scholar]
- 21.Barkan S, Melnick S, Preston-Martin S, et al. Design, methods, sample, cohort characteristics and comparison with reported AIDS cases in US women. Women's Interagency HIV Study (WIHS) Epidemiology. 1998;9:117–25. [PubMed] [Google Scholar]
- 22.Van Gemen B, van Beuningen R, Nabbe A, et al. A one-tube quantitative HIV-1 RNA NASBA nucleic acid amplification assay using electrochemiluminescent (ECL) labeled probes. J Virol Methods. 1994;49:157–67. doi: 10.1016/0166-0934(94)90040-x. [DOI] [PubMed] [Google Scholar]
- 23.Nowicki MJ, Benning L, Bremer JW, et al. Longitudinal variability of human immunodeficiency virus type 1 RNA viral load measurements by nucleic acid sequence-based amplification and NucliSens assays in a large multicenter study. J Clin Microbiol. 2001;39:3760–3. doi: 10.1128/JCM.39.10.3760-3763.2001. [DOI] [PMC free article] [PubMed] [Google Scholar]
- 24.Bethesda, MD: National Institutes of Health; 1997. AIDS Clinical Trials Group Immunology Laboratory Committee Consensus Methodologies. Available at: http://aactg.s-3.com. [Google Scholar]
- 25.Lederman MM, Connick E, Landay A, et al. Immunologic responses associated with 12 weeks of combination antiretroviral therapy consisting of zidovudine, lamivudine, and ritonavir: results of AIDS Clinical Trials Group Protocol 315. J Infect Dis. 1998;178:70–9. doi: 10.1086/515591. [DOI] [PubMed] [Google Scholar]
- 26.Leng Q, Borkow G, Weisman Z, et al. Immune activation correlates better than HIV plasma viral load with CD4 T-cell decline during HIV infection. J Acquir Immune Defic Syndr. 2001;27:389–97. doi: 10.1097/00126334-200108010-00010. [DOI] [PubMed] [Google Scholar]
- 27.Mocroft A, Bofill M, Lipman M, et al. CD8+CD38+ lymphocyte percent: a useful immunological marker for monitoring HIV-1–infected patients. J Acquir Immune Defic Syndr Hum Retrovirol. 1997;14:158–62. doi: 10.1097/00042560-199702010-00009. [DOI] [PubMed] [Google Scholar]
- 28.Froebel KS, Raab GM, D'Alessandro CD, et al. A single measurement of CD38CD8 cells in HIV+, long-term surviving injecting drug users distinguishes those who will progress to AIDS from those who will remain stable. Clin Exp Immunol. 2000;122:72–8. doi: 10.1046/j.1365-2249.2000.01348.x. [DOI] [PMC free article] [PubMed] [Google Scholar]
- 29.Goedert JJ, Kessler CM, Aledort LM, et al. A prospective study of human immunodeficiency virus type 1 infection and the development of AIDS in subjects with hemophilia. New Engl J Med. 1989;321:1141–52. doi: 10.1056/NEJM198910263211701. [DOI] [PubMed] [Google Scholar]
- 30.Rosenberg PS, Goedert JJ, Bigger RJ. Effect of age at seroconversion on the natural AIDS incubation distribution. AIDS. 1994;8:803–10. doi: 10.1097/00002030-199406000-00013. [DOI] [PubMed] [Google Scholar]
- 31.Blatt SP, McCarthy WF, Bucko-Krasnicka B, et al. Multivariate models for predicting progression to AIDS and survival in human immunodeficiency virus–infected persons. J Infect Dis. 1995;171:837–44. doi: 10.1093/infdis/171.4.837. [DOI] [PubMed] [Google Scholar]
- 32.Darby SC, Ewart DW, Giangrande PLF, et al. Importance of age at infection with HIV-1 for survival and development of AIDS in UK haemophilia population. Lancet. 1996;347:1573–9. doi: 10.1016/s0140-6736(96)91073-9. [DOI] [PubMed] [Google Scholar]
- 33.Anastos K, Gange SJ, Lau B, et al. Association of race and gender with HIV-1 RNA levels and immunologic progression. J Acquir Immune Defic Syndr. 2000;24:218–26. doi: 10.1097/00126334-200007010-00004. [DOI] [PubMed] [Google Scholar]
- 34.Patki AH, Purvis SF, Valdez H, et al. HIV infection perturbs DNA content to lymphoid cells: partial correction after “suppression” of virus replication. AIDS. 1999;13:1177–85. doi: 10.1097/00002030-199907090-00005. [DOI] [PubMed] [Google Scholar]
- 35.Fagnoni FF, Vescovini R, Passderi G, et al. Shortage of circulating naive CD8+ T cells provides new insights on immunodeficiency in aging. Blood. 2000;95:2860–8. [PubMed] [Google Scholar]
- 36.Douek DC, McFarland RD, Keiser PH, et al. Changes in thymic function with age and during the treatment of HIV infection. Nature. 1998;396:690–5. doi: 10.1038/25374. [DOI] [PubMed] [Google Scholar]
- 37.Poulin JF, Viswanathan MN, Harris JM, et al. Direct evidence for thymic function in adult humans. J Exp Med. 1999;190:479–86. doi: 10.1084/jem.190.4.479. [DOI] [PMC free article] [PubMed] [Google Scholar]
- 38.Zhang L, Lewin SR, Markowitz M, et al. Measuring recent thymic emigrants in blood of normal and HIV-1–infected individuals before and after effective therapy. J Exp Med. 1999;190:725–32. doi: 10.1084/jem.190.5.725. [DOI] [PMC free article] [PubMed] [Google Scholar]
- 39.Steffens CM, Smith KY, Landay A, et al. T cell receptor excision circle (TREC) content following maximum HIV suppression is equivalent in HIV-infected and HIV-uninfected individuals. Clin Immunol. 2001;15:1757–64. doi: 10.1097/00002030-200109280-00003. [DOI] [PubMed] [Google Scholar]
- 40.Brinchmann JE, Dobloug JH, Heger BH, et al. Expression of costimulatory molecule CD28 on T cells in human immunodeficiency virus type 1 infection: functional and clinical correlations. J Infect Dis. 1994;169:730–8. doi: 10.1093/infdis/169.4.730. [DOI] [PubMed] [Google Scholar]
- 41.Fiorentino S, Dalod M, Olive D, et al. Predominant involvement of CD8+CD28− lymphocytes in human immunodeficiency virus–specific cytotoxic activity. J Virol. 1996;70:2022–6. doi: 10.1128/jvi.70.3.2022-2026.1996. [DOI] [PMC free article] [PubMed] [Google Scholar]
- 42.Richardson MW, Sverstiuk A, Hendel H, et al. Analysis of telomere length and thymic output in fast and slow/non-progressors with HIV infection. Biomed Pharmacother. 2000;54:21–31. doi: 10.1016/s0753-3322(00)88637-0. [DOI] [PubMed] [Google Scholar]
- 43.Palmer LD, Weng Np, Levine BL, et al. Telomere length, telomerase activity, and replicative potential in HIV infection: analysis of CD4+ and CD8+ T cells from HIV-discordant monozygotic twins. J Exp Med. 1997;185:1381–6. doi: 10.1084/jem.185.7.1381. [DOI] [PMC free article] [PubMed] [Google Scholar]
- 44.Effros RB, Allsopp R, Chiu CP, et al. Shortened telomeres in the expanded CD28−CD8+ cell subset in HIV disease implicate replicative senescence in HIV pathogenesis. AIDS. 1996;10:F17–22. doi: 10.1097/00002030-199607000-00001. [DOI] [PubMed] [Google Scholar]
- 45.Gunthard HF, Havlir DV, Fiscus S, et al. Residual human immunodeficiency virus (HIV) type 1 RNA and DNA in lymph nodes and HIV RNA in genital secretions and in cerebrospinal fluid after suppression of viremia for 2 years. J Infect Dis. 2001;183:1318–27. doi: 10.1086/319864. [DOI] [PubMed] [Google Scholar]