

Abstract
Breast cancer survival has been found to be lower in obese women, but few studies have evaluated ethnic variations in this association. This study examined all-cause and breast cancer-specific survival by body mass index (BMI) in the Multiethnic Cohort (MEC) study for African American, Native Hawaiian, Japanese American, Latino, and Caucasian women. Female MEC participants free of breast cancer, aged ≥ 50 years at cohort entry, and diagnosed with primary invasive breast cancer during follow-up were included in the analyses (n = 3,842). Cox proportional hazards regression was used to estimate the effect of pre-diagnostic adult BMI (<22.5, 22.5–24.9, 25.0–29.9, ≥30 kg/m2) on the risk of mortality. Mean age at diagnosis was 68.8 years (range 50–89 years). During a mean follow-up of 6.2 ± 3.8 years after diagnosis, there were 804 deaths that included 376 breast cancer-specific deaths. After adjustment for breast cancer characteristics, including hormone receptor status, stage at diagnosis, and treatment, obese women had a higher risk of all-cause [hazard ratio (HR) = 1.54; 95% confidence interval (CI): 1.23, 1.91] and breast cancer-specific (HR = 1.45; 95% CI: 1.05, 2.00) mortality compared to women with high-normal BMI; however, being overweight did not affect survival. There was no evidence of ethnic differences in the BMI effect on all-cause (Pinteraction = 0.87) or breast cancer-specific (Pinteraction = 0.63) mortality. Our findings are consistent with the literature that maintaining moderate weight throughout adult life may be beneficial for breast cancer survival in women and this appears to hold for all ethnic groups.
Keywords: Breast carcinoma, ethnicity, obesity, survival, prognosis
Introduction
Predictors of unfavorable outcomes after breast cancer diagnosis include advanced stage at diagnosis and adverse tumor characteristics [1]. The estimated 5-year survival relative to the general population is 98% for localized disease, 84% for regional disease and 23% for metastasized breast cancer [2]. Breast cancer is a biologically diverse disease characterized by pathologically heterogeneous tumors with different prognoses. Tumors lacking estrogen receptor (ER) and progesterone receptor (PR) expression lead to an estimated 2-fold lower survival than tumors expressing both receptors [3]. Research targeting potentially modifiable risk factors for breast cancer mortality is of public health importance given the number of deaths per year: an estimated 40,000 U.S. women were expected to die from breast cancer in 2010 [2].
Obesity represents one of the few potentially modifiable factors that may influence breast cancer outcomes, whereas epidemiologic data for other modifiable factors (e.g., physical activity and healthful diets) are less convincing [4]. Furthermore, obesity is a significant public health problem with approximately one-third of U.S. women estimated to meet the criteria for obesity, as defined by a body mass index (BMI) ≥ 30 kg/m2 [5]. Obesity has been linked to increased risk of all-cause and breast cancer-specific mortality [6], with limited data available for the effect of obesity on breast cancer-specific mortality in ethnically diverse populations [7–9]. Proposed biologic mechanisms for lower survival in obese women include elevated levels of bioavailable estradiol that contributes to the upregulation of cellular proliferation pathways and a microenvironment that promotes angiogenesis, invasion and metastasis [10, 11]. Suboptimal treatment (e.g., under-dosage of chemotherapy) may also contribute to the lower breast cancer survival of obese women [12].
We examined the relationship between self-reported, pre-diagnostic BMI and breast cancer survival in the Multiethnic Cohort (MEC) study of African American, Native Hawaiian, Japanese American, Latino and Caucasian postmenopausal women in Hawaii and Los Angeles. Specifically, we hypothesized that overweight or obesity would predict lower survival.
Methods
Study population
The MEC study, an ongoing, prospective study of dietary, environmental and genetic factors in relation to cancer and other chronic diseases, enrolled 96,382 men and 118,869 women in 1993 through 1996, aged 45–75 years at cohort creation from Hawaii and California (primarily Los Angeles County). Details on the study design, response rates and baseline characteristics have been given elsewhere [13]. The population-based sampling frames included drivers' license records in both states, supplemented with voter registration lists in Hawaii and Health Care Financing Administration (MEDICARE) files in California. Subjects entered the cohort by completing a 26-page, self-administered mailed questionnaire. The institutional review boards at the University of Hawaii and the University of Southern California approved the study protocol.
Incident cases of invasive breast cancer were identified for the women among the five main ethnic groups, African American, Caucasian, Japanese American, Native Hawaiian and Latino, who were free of a previous self-reported or registry-detected breast cancer diagnosis at the time of the baseline questionnaire. Following entry into the MEC, incident breast cancer cases were identified by linkage with the Los Angeles County Cancer Surveillance Program, the State of California Cancer Registry, and the statewide Hawaii Tumor Registry. These tumor registries participate in the National Cancer Institute's Surveillance, Epidemiology, and End Results (SEER) program [14]. Dates and causes of death were identified by computerized linkages with the databases of the California and Hawaii vital records offices and the National Death Index. Complete case and/or death ascertainment was available up to December 31, 2007. Excluded from the present analysis were women younger than 50 years old at cohort entry to remove premenopausal and perimenopausal women (n = 612), women with missing (n = 60) or extreme values for height or weight that resulted in BMI outside of the 15–50 kg/m2 range (n = 11). A total of 3,842 female breast cancer cases were included in the present analyses.
Data collection
The baseline questionnaire included sections on height and body weight that were used to calculate BMI (kg/m2), medical history, reproductive history, family history of breast cancer, diet, physical activity and demographic information. The average time from the date of the baseline questionnaire to the date of breast cancer diagnosis was 6.5± 3.9 years (range: 0.0–14.6 years). The presence of co-morbidities, including diabetes, hypertension, heart attack or angina, and stroke, was assessed as follows: “Has your doctor ever told you that you had any of the following conditions?” Hormone replacement therapy (HRT) use was assessed as current or past use of estrogen or progesterone for menopause or other reasons. Usual physical activity was assessed as number of hours per day spent in moderate or vigorous activities, on average, within the past year. Tumor characteristics available from the cancer registries included hormone receptor status, stage, tumor size and first course of treatment (surgery, chemotherapy, or radiotherapy) within the 6 months after diagnosis. The tumor registries did not collect data on recurrence or comorbidities.
Statistical analysis
The primary goal of these analyses was to describe the effect of BMI (<22.5, 22.5–24.9, 25.0–29.9, ≥30 kg/m2) at entry into the MEC, overall and by ethnicity (African American, Caucasian, Japanese American, Native Hawaiian, Latino), on all-cause and breast cancer-specific survival. Survival time was modeled as years starting at the date of the invasive breast cancer diagnosis and ending at the first of the following endpoints: 1) date of breast cancer-specific death, 2) date of non-breast cancer-specific death, or 3) the date of complete case and/or death reporting (12/31/2007). Women alive at the end of 2007 were censored; in the breast cancer-specific models, women who died of other causes were also censored. Statistical computing was conducted using SAS version 9.2 (SAS Insitute Inc., Cary, NC, USA), with a P value of <0.05 considered to be statistically significant.
Ethnic-specific Kaplan-Meier survival curves were compared using a log-rank test. Hazard ratios (HR) and corresponding 95% confidence intervals (CI) were estimated using log-linear (Cox) proportional hazards models. Models were adjusted for age at breast cancer diagnosis (50–59, 60–69, ≥ 70 years), years between cohort entry and breast cancer diagnosis (continuous), hormone receptor status [ER+PR+, ER−PR−, ER+PR−/ER−PR+ (mixed), other/unknown], SEER summary stage (local, regional, distant, unstaged/unknown), surgery (conserving, mastectomy, none/unknown), radiotherapy (yes, no/unknown), chemotherapy (yes, no/unknown), smoking status at baseline (never, former, current, missing). The models were also adjusted for cardiovascular comorbidities (none, hypertension, heart attack/angina/stroke) because a previous study of the MEC reported ethnic differences in cardiovascular disease mortality [15]. The models were not adjusted for diabetes for two reasons: 1) diabetes may be on the pathway between obesity and poor breast cancer survival [16] and 2) obesity and diabetes were highly correlated in this study population (46.5% of women who had diabetes were obese). The addition of the following variables did not change the estimated HRs for BMI by more than 10% and were subsequently not included in the final model: family history of breast cancer (yes, no/unknown), age at menarche (<13, 13–14, >14 years), age at first birth (no children, <20, 21–30, >30 years), number of children (0, 1–2, >3), HRT (no estrogen use, current or past use of estrogen alone, current or past use of estrogen and progesterone, missing) and physical activity (quartiles). The proportional hazards assumptions were assessed by examining log(−log(survival function)) plots for diverging or crossing survival curves over time, testing the statistical significance of time-by-covariate interaction terms, and assessing the Schoenfeld residuals. Stage and hormone receptor status were found to violate the proportional hazard assumption and, consequently, both were modeled as time dependent variables by including crossproduct terms with log-transformed survival time. Trend tests were performed by entering the categorical variable as a continuous parameter in the corresponding models.
We performed a number of additional analyses. First, a non-linear relation between BMI and survival was examined non-parametrically with restricted cubic splines and tested using the likelihood ratio test comparing the model with the linear term to the model with the linear and the cubic spline terms [17]. Second, we examined interactions with BMI, e.g., whether the association between BMI and risk for mortality varied by years between cohort entry and diagnosis (continuous log-transformed), ethnicity, hormone receptor status (ER+PR+, ER−PR−, mixed), stage (localized, regional, distant), age at diagnosis, or cardiovascular comorbidity. Interaction effects were assessed using subgroup specific models and global models including crossproduct terms that were compared to models with main effects only. BMI was entered in the interaction models as a continuous log-transformed measure and only women with BMI ≥22.5 kg/m2were included due to the non-linear relationship present at lower BMI values.
Results
We identified 3,842 women diagnosed with incident, invasive breast cancer, with Japanese American, Caucasian, African American, Latino and Native Hawaiian women comprising 30%, 26%, 19%, 16% and 9% of the cases, respectively (Table 1). The mean BMI at cohort entry was 26.7 ± 5.3 kg/m2 and mean age at diagnosis was 68.8 ± 7.7 years. After a mean follow-up of 6.2 ± 3.8 years, a total of 804 deaths were reported, including 376 breast cancer-specific deaths. Japanese American women had a higher probability of 5-year survival from all-cause and breast cancer-specific death, tended to have lower BMI (<22.5 kg/m2), and were more likely to be diagnosed with localized disease or tumors ≤ 2 cm compared to the other ethnic groups. In contrast, African American women had a lower probability of survival and were less likely to be diagnosed with localized disease or with ER+PR+ tumors compared to the other ethnic groups. Both African American and Native Hawaiian women were more likely to be obese (BMI ≥ 30.0 kg/m2) and to have reported a cardiovascular comorbidity compared to Caucasian, Japanese American and Latino women.
Table 1.
Characteristics of breast cancer casesa in the Multiethnic Cohort Study diagnosed 1993–2007.
| All women | Ethnicity |
Pb | |||||
|---|---|---|---|---|---|---|---|
| African American | Caucasian | Native Hawaiian | Japanese American | Latino | |||
| N | 3,842 | 748 | 991 | 339 | 1,141 | 623 | |
| Deaths, n | |||||||
| All-cause | 804 | 226 | 226 | 76 | 141 | 135 | |
| Cancer-specific | 501 | 143 | 133 | 40 | 90 | 95 | |
| Breast cancer-specific | 376 | 115 | 93 | 31 | 65 | 72 | |
| 5-year survivalc, % | |||||||
| All-cause | 84 | 77 | 81 | 86 | 92 | 82 | <0.001 |
| Breast cancer-specific | 91 | 86 | 91 | 92 | 95 | 89 | <0.001 |
| Age at cohort entry, y | 62.3 (7.1) | 63.3 (7.2) | 62.4 (7.3) | 59.9 (6.8) | 62.7 (7.1) | 61.2 (6.5) | <0.001 |
| Age at diagnosis, y | 68.8 (7.7) | 70.1 (7.8) | 68.9 (7.8) | 66.2 (7.6) | 69.1 (7.8) | 67.8 (7.0) | <0.001 |
| BMI, kg/m2 | 26.7 (5.3) | 29.2 (5.5) | 25.9 (5.1) | 29.2 (5.8) | 24.2 (4.0) | 28.0 (5.2) | <0.001 |
| BMI, kg/m2, n (%) | <0.001 | ||||||
| <22.5 | 836 (22) | 60 (8) | 278 (28) | 25 (7) | 400 (35) | 73 (12) | |
| 22.5–24.9 | 807 (21) | 116 (16) | 205 (21) | 60 (18) | 314 (28) | 112 (18) | |
| 25.0 –29.9 | 1,298 (34) | 277 (37) | 319 (32) | 118 (35) | 342 (30) | 242 (39) | |
| >30.0 | 901 (23) | 295 (39) | 189 (19) | 136 (40) | 85 (7) | 196 (31) | |
| Cardiovascular comorbidity, n (%) | |||||||
| None | 2,095 (55) | 282 (38) | 638 (64) | 151 (45) | 641 (56) | 383 (61) | <0.001 |
| Hypertension | 1,419 (37) | 366 (49) | 279 (28) | 157 (46) | 446 (39) | 171 (27) | |
| Heart diseased/stroke | 328 (9) | 100 (13) | 74 (7) | 31 (9) | 54 (5) | 69 (11) | |
| Hormone receptor, n (%) | <0.001 | ||||||
| ER+PR+ | 1,748 (45) | 279 (37) | 473 (48) | 173 (51) | 555 (49) | 268 (43) | |
| ER−PR− | 494 (13) | 127 (17) | 110 (11) | 37 (11) | 116 (10) | 104 (17) | |
| ER+PR−/ER−PR+ | 395 (10) | 81 (11) | 107 (11) | 22 (6) | 120 (11) | 65 (10) | |
| Other/unknown | 1,205 (31) | 261 (35) | 301 (30) | 107 (32) | 350 (31) | 186 (30) | |
| SEER stage, n (%) | <0.001 | ||||||
| Local | 2,713 (71) | 484 (65) | 693 (70) | 226 (67) | 893 (78) | 417 (67) | |
| Regional | 960 (25) | 215 (29) | 239 (24) | 102 (30) | 230 (20) | 174 (28) | |
| Distant | 108 (3) | 33 (4) | 35 (4) | 7 (2) | 14 (1) | 19 (3) | |
| Unstaged/ unknown | 61 (2) | 16 (2) | 24 (2) | 4 (1) | 4 (1) | 13 (2) | |
| Size, cm, n (%) | <0.001 | ||||||
| ≤2.0 | 2,325 (61) | 329 (44) | 638 (64) | 217 (64) | 843 (74) | 298 (48) | |
| >2.0 | 916 (24) | 215 (29) | 230 (23) | 110 (32) | 226 (20) | 135 (22) | |
| Unknown | 601 (16) | 204 (27) | 123 (12) | 12 (4) | 72 (6) | 190 (30) | |
| Surgery, n (%) | <0.01 | ||||||
| Conserving | 2,151 (56) | 392 (52) | 588 (59) | 197 (58) | 649 (57) | 325 (52) | |
| Mastectomy | 1,461 (38) | 271 (36) | 323 (33) | 133 (39) | 470 (41) | 264 (42) | |
| None/unknown | 230 (6) | 85 (11) | 80 (8) | 9 (3) | 22 (2) | 34 (5) | |
| Chemotherapy, n (%) | 929 (24) | 161 (22) | 228 (23) | 107 (32) | 270 (24) | 163 (26) | <0.01 |
| Radiotherapy, n (%) | 1,821 (47) | 275 (37) | 505 (51) | 198 (58) | 604 (53) | 239 (38) | <0.001 |
BMI, body mass index, ER estrogen receptor, PR progesterone receptor
Unless specified, means (standard deviation) presented; percentages may not add to 100 because of rounding.
P value based on analysis of variance for continuous variables, χ2 test with unknown category excluded for categorical variables, and χ2 for log-rank test for estimated 5-year survival across ethnic categories.
Product-limit estimate for 5-year survival.
Includes heart attack or angina.
In multivariable analyses, ethnicity, BMI at cohort entry, and surgery were statistically significant predictors of all-cause and breast cancer-specific mortality (Table 2). Japanese American women had lower risk of all cause and breast cancer-specific mortality relative to Caucasian women; only the estimate for all cause mortality reached statistical significance with an estimated 35% lower risk. African American and Latino women had higher breast cancer-specific mortality relative to Caucasian women; only the estimate for African American women reached statistical significance with an estimated 44% higher risk. Obese women had a statistically significant 54% higher risk of all-cause mortality and 45% higher risk for breast cancer-specific mortality relative to women with high-normal BMI (22.5–24.9 kg/m2). A higher, though non-significant, risk of mortality was observed in women with low-normal BMI (<22.5 kg/m2) relative to high-normal BMI. The suspected non-linear association of BMI with mortality, with higher risk of mortality associated with both obesity and low BMI, was confirmed with nonparametrical, restricted cubic splines (P < 0.01 for all-cause and P = 0.11 for breast cancer-specific mortality) (Figure1). Diabetes was significantly associated with mortality (all-cause HR = 2.05; 95% CI: 1.70, 2.48 and breast cancer-specific HR = 1.46; 95% CI: 1.06, 2.01) and adjustment for diabetes slightly attenuated the estimated HRs for the effect of obesity (all-cause HR = 1.35; 95% CI: 1.08, 1.69 and breast cancer-specific HR = 1.36; 95% CI: 0.98, 1.89).
Table 2.
Risk of all-cause and breast cancer-specific mortalitya for breast cancer cases in the Multiethnic Cohort study diagnosed 1993–2007.
| Cases | All-cause mortality |
Breast cancer-specific mortality |
|||||
|---|---|---|---|---|---|---|---|
| n | n | HR (95% CI) | Pb | n | HR (95% CI) | Pb | |
| Age at diagnosis, y | |||||||
| 50–59 | 506 | 110 | 1.00 | 78 | 1.00 | ||
| 60–69 | 1,515 | 263 | 1.17 (0.93, 1.47) | 155 | 0.98 (0.73, 1.30) | ||
| ≥ 70 | 1,821 | 431 | 2.27 (1.80, 2.86) | <0.001 | 143 | 1.15 (0.84, 1.56) | 0.31 |
| Ethnicity | |||||||
| African American | 748 | 226 | 1.04 (0.85, 1.27) | 115 | 1.44 (1.07, 1.94) | ||
| Caucasian | 991 | 226 | 1.00 | 93 | 1.00 | ||
| Native Hawaiian | 339 | 76 | 1.07 (0.82, 1.40) | 31 | 1.04 (0.69, 1.59) | ||
| Japanese American | 1,141 | 141 | 0.65 (0.53, 0.82) | 65 | 0.78 (0.56, 1.08) | ||
| Latino | 623 | 135 | 0.94 (0.75, 1.18) | 0.001 | 72 | 1.22 (0.89, 1.69) | 0.01 |
| BMI, kg/m2 | |||||||
| <22.5 | 836 | 155 | 1.13 (0.89, 1.42) | 71 | 1.22 (0.87, 1.71) | ||
| 22.5–24.9 | 807 | 139 | 1.00 | 69 | 1.00 | ||
| 25.0–29.9 | 1,298 | 262 | 1.15 (0.93, 1.42) | 123 | 1.17 (0.86, 1.58) | ||
| ≥ 30 | 901 | 248 | 1.54 (1.23, 1.91) | <0.001 | 113 | 1.45 (1.05, 2.00) | 0.04 |
| Cardiovascular comorbidity | |||||||
| None | 2,095 | 375 | 1.00 | 202 | 1.00 | ||
| Hypertension | 1,419 | 306 | 1.09 (0.93, 1.28) | 129 | 0.95 (0.75, 1.20) | ||
| Heart diseasec/stroke | 328 | 123 | 1.65 (1.34, 2.05) | <0.001 | 45 | 1.26 (0.90, 1.76) | 0.27 |
| Surgery | |||||||
| Conserving | 2,151 | 348 | 1.00 | 131 | 1.00 | ||
| Mastectomy | 1,461 | 352 | 0.90 (0.75, 1.08) | 173 | 1.06 (0.81, 1.38) | ||
| None/unknown | 230 | 104 | 2.07 (1.52, 2.82) | <0.001 | 72 | 2.49 (1.65, 3.75) | <0.001 |
| Chemotherapy | |||||||
| None/unknown | 2,913 | 568 | 1.00 | 206 | 1.00 | ||
| Yes | 929 | 236 | 1.02 (0.85, 1.23) | 0.82 | 170 | 1.17 (0.92, 1.49) | 0.21 |
| Radiotherapy | |||||||
| None/unknown | 2,021 | 505 | 1.00 | 237 | 1.00 | ||
| Yes | 1,821 | 299 | 0.69 (0.58, 0.83) | <0.001 | 139 | 0.78 (0.61, 1.00) | 0.05 |
BMI body mass index, HR hazard ratio, CI confidence interval
HR and 95% CI from Cox proportional hazards models adjusted for stage, hormone receptor status, smoking status, and years between cohort entry and diagnosis. Stage and hormone receptor status were included as time dependent variables.
P value based on Wald χ2 test. Test for trend provided for age at diagnosis and for BMI excluding women with BMI <22.5 kg/m2.
Includes heart attack or angina.
Figure 1.

HR and 95% CI for all-cause (A) and breast cancer-specific (B) mortality predicted by BMI using restricted cubic splines with knots at 22.5, 25.0 and 30.0 kg/m2 and 25.0 kg/m2 as the reference level. Models adjusted for age at diagnosis, ethnicity, cardiovascular comorbidity, treatment, stage, hormone receptor status, smoking status and years between cohort entry and diagnosis. Stage and hormone receptor status were included as time dependent variables.
BMI body mass index, HR hazard ratio, CI confidence interval
Years between cohort entry and diagnosis was not statistically significantly related to mortality (all-cause HR: 0.99; 95% CI: 0.96–1.01; breast cancer-specific HR: 0.98; 95% CI: 0.94–1.01), indicating that BMI at cohort entry likely represented the adult obesity levels that are relevant to mortality risk. Furthermore, there was limited evidence that years between cohort entry and diagnosis modified the effects of ethnicity or BMI level on all-cause and breast cancer-specific mortality (Pinteraction > 0.20 for all) (Table 3). Of interest was a statistically significant effect of age at diagnosis on breast cancer-specific mortality that was limited to women whose diagnosis was more than 4.25 years from entry into the cohort (Pinteraction = 0.03).
Table 3.
Risk of all-cause and breast cancer-specific mortalitya by years between cohort entry and diagnosis for breast cancer cases in the Multiethnic Cohort study diagnosed 1993–2007.
| All-cause mortality |
Breast cancer-specific mortality |
|||||||||
|---|---|---|---|---|---|---|---|---|---|---|
| ≤ 4.25 years |
> 4.25 years |
Pinteractionb | ≤ 4.25 years |
> 4.25 years |
Pinteractionb | |||||
| n | HR (95%CI) | n | HR (95%CI) | n | HR (95%CI) | n | HR (95%CI) | |||
| Age at diagnosis, y | ||||||||||
| 50–59 | 85 | 1.00 | 25 | 1.00 | 0.51 | 62 | 1.00 | 16 | 1.00 | 0.03 |
| 60–69 | 136 | 1.19 (0.90, 1.57) | 127 | 1.38 (0.90, 2.14) | 75 | 0.95 (0.67, 1.34) | 80 | 1.57 (0.89, 2.78) | ||
| ≥ 70 | 170 | 2.22 (1.67, 2.94) | 261 | 2.75 (1.79, 4.23) | 51 | 1.01 (0.67, 1.51) | 92 | 1.96 (1.09, 3.51) | ||
| Ptrend c | <0.001 | <0.001 | 0.99 | 0.02 | ||||||
| Ethnicity | ||||||||||
| African American | 103 | 0.98 (0.74, 1.31) | 123 | 1.09 (0.83, 1.44) | 0.92 | 55 | 1.31 (0.86, 2.00) | 60 | 1.63 (1.05, 2.51) | 0.91 |
| Caucasian | 111 | 1.00 | 115 | 1.00 | 49 | 1.00 | 44 | 1.00 | ||
| Native Hawaiian | 41 | 1.09 (0.75, 1.58) | 35 | 1.07 (0.72, 1.58) | 17 | 0.87 (0.48, 1.55) | 14 | 1.38 (0.73, 2.60) | ||
| Japanese American | 74 | 0.61 (0.45, 0.83) | 67 | 0.71 (0.52, 0.97) | 35 | 0.64 (0.40, 1.00) | 30 | 1.03 (0.63, 1.69) | ||
| Latino | 62 | 0.80 (0.57, 1.11) | 73 | 1.07 (0.79, 1.45) | 32 | 0.97 (0.61, 1.56) | 40 | 1.55 (0.98, 2.46) | ||
| P c | 0.01 | 0.11 | 0.05 | 0.15 | ||||||
| BMI, kg/m2 | ||||||||||
| <22.5 | 85 | 1.18 (0.85, 1.65) | 70 | 1.05 (0.75, 1.46) | 0.60 | 38 | 1.12 (0.70, 1.82) | 33 | 1.31 (0.80, 2.15) | 0.28 |
| 22.5–24.9 | 62 | 1.00 | 77 | 1.00 | 33 | 1.00 | 36 | 1.00 | ||
| 25.0–29.9 | 116 | 1.08 (0.78, 1.48) | 146 | 1.23 (0.93, 1.64) | 55 | 0.92 (0.59, 1.45) | 68 | 1.49 (0.97, 2.29) | ||
| ≥ 30 | 128 | 1.68 (1.21, 2.31) | 120 | 1.42 (1.05, 1.93) | 62 | 1.49 (0.94, 2.35) | 51 | 1.45 (0.91, 2.31) | ||
| Ptrend c | 0.001 | 0.04 | 0.06 | 0.16 | ||||||
| Cardiovascular comorbdity | ||||||||||
| None | 174 | 1.00 | 201 | 1.00 | 0.09 | 99 | 1.00 | 103 | 1.00 | 0.52 |
| Hypertension | 153 | 0.98 (0.78, 1.23) | 153 | 1.20 (0.96, 1.50) | 68 | 0.88 (0.63, 1.23) | 61 | 1.04 (0.74, 1.47) | ||
| Heart diseased/stroke | 64 | 1.54 (1.14, 2.09) | 59 | 1.67 (1.23, 2.26) | 21 | 1.03 (0.62, 1.70) | 24 | 1.34 (0.84, 2.18) | ||
| P c | 0.01 | <0.01 | 0.71 | 0.46 | ||||||
BMI body mass index, HR hazard ratio, CI confidence interval
HR and 95% CI from Cox proportional hazards models adjusted for stage, hormone receptor status, and smoking status. Stage and hormone receptor status were included as time dependent variables.
Pinteraction from Wald χ2 test with years between cohort entry and diagnosis log-transformed.
Pinteraction values based on Wald χ2 test. Test for trend provided with age at diagnosis and BMI excluding women with BMI <22.5 kg/m2.
Includes heart attack or angina.
Obese women, relative to women with high-normal BMI, had higher all-cause mortality across all ethnic groups, although the HR was only statistically significant for Caucasian women, and higher breast cancer specific-mortality across all ethnic groups except Native Hawaiian (Table 4). There was limited evidence of ethnic differences in the BMI effect on all-cause (Pinteraction = 0.87) or breast cancer-specific mortality (Pinteraction = 0.63). However, obese Caucasian and Native Hawaiian women had somewhat higher risk for all-cause mortality, and obese Caucasian and Japanese American women had somewhat higher risk for breast cancer-specific mortality compared to the other ethnic groups. Obese women diagnosed with ER+PR+ compared to ER−PR− tumors had a slightly higher risk of breast cancer-specific mortality (HR = 1.77; 95% CI: 0.95, 3.32 versus HR = 1.18, 95% CI: 0.63, 2.20, respectively) (Pinteraction = 0.52). No significant interaction was observed between BMI and age at diagnosis, stage, radiotherapy, or cardiovascular comorbidity (Pinteraction > 0.40 for all).
Table 4.
Modification of all-cause and breast cancer-specific mortalitya by BMI level and ethnicity for breast cancer cases in the Multiethnic Cohort study diagnosed 1993–2007.
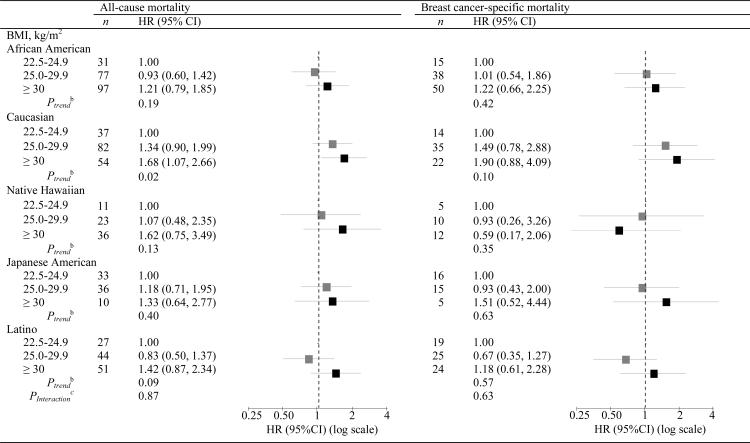
|
BMI body mass index, HR hazard ratio, CI confidence interval
HR and 95% CI from Cox proportional hazards models adjusted for stage, hormone receptor status, smoking status, and years between cohort entry and diagnosis. Stage and hormone receptor status were included as time dependent variables.
Ptrend from Wald χ2 test with BMI modeled as an ordinal variable.
Pinteraction from Wald χ2 test with log transformed BMI modeled as a continuous variable.
Discussion
In this ethnically diverse cohort of postmenopausal women diagnosed with breast cancer, all-cause and breast cancer-specific 5-year survival rates were 84% and 91%, respectively. After adjustment for breast cancer characteristics, including hormone receptor status, stage at diagnosis, and treatment, obese women had a modest increased risk of both all-cause (54%) and breast-cancer specific (45%) mortality compared to women with a high-normal BMI; however, being overweight did not significantly affect survival. There was limited evidence of ethnic differences in the obesity effect on all-cause or breast cancer-specific mortality, with a similar trend of higher risk with obesity across ethnic groups.
Our findings support the majority of individual studies [7, 8, 18–22] and meta-analyses [4, 6] that have provided evidence of a higher risk for breast cancer-specific mortality and/or recurrence in postmenopausal obese compared to non-obese women, with HRs ranging from 1.2 to 2.0 in obese women. Similar to our study, the higher risk of mortality associated with obesity has been shown in other studies that included ethnically diverse populations [7–9]. A higher, though non-significant, risk of mortality was observed in women with low-normal BMI relative to high-normal BMI that is consistent with other studies that have also observed a similar U-shaped association of BMI on mortality in breast cancer survivors [21, 23]. In particular, population-based studies in Korea [24] and Shanghai [21] found that being underweight (<18.5 kg/m2 relative to 18.5–24.9 kg/m2) was a risk factor for breast cancer recurrence and mortality. It is possible that high-normal BMI represents an optimal weight or that women with low-normal BMI are more susceptible to the adverse affects of breast cancer treatment or have a higher prevalence of pre-existing conditions not collected in our study. The U-shaped association is also consistent with studies of the effect of BMI on overall mortality [25, 26] including a collaborative analyses of 57 prospective studies that found a similar optimal relative weight of 22.5–25.0 kg/m2 [26].
Obese women have higher circulating levels of estrone, estradiol and free estradiol [27] due to the aromatization of androgens in peripheral or mammary adipose tissue. The higher circulating and local free estradiol may stimulate residual neoplastic cell proliferation [11] and contribute to more biologically aggressive ER-positive tumors in postmenopausal women [28]. Estrogen-independent pathways may also mediate the obesity-induced reduced survival. Several possible pathways are possible, notably adipokine production (e.g., adiponectin and leptin) and hyperinsulinemia may contribute to an aggressive breast cancer phenotype by promoting angiogenesis, invasion and migration [10, 29–31]. Moreover, pre-diagnostic diabetes, hyperinsulinemia and low levels of adiponectin are associated with worse breast cancer outcomes [16, 31, 32]. Systematic under-treatment may be another factor contributing to lower survival rates among overweight and obese women. Despite compelling evidence that weight-based doses are required to achieve full benefits of adjuvant chemotherapy [33]; overweight and obese women often receive unintentionally reduced doses [12]. Diabetic women may also receive less aggressive treatment [34, 35] due to diabetic-related complications [34].
Strengths of the current study include a population-based prospective design with a large number of ethnically diverse postmenopausal women. Our study is more easily generalizable to the largest ethnic groups in the US population than previous studies of primarily white women. The MEC is also well characterized with respect to covariates of interest allowing for adjustment of several potential confounding factors, such as HRT use, smoking and comorbidities. An additional strength is the ascertainment of incident breast cancer diagnoses through linkage with high-quality population-based tumor registries that provided detailed information on tumor characteristics as well as treatment within the 6 months of diagnosis.
Several limitations should be considered. Weight and height were self-reported and lean women tend to overestimate body weight whereas overweight and obese women tend to underestimate BMI values [36]; however the net effect would be attenuated HRs in that the increased mortality would be a conservative estimate of the true effect. Furthermore, health risk estimates associated with variations in BMI are similar whether based on self-report or measured BMI values [36]. The time between the completion of the baseline questionnaire and breast cancer diagnosis varied between women; however, models were adjusted for years between cohort entry and diagnosis, and no significant interaction was observed between this variable and BMI on mortality. Limited data were available for pre-existing conditions at the time of entry into the cohort and post-diagnostic BMI, weight change, or comorbidities. Given the reliability of the National Death Index linkage (e.g., sensitivity ≥87%) [37], misclassification of vital status is unlikely. As we only had information on mortality and not breast cancer recurrence, our study was limited by the small sample size for number of deaths of Native Hawaiian and Japanese American women that affected the precision of our HR estimates. Data on hormone receptor status was incomplete for 31% of the women and data on Her2/neu expression was unavailable.
Our findings are of public health importance because of the potential weight gain reported as a result of treatment regimens for breast cancer, notably adjuvant chemotherapy [38]. The available data examining the influence of pre- to post diagnosis weight gain on survival are limited and inconclusive [20, 21, 39, 40]. Further investigations among ethnically diverse groups of women are warranted as we did not have a sufficient number of breast cancer-specific deaths to definitively evaluate ethnic-specific trends in mortality. Our findings are consistent with the literature that maintaining moderate weight throughout adult life may be beneficial for breast cancer survival in postmenopausal women and this appears to hold for all ethnic groups.
Acknowledgements
We thank all the participants in the Multiethnic Cohort Study. The Multiethnic Cohort Study has been supported by US Public Health Service (National Cancer Institute) grant R37 CA 54281. SMC was supported by a postdoctoral fellowship on grant R25 CA 90956. The tumor registries are supported by NCI contracts N01-PC-35137 and N01-PC-35139.
Abbreviations
- BMI
body mass index
- CI
confidence interval
- ER
estrogen receptor
- HR
hazard ratio
- HRT
hormone replacement therapy
- MEC
Multiethnic Cohort
- PR
progesterone receptor
- SEER
Surveillance, Epidemiology, and End Results
Footnotes
Conflict of interest All authors (Conroy, Maskarinec, Wilkens, White, Henderson, Kolonel) declare that they have no conflicts of interest.
References
- 1.Rosenberg J, Chia YL, Plevritis S. The effect of age, race, tumor size, tumor grade, and disease stage on invasive ductal breast cancer survival in the U.S. SEER database. Breast Cancer Res Treat. 2005;89:47–54. doi: 10.1007/s10549-004-1470-1. [DOI] [PubMed] [Google Scholar]
- 2.Altekruse SF, Kosary CL, Krapcho M, et al., editors. SEER Cancer Statistics Review, 1975–2007. National Cancer Institute; Bethesda, MD: 2010. [Accessed March 15 2010]. http://seer.cancer.gov/csr/1975_2007/. [Google Scholar]
- 3.Dunnwald LK, Rossing MA, Li CI. Hormone receptor status, tumor characteristics, and prognosis: a prospective cohort of breast cancer patients. Breast Cancer Res. 2007;9:R6. doi: 10.1186/bcr1639. [DOI] [PMC free article] [PubMed] [Google Scholar]
- 4.Patterson RE, Cadmus LA, Emond JA, Pierce JP. Physical activity, diet, adiposity and female breast cancer prognosis: A review of the epidemiologic literature. Maturitas. 2010;66:5–15. doi: 10.1016/j.maturitas.2010.01.004. [DOI] [PubMed] [Google Scholar]
- 5.Flegal KM, Carroll MD, Ogden CL, Curtin LR. Prevalence and trends in obesity among US adults, 1999–2008. JAMA. 2010;303:235–241. doi: 10.1001/jama.2009.2014. [DOI] [PubMed] [Google Scholar]
- 6.Protani M, Coory M, Martin JH. Effect of obesity on survival of women with breast cancer: systematic review and meta-analysis. Breast Cancer Res Treat. 2010;123:627–635. doi: 10.1007/s10549-010-0990-0. [DOI] [PubMed] [Google Scholar]
- 7.Maskarinec G, Pagano I, Lurie G, Bantum E, Gotay CC, Issell BF. Factors affecting survival among women with breast cancer in hawaii. J Womens Health (Larchmt) 2011;20:231–237. doi: 10.1089/jwh.2010.2114. [DOI] [PMC free article] [PubMed] [Google Scholar]
- 8.Petrelli JM, Calle EE, Rodriguez C, Thun MJ. Body mass index, height, and postmenopausal breast cancer mortality in a prospective cohort of US women. Cancer Causes Control. 2002;13:325–332. doi: 10.1023/a:1015288615472. [DOI] [PubMed] [Google Scholar]
- 9.Dignam JJ, Wieand K, Johnson KA, et al. Effects of obesity and race on prognosis in lymph node-negative, estrogen receptor-negative breast cancer. Breast Cancer Res Treat. 2006;97:245–254. doi: 10.1007/s10549-005-9118-3. [DOI] [PubMed] [Google Scholar]
- 10.Rose DP, Gilhooly EM, Nixon DW. Adverse effects of obesity on breast cancer prognosis, and the biological actions of leptin (review) Int J Oncol. 2002;21:1285–1292. [PubMed] [Google Scholar]
- 11.Calle EE, Kaaks R. Overweight, obesity and cancer: epidemiological evidence and proposed mechanisms. Nat Rev Cancer. 2004;4:579–591. doi: 10.1038/nrc1408. [DOI] [PubMed] [Google Scholar]
- 12.Griggs JJ, Sorbero ME, Lyman GH. Undertreatment of obese women receiving breast cancer chemotherapy. Arch Intern Med. 2005;165:1267–1273. doi: 10.1001/archinte.165.11.1267. [DOI] [PubMed] [Google Scholar]
- 13.Kolonel LN, Henderson BE, Hankin JH, et al. A multiethnic cohort in Hawaii and Los Angeles: baseline characteristics. Am J Epidemiol. 2000;151:346–357. doi: 10.1093/oxfordjournals.aje.a010213. [DOI] [PMC free article] [PubMed] [Google Scholar]
- 14.Hankey BF, Ries LA, Edwards BK. The surveillance, epidemiology, and end results program: a national resource. Cancer Epidemiol Biomarkers Prev. 1999;8:1117–1121. [PubMed] [Google Scholar]
- 15.Henderson SO, Haiman CA, Wilkens LR, Kolonel LN, Wan P, Pike MC. Established risk factors account for most of the racial differences in cardiovascular disease mortality. PLoS One. 2007;2:e377. doi: 10.1371/journal.pone.0000377. [DOI] [PMC free article] [PubMed] [Google Scholar]
- 16.Peairs KS, Barone BB, Snyder CF, et al. Diabetes mellitus and breast cancer outcomes: a systematic review and meta-analysis. J Clin Oncol. 2011;29:40–46. doi: 10.1200/JCO.2009.27.3011. [DOI] [PMC free article] [PubMed] [Google Scholar]
- 17.Durrleman S, Simon R. Flexible regression models with cubic splines. Stat Med. 1989;8:551–561. doi: 10.1002/sim.4780080504. [DOI] [PubMed] [Google Scholar]
- 18.Dal Maso L, Zucchetto A, Talamini R, et al. Effect of obesity and other lifestyle factors on mortality in women with breast cancer. Int J Cancer. 2008;123:2188–2194. doi: 10.1002/ijc.23747. [DOI] [PubMed] [Google Scholar]
- 19.Imkampe AK, Bates T. Impact of a Raised Body Mass Index on Breast Cancer Survival in Relation to Age and Disease Extent at Diagnosis. Breast J. 2010;16:156–161. doi: 10.1111/j.1524-4741.2009.00872.x. [DOI] [PubMed] [Google Scholar]
- 20.Caan BJ, Kwan ML, Hartzell G, et al. Pre-diagnosis body mass index, post-diagnosis weight change, and prognosis among women with early stage breast cancer. Cancer Causes Control. 2008;19:1319–1328. doi: 10.1007/s10552-008-9203-0. [DOI] [PMC free article] [PubMed] [Google Scholar]
- 21.Chen X, Lu W, Zheng W, et al. Obesity and weight change in relation to breast cancer survival. Breast Cancer Res Treat. 2010;122:823–833. doi: 10.1007/s10549-009-0708-3. [DOI] [PMC free article] [PubMed] [Google Scholar]
- 22.Patterson RE, Flatt SW, Saquib N, et al. Medical comorbidities predict mortality in women with a history of early stage breast cancer. Breast Cancer Res Treat. 2010;122:859–865. doi: 10.1007/s10549-010-0732-3. [DOI] [PMC free article] [PubMed] [Google Scholar]
- 23.Suissa S, Pollak M, Spitzer WO, Margolese R. Body size and breast cancer prognosis: a statistical explanation of the discrepancies. Cancer Res. 1989;49:3113–3116. [PubMed] [Google Scholar]
- 24.Moon HG, Han W, Noh DY. Underweight and breast cancer recurrence and death: a report from the Korean Breast Cancer Society. J Clin Oncol. 2009;27:5899–5905. doi: 10.1200/JCO.2009.22.4436. [DOI] [PubMed] [Google Scholar]
- 25.Bessonova L, Marshall SF, Ziogas A, et al. The association of body mass index with mortality in the california Teachers Study. Int J Cancer. 2011 doi: 10.1002/ijc.25905. DOI: 10.1002/ijc.25905. [DOI] [PMC free article] [PubMed] [Google Scholar]
- 26.Whitlock G, Lewington S, Sherliker P, et al. Body-mass index and cause-specific mortality in 900 000 adults: collaborative analyses of 57 prospective studies. Lancet. 2009;373:1083–1096. doi: 10.1016/S0140-6736(09)60318-4. [DOI] [PMC free article] [PubMed] [Google Scholar]
- 27.McTiernan A, Rajan KB, Tworoger SS, et al. Adiposity and sex hormones in postmenopausal breast cancer survivors. J Clin Oncol. 2003;21:1961–1966. doi: 10.1200/JCO.2003.07.057. [DOI] [PMC free article] [PubMed] [Google Scholar]
- 28.Lonning PE, Helle H, Duong NK, Ekse D, Aas T, Geisler J. Tissue estradiol is selectively elevated in receptor positive breast cancers while tumour estrone is reduced independent of receptor status. J Steroid Biochem Mol Biol. 2009;117:31–41. doi: 10.1016/j.jsbmb.2009.06.005. [DOI] [PubMed] [Google Scholar]
- 29.Brakenhielm E, Veitonmaki N, Cao R, et al. Adiponectin-induced antiangiogenesis and antitumor activity involve caspase-mediated endothelial cell apoptosis. Proc Natl Acad Sci USA. 2004;101:2476–2481. doi: 10.1073/pnas.0308671100. [DOI] [PMC free article] [PubMed] [Google Scholar]
- 30.Rene Gonzalez R, Watters A, Xu Y, et al. Leptin-signaling inhibition results in efficient anti-tumor activity in estrogen receptor positive or negative breast cancer. Breast Cancer Res. 2009;11:R36. doi: 10.1186/bcr2321. [DOI] [PMC free article] [PubMed] [Google Scholar]
- 31.Lann D, LeRoith D. The role of endocrine insulin-like growth factor-I and insulin in breast cancer. J Mammary Gland Biol Neoplasia. 2008;13:371–379. doi: 10.1007/s10911-008-9100-x. [DOI] [PubMed] [Google Scholar]
- 32.Duggan C, Irwin ML, Xiao L, et al. Associations of insulin resistance and adiponectin with mortality in women with breast cancer. J Clin Oncol. 2011;29:32–39. doi: 10.1200/JCO.2009.26.4473. [DOI] [PMC free article] [PubMed] [Google Scholar]
- 33.Sparreboom A, Wolff AC, Mathijssen RH, et al. Evaluation of alternate size descriptors for dose calculation of anticancer drugs in the obese. J Clin Oncol. 2007;25:4707–4713. doi: 10.1200/JCO.2007.11.2938. [DOI] [PubMed] [Google Scholar]
- 34.Srokowski TP, Fang S, Hortobagyi GN, Giordano SH. Impact of diabetes mellitus on complications and outcomes of adjuvant chemotherapy in older patients with breast cancer. J Clin Oncol. 2009;27:2170–2176. doi: 10.1200/JCO.2008.17.5935. [DOI] [PMC free article] [PubMed] [Google Scholar]
- 35.van de Poll-Franse LV, Houterman S, Janssen-Heijnen ML, Dercksen MW, Coebergh JW, Haak HR. Less aggressive treatment and worse overall survival in cancer patients with diabetes: a large population based analysis. Int J Cancer. 2007;120:1986–1992. doi: 10.1002/ijc.22532. [DOI] [PubMed] [Google Scholar]
- 36.Stommel M, Schoenborn CA. Accuracy and usefulness of BMI measures based on self-reported weight and height: findings from the NHANES & NHIS 2001–2006. BMC Public Health. 2009;9:421. doi: 10.1186/1471-2458-9-421. [DOI] [PMC free article] [PubMed] [Google Scholar]
- 37.Cowper DC, Kubal JD, Maynard C, Hynes DM. A primer and comparative review of major US mortality databases. Ann Epidemiol. 2002;12:462–468. doi: 10.1016/s1047-2797(01)00285-x. [DOI] [PubMed] [Google Scholar]
- 38.Goodwin PJ, Ennis M, Pritchard KI, et al. Adjuvant treatment and onset of menopause predict weight gain after breast cancer diagnosis. J Clin Oncol. 1999;17:120–129. doi: 10.1200/JCO.1999.17.1.120. [DOI] [PubMed] [Google Scholar]
- 39.Kroenke CH, Chen WY, Rosner B, Holmes MD. Weight, weight gain, and survival after breast cancer diagnosis. J Clin Oncol. 2005;23:1370–1378. doi: 10.1200/JCO.2005.01.079. [DOI] [PubMed] [Google Scholar]
- 40.Nichols HB, Trentham-Dietz A, Egan KM, et al. Body mass index before and after breast cancer diagnosis: associations with all-cause, breast cancer, and cardiovascular disease mortality. Cancer Epidemiol Biomarkers Prev. 2009;18:1403–1409. doi: 10.1158/1055-9965.EPI-08-1094. [DOI] [PMC free article] [PubMed] [Google Scholar]