

Abstract
The glycocalyx or endocapillary layer on the luminal surface of microvessels has a major role in the exclusion of macromolecules from the underlying endothelial cells. Current structural evidence in the capillaries of frog mesentery indicates a regularity in the structure of the glycocalyx, with a center-to-center fiber spacing of 20 nm and a fiber width of 12 nm, which might explain the observed macromolecular filtering properties. In this study, we used electron micrographs of tissues prepared using perfusion fixation and tannic acid treatment. The digitized images were analyzed using autocorrelation to find common spacings and to establish whether similar structures, hence mechanisms, are present in the microvessel glycocalyces of a variety of mammalian tissues. Continuous glycocalyx layers in mammalian microvessels of choroid, renal tubules, glomerulus, and psoas muscle all showed similar lateral spacings at ∼19.5 nm (possibly in a quasitetragonal lattice) and longer spacings above 100 nm. Individual glycocalyx tufts above fenestrations in the first three of these tissues and also in stomach fundus and jejunum showed evidence for similar short-range structural regularity, but with more disorder. The fiber diameter was estimated as 18.8 (± 0.2) nm, but we believe this is an overestimate because of the staining method used. The implications of these findings are discussed.
Introduction
The glycocalyx covering the luminal surface of vascular endothelium has been proposed to have many important functions. This article concerns its role as a molecular filter. The ultrafiltration properties of endothelium are widely recognized (1), and when the glycocalyx was first identified, it was proposed that it is a molecular filter (2). In most tissues, microvascular endothelium allows the rapid exchange of water and small molecules between circulating blood plasma and the interstitial fluids, but it acts as a barrier to the passage of macromolecules. The resulting concentrations of macromolecules in the plasma which are higher than those in interstitial fluid, are responsible for osmotic pressures across microvascular walls that hold the blood in the vascular system. Although the physiological concepts of endothelia as ultrafilters have been understood and developed over the past 80–90 years (for recent review, see, e.g., Levick and Michel (3)), the features of endothelial ultrastructure responsible for molecular sieving have been more difficult to identify.
General recognition of the glycocalyx as a barrier to macromolecules followed the report by Vink and Duling (4) of direct observations of macromolecules being excluded from the inner surfaces of living capillaries. During the 31 years between Luft's (2) first description of the glycocalyx in electron micrographs of ruthenium-red-stained microvessels and its wide recognition as a barrier to macromolecules, the pathways for small molecules through the endothelium were identified as the fenestrations of fenestrated endothelia (5) and as occasional openings in the junctions between adjacent endothelial cells in continuous (nonfenestrated) endothelia (6–9). Also, the concept that the glycocalyx acted as a fiber-matrix ultrafilter was developed as a quantitative theory by Curry and Michel (10). They pointed out that if the glycocalyx structure were similar in all endothelia and enabled it to as act as the molecular filter of endothelial cells at their plasma interface, it could account for the very similar molecular sieving properties of fenestrated and continuous endothelia despite their very different ultrastructural appearance and hydraulic permeabilities. The glycocalyx determines the ultrafiltration properties of fenestrated and nonfenestrated microvessels, but the absolute values of their permeability to water and small solute molecules depend on the number of channels per unit area passing through the endothelium beneath the glycocalyx (e.g., in fenestrae and intercellular clefts).
The glycocalyx consists of membrane-bound glycoproteins, sulfated proteoglycans (e.g., heparin sulfate and chondroitin sulfate), hyaluronan and plasma proteins. Although the chemical structure of these components is known, and there is evidence suggesting that heparin sulfate is distributed more superficially than chondroitin sulfate and hyaluronan (11), the spatial relationships of molecules within the glycocalyx have not been established in sufficient detail to indicate how the glycocalyx might be a molecular sieve. In a previous attempt to address this question, Squire et al. (12) examined the glycocalyx of nonfenestrated frog mesenteric capillaries prepared for electron microscopy by a range of different techniques. Guided by the proposal that the most effective fiber-matrix filters would have evenly spaced fibers (13), they analyzed these micrographs using fast Fourier transforms and autocorrelation functions. In rapidly frozen, deep-etched preparations of glycocalyx, they identified a network of fibrous molecules with a characteristic spacing of 20 nm. Later work on these preparations indicated that the regularly distributed fibers occurred in clusters with a common intercluster spacing of ∼100 nm. These preparations were made without exposing the tissues to chemical fixatives, but a similar analysis of electron micrographs of frog microvessels, prepared using conventional fixation and staining techniques, also displayed the 20-nm spacing and further suggested a fiber diameter of ∼12 nm. The structural model proposed by Squire et al. (12) (Fig. 1) concluded that the 8-nm spacing between the fibers is consistent with molecular filtration through vascular endothelia and suggested that the 100-nm intercluster spacing reflected attachments by transmembrane proteins to a quasiregular submembrane actin network. This structure has been adapted for mathematical modeling of the permeability and mechanical properties of the glycocalyx in a series of studies by Weinbaum and colleagues (e.g., (14–16)).
Figure 1.
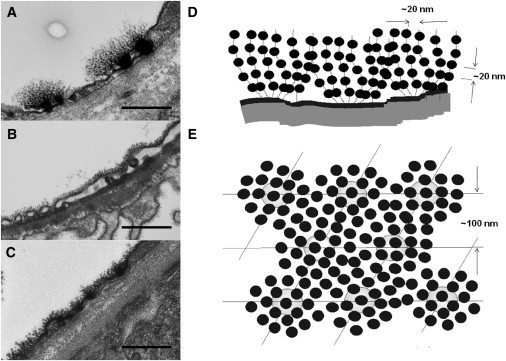
Three TEM rat tissue examples of glycocalyx, from the jejunum capillary (A), the glomerular capillary (B), and the peritubular capillary (C), stained using the Rostgaard perfusion technique (17), with a previously proposed model from Squire et al. (12) (printed with permission); scale bar, 500 nm. (D) Model from the same view as for A–C. (E) Same model as in D from the planar view. The spacings shown in the model are from the predominant peaks from frog mesentery. The mean spacing between the fibers was found to be 20 nm, but regularity was limited to one or two orders in most cases, presumably by a fluid model (nearest-neighbor) system. The 100-nm spacing was proposed to be from glycocalyx tufts linked to an underlying cytoskeletal array of filaments such as actin.
This study has two principal aims: first, to determine whether the luminal endothelial glycocalyx of mammalian microvessels has a regular structure like that found in nonfenestrated frog capillaries; and second, to determine whether the glycocalyx overlying fenestrations of fenestrated endothelia has a similar structure to that overlying nonfenestrated endothelia. Using the approach of Squire et al. (12), we were able to examine material prepared by the novel fixation technique of Rostgaard et al. (17), who described the glycocalyx or sieve plugs covering fenestrations of microvessels in small intestine, stomach, and kidney (18–20). To analyze images from a large number of specimens, the method of autocorrelation analysis has been developed and partly automated, thus speeding up analysis time and increasing its objectivity. Our findings for fenestrated and nonfenestrated endothelia of rats and rabbits appear to be consistent with the general features of the model of Squire et al. (12), suggesting that the fundamental structural features found in the original study of the frog glycocalyx are similar to those found in mammals.
Methods
Transmission electron microscopy of the glycocalyx
The images of glycocalyx analyzed in this study were taken from a collection of ∼1000 transmission electron micrographs (TEMs) of microvessels in various tissues of 13 Wistar rats and four dwarf rabbits.
The tissues were prepared according to the methods described by Rostgaard et al. and some of the images have already been used in a series of publications by Rostgaard, Qvortrup, and collaborators (17,18,20). (See the Supporting Material for further details.)
Images were scanned from 35-mm film or 8 × 9-cm plates into 8-bit TIFF images (CoolScan LS9000, Nikon, Tokyo, Japan). Depending on the TEM magnification, the image resolution was between 1.3 nm/pixel (5200× magnification) and 0.14 nm/pixel (50,000× magnification). Of these micrographs, 174 were used for this study; the others were rejected for various objective reasons, including lack of stained glycocalyx, duplications of the same area at different magnifications (the highest magnification was always used), overstaining (too electron dense to reveal structure), or uncertainty about the magnification or tissue source.
Analysis of TEM micrographs
Small rectangular image areas were selected from the micrographs, with one side parallel to the endothelial membrane. The areas containing the full height of glycocalyx were then processed using home-generated macros in ImageJ software (21). The autocorrelation function (AC) was calculated, and a profile was taken parallel to the membrane to determine any common spacing information.
The image analysis process was based around autocorrelation to find any predominant spacings, as in a previous study (12). Intensity profiles from the AC images were taken in a direction parallel to the underlying membrane. The process is demonstrated in the Supporting Material for a model lattice covered and partly obscured by deliberately extreme random noise.
The AC profiles were then fitted for peaks using Peakfit 4 (Jandel Scientific Software, San Rafael, CA), with both a residual regime and a second-differential regime, on automatic settings for Gaussian fits. The residual regime places an estimated peak at maxima and then extra estimated peaks where the residuals of the resulting fit are the highest. The second-differential regime estimates the peak positions from minima in the second differential. The estimated peak positions from both regimes were then iterated to find the best fit. Neither regime appeared to perform better than the other when compared to fitting by eye, so peak positions from both methods were included in further analysis (see Fig. 3). All peaks were used for analysis, and the full width at half-maximum (FWHM) of each fitted peak was also noted. From these ACs, a frequency distribution (FD) was computed. The frequencies of occurrence of each peak spacing in the ACs were placed in spacing bins of 1-nm width. When comparing different samples, this FD was normalized to the number of fits taken. The frequencies were then smoothed using a triangular smoothing protocol (using either 3 points for graphs of spacing range 0–100 nm, or 5 points where the range was 0–300 nm). The maxima in the observed FD show the most common values for the center-to-center fiber distance.
Figure 3.
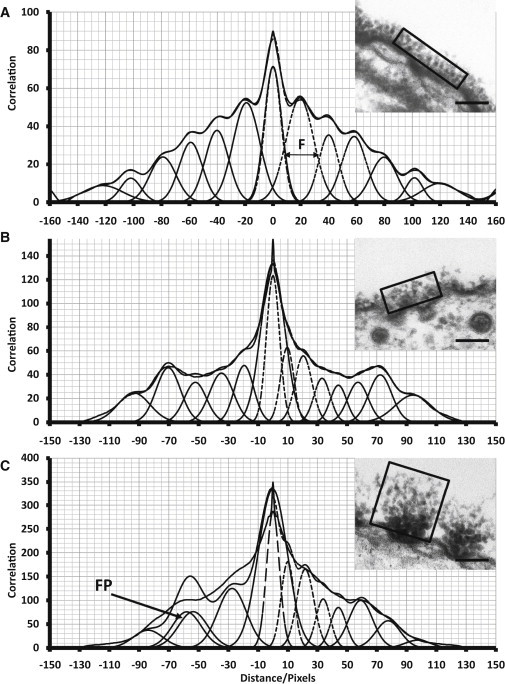
Analysis method demonstrated on a peritubular capillary (A), a psoas muscle capillary (B), and a fundus capillary (C) from the boxed areas (rectangular outline) in the micrographs (insets). The AC was then obtained as described in the Supporting Material. An intensity profile was taken parallel to the membrane. A constant background was subtracted relative to the lowest value in the profile. To obtain the peaks from the (symmetric) AC intensity profile, a residuals method (negative spacing values) and a second-differential method (positive values) were used in Peakfit 4 (Jandel) to determine Gaussian peaks. An example of a false positive (FP) is shown in C. The resulting fit is also shown (dashed lines). An example of a FWHM measurement is given by the arrow (F) in A.
If there is 2-D regularity in the fiber array in the plane parallel to the endothelial cell membrane, then the two extreme regular lattice formations would be a square lattice of fibers or a hexagonal lattice. In reality, something between these two extremes might be more likely, especially when the large degree of disorder is considered. The expected results from a pure square lattice viewed as a projection from the side are demonstrated in Fig. 2. The peaks in the AC are seen at the expected multiples of the interplanar spacing (d) and also at 1.41 (√2) and 2.24 (√5) × d. In a square lattice, d is the same as the center-to-center fiber spacing (b). It should be noted that the AC profile drops to zero between the peaks only if the object (in this case a fiber) on the lattice has very small width. It does not reach zero between the peaks if the objects have an appreciable size. Depending on the direction through such a lattice that a particular EM section has included, any of these observed peaks could be seen as maxima in the FD. A hexagonal lattice, not shown, would give a similar result, but with the first few peaks in the AC appearing at 1.73 (√3) and 2.65 (√7) × d. With hexagonal packing, the lattice parameter (b spacing) is d/cos30. The FWHM values from all the peaks are also plotted in the distribution in Fig. 2 D, where the mean gives a good approximation to the fiber diameter. It was found by a computational model (data not shown) that section thickness variation would not alter the outcome with these numbers of image areas.
Figure 2.
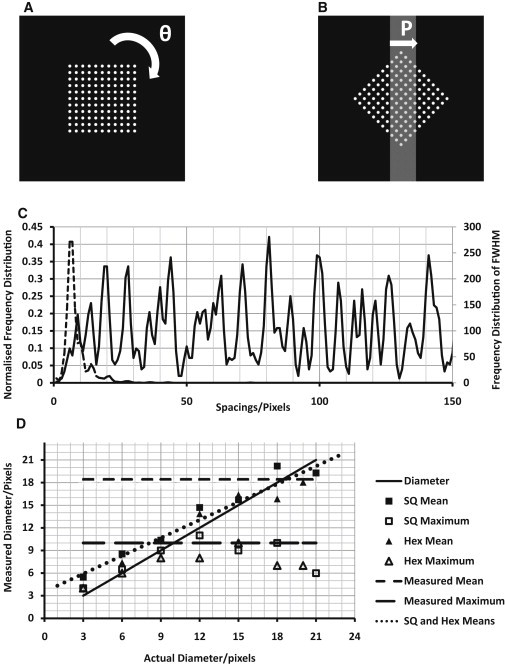
Results from peak-fitting autocorrelations of the projections (every 3°) of a square lattice. (A and B) To mimic our protocol, square and hexagonal (not shown) lattices of 20-pixel b spacing were drawn with different point diameters (9-pixel point diameter shown in A). (B) These lattices were rotated (θ) every 3°, and projections, P, were taken through a central rectangular slice 80 pixels thick, to represent section thickness. (C) The autocorrelations were fitted for peaks (as described in Methods), and a normalized FD was plotted (solid line). FD was also plotted for the FWHM of the peaks (dotted line). (D) The mean of the FWHM FD (solid points) and the maximum diameters (open points) were plotted against their measured diameters. The means are proportional (dotted line) to the actual fiber diameter, and our physiological measurements (horizontal dashed lines) are plotted with an unknown actual diameter for analytical interpretation.
Note finally that there can be false positives (e.g., Fig. 3 C, FP) in the AC peak fitting. The main causes of this are either that two peaks have been used by PeakFit to fit what appears as a single peak in the AC (sometimes arising from two estimated peaks moving toward each other in successive iterations), or that an extra peak of uncertain reliability has been included in the dips between prominent peaks. It was decided not to leave peaks out of the data in a subjective way, since the number involved was low and only added to the background noise. All peaks are included in the final analysis.
Results
General observations
Staining using the Rostgaard method produced glycocalyx images with good contrast. Except for the choriocapillaris, the general shape and structure of these samples has been reported before (17–20). In the choriocapillaris of the dwarf rabbit, the staining of the glycocalyx appears similar to the peritubular capillary staining in the rat.
The stained glycocalyx in all preparations was typically between 50 and 100 nm in height. The only deviation from this was in the capillaries of the fundus of the stomach (FSC) and the jejunum capillaries, where the height was 150–200 nm. In these tissues, the glycocalyx was only seen above the fenestrations, where it had a tuftlike appearance. The endothelial cell lipid bilayer was visible in most micrographs and none of the micrograph areas selected for study showed evidence of the membrane being cut obliquely. Furthermore, small deviations in the viewing angle are unlikely to have a great effect on the values for spacing, since the spacings were measured parallel to the membrane.
Analysis was carried out on 368 image areas (m = 368) from 174 different micrographs (n = 174). The numbers of images analyzed for each type of vessel are summarized in Table 1. The number of independent observations made on most types of vessel was large enough (28–102), and the variations between samples small enough, for us to be confident that mean values represent a real structural feature of the fixed and stained glycocalyx. Exceptional in this respect are values for the glycocalyces of aorta and the capillaries of the diaphragm and pancreas, where there were too few useful areas to provide definitive individual results (Table 1). Data from these tissues were only included when combining the results from all specimens. The quality of the ACs varied from image area to image area (Fig. 3). A low proportion of image areas, mainly from low-magnification micrographs, had little visible structure in the AC profile, but to maintain objectivity these were not excluded. Most AC profiles were similar to those in Fig. 3.
Table 1.
Summary of results
| Tissue | No. of blocks | Species | Glycocalyx type | No. of micrographs |
No. of areas used |
Peak spacings from FD plot (nm) |
|||||||||
|---|---|---|---|---|---|---|---|---|---|---|---|---|---|---|---|
| (n) | (m) | d | 2 × d | ||||||||||||
| OBSERVED | |||||||||||||||
| Choriocapillaris | 4 | 2 Russian dwarf rabbit (Mol:Russian) & 2 Wistar rats | Nonfen | 26 | 47 | 9 | 15 | 20 | 27 | 34 | 39 | 45 | 52 | ||
| Peritubules | 4 | 2 Wistar rats (M) & 1 Wistar rat (M) GA + Alcian blue | Nonfen | 12 | 24 | 9 | 19 | 28 | 29 | 37 | 44 | 52 | |||
| Glomerulus | 3 | 2 Wistar rat (M) | Nonfen | 22 | 43 | 16 | 20 | 25 | 34 | 38 | 44 | 53 | |||
| Psoas | 2 | 2 Wistar rats (M) | Nonfen | 16 | 28 | 7 | 14 | 19 | 27 | 31 | 38 | 52 | |||
| Mean | 8.33 | 15.00 | 19.50 | 26.75 | 32.00 | 38.00 | 44.33 | 52.25 | |||||||
| THEORETICAL | |||||||||||||||
| Tetragonal | 8.72 | 13.79 | 19.50 | 27.58 | 39.00 | 43.60 | 55.15 | ||||||||
| Hexagonal | 7.24 | 10.82 | 19.50 | 33.74 | 39.00 | 51.59 | |||||||||
| OBSERVED | |||||||||||||||
| Choriocapillaris | 4 | 2 Russian dwarf rabbit (Mol:Russian) & 2 Wistar rats (M) | Fenestrated | 24 | 63 | 10 | 20 | 26 | 32 | ||||||
| Peritubules | 4 | 2 Wistar rats (M) | Fenestrated | 18 | 37 | 10 | 18 | 28 | 32 | 39 | 45 | 52 | |||
| Glomerulus | 3 | 2 Wistar rat (M) | Fenestrated | 19 | 38 | 12 | 19 | 27 | 37 | 45 | |||||
| Fundus | 4 | 1 Wistar rat (M) Pentagastrin-treated & 1 Wistar rat (M) | Fenestrated | 35 | 102 | 7 | 14 | 23 | 33 | 40 | 51 | ||||
| Jejunum | 2 | 1 Wistar rat (M) | Fenestrated | 15 | 35 | 9 | 18 | 24 | 39 | 54 | |||||
| Mean | 9.00 | 13.00 | 19.60 | 24.00 | 27.00 | 32.33 | 38.75 | 45.00 | 52.33 | ||||||
| Aorta | 1 | 1 Wistar rat (M) GA + Alcian Blue | Nonfen | 2 | 4 | ||||||||||
| Diaphragm | 1 | 1 Wistar rat (M) | Fenestrated | 2 | 2 | ||||||||||
| Pancreas | 1 | 1 Wistar rat (M) GA + Alcian Blue | Fenestrated | 6 | 11 | ||||||||||
| TOTALS | 137 | 434 | |||||||||||||
This includes the tissues, species and the number of tissue blocks along with the total number of micrographs and image areas analyzed. Also shown is a summary of observed fiber spacings (d) along with expected theoretical values. GA, glutaraldehyde; m, number of image areas used; M, male; n, number of micrographs; Nonfen, nonfenestrated area.
Psoas muscle capillaries with no fenestrations, and choriocapillaris with large interfenestration distances, showed clearly defined spacings (Fig. 4), whereas the fundus and jejunum capillaries, with tufts of glycocalyx only above fenestrations, had more spread in their peak FD (Fig. 5). All the tissues analyzed have FD peaks around 20 nm and 28 nm. In the case of the psoas muscle FD, the 20-nm peak is swamped by a peak at ∼14 nm. In many tissues, there is also this lower FD peak at ∼14 nm, but it is usually a minor peak.
Figure 4.
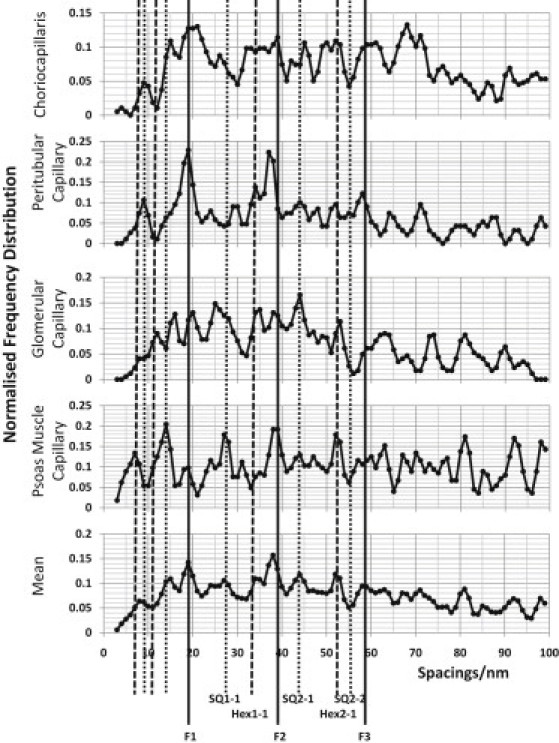
FD plots of the observed glycocalyx fiber spacings up to 100 nm measured from glycocalyx not over fenestrations. The FD is normalized to the number of fits. The vertical lines indicate expected positions for peaks from a tetragonal lattice (SQ) of observed side (b) 19.5 nm and a hexagonal lattice (Hex) of side b = 19.5/cos30 nm. The lines designated F1–F3 are fundamental lines associated with interplanar spacings in both lattices.
Figure 5.
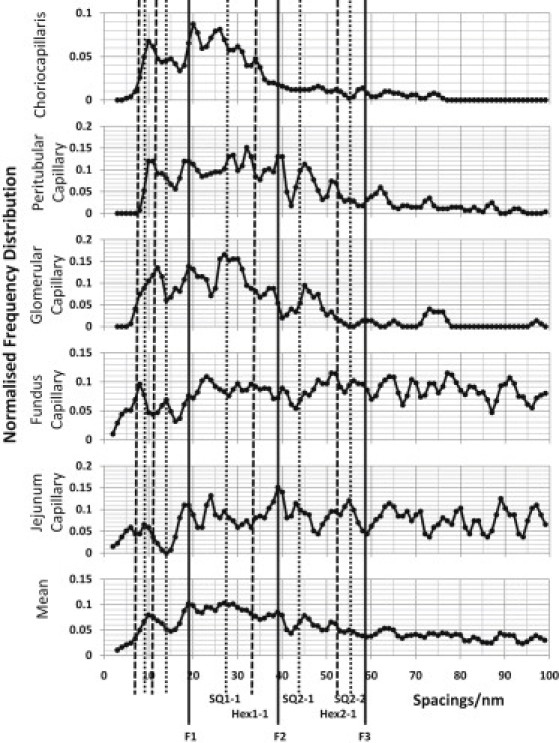
Same as for Fig. 4, but for FD plots of the interplanar glycocalyx fiber spacings up to 100 nm for capillaries in different tissues measured from glycocalyx over fenestrations.
The glycocalyx of fenestrations versus nonfenestrated areas
The fenestrae of fenestrated endothelium are the major pathways for the transport of fluid and small molecules through the cells and also the site of molecular sieving. The question arises as to whether the glycocalyx structures away from fenestrations are similar to those above fenestrations, as well as whether there are particular similarities between the glycocalyces over fenestrations in different tissues. Image areas not over fenestrations and image areas over fenestrations were processed separately. The individual tissue FDs and the summed data for either nonfenestrated (Fig. 4) or fenestrated (Fig. 5) areas are shown. From Fig. 4, one may also compare the nonfenestrated areas of fenestrated capillaries (choriocapillaris, peritubular, and glomerular) with areas of glycocalyx in nonfenestrated capillaries (psoas). All the profiles in Figs. 4 and 5 show clear FD peaks. There are peaks in the profiles that occur in the same places in each, and these are enhanced in the average profiles at the bottoms of Figs. 4 and 5.
The protocol is clearly not sampling a highly regular 2-D lattice in a plane parallel to the endothelial membrane, but there are clear indications of some regularity in the array of fibers in both fenestrated and nonfenestrated glycocalyx. It should also be noted that the FD plots do not show how prominent a particular peak is in the original AC profiles. Since all identified peaks in a particular AC profile are counted as one observation, the FD plots show the number of sample areas for which the AC had an observed peak at that position. The solid vertical lines in Figs. 4 and 5 show the expected positions of peaks in the FD array if the fiber lattice is approximately tetragonal of side given by the fundamental maxima around d = 19.5 nm in the average profile. It can be seen that the lines fit many of the observed peaks well. The lines labeled F1–F3 are orders of the same single interplanar d spacing of the tetragonal lattice. The other continuous lines are the expected SQ1-1, SQ2-1, and SQ2-2 lines from the tetragonal lattice or, for those peaks at <19.5 nm, the expected peaks at subdivisions of the dominant lattice spacings. The analysis is similar for a hexagonal lattice, but here the lines are shown with the prefix Hex. A 19.5-nm fundamental maximum in the autocorrelation of a hexagonal lattice would mean that the lattice spacing (from fiber center to fiber center) is 22.5 nm (b = d/cos30 = 19.5/cos30). Since F1–F3 are common to both lattices, it is the peaks other than these three peaks that would distinguish between these two different lattice types. There are three orders of the fundamental spacing visible (F1–F3), which indicates quite long-range regularity. From these data, it is difficult to detect further orders at larger distances because of the limited size of the chosen areas, which were, for example, between fenestrations or near undulations in the membrane. In summary, there appear to be both hexagonal and tetragonal elements in the data, with the tetragonal lattice predominant.
With the data from above fenestrations (Fig. 5), it is immediately obvious that in general the FD profiles show a less well ordered fiber arrangement than those in Fig. 4. The FD plots also extend only to relatively short spacings (they peter out after ∼60 nm) because of the limited size of the fenestrations. In two cases (the fundus and jejunum), some wider areas were used that included two neighboring fenestrations, and in those areas, the FDs extend to larger distances. Despite their relatively poor order, these plots do also show peaks similar to those in Fig. 4. The mean value fits to an underlying tetragonal lattice, though evidence of hexagonal ordering is also present.
Aorta, pancreas, and diaphragm
As previously mentioned, the number of available images from aorta capillaries, exocrine pancreatic capillaries, and diaphragm capillaries was too small to give meaningful individual FD profiles. However, the pooled data from these three tissues, giving ACs from a total of 17 areas, and the FD plot (not shown) was very similar to those described above for the glycocalyx in other tissues.
Long-range correlation
To find evidence of long-range spacings common to glycocalyces of all types of vessel, all the data were pooled and the FD (Fig. 6) was calculated. Attention was not paid to the occurrence of fenestrations, vesicles, or intercellular clefts. To ensure that the membrane was always parallel to the selected area, many of the chosen image areas were <300 nm in length. This meant that the FD tails off with distance, and to minimize this, it was normalized to the actual number of areas contributing to the peak at that spacing. The noise therefore increased as the spacing increased. All the micrograph areas were randomly divided into one of six groups for analysis so that a standard error could be estimated. Due to smoothing of the profile, the details have been blurred at shorter spacings. FD maxima around 10 nm and 20 nm, though broader, agree with the individual tissue data. In Fig. 6, there are some sharp maxima at 52 nm, 128 nm, 160 nm, 196 nm, and 240 nm. There are also some broader maxima at 80–120 nm, 140–155 nm, and 178–188 nm. The mean error rises with distance, so any spacing higher than 250 nm was deemed too noisy to analyze. These values do not conform easily to a regular hexagonal or tetragonal lattice, so to define a lattice is not trivial. A slight distortion of a basic lattice would give a large number of maxima. It is likely that these long-range spacings (>120 nm) are mainly due to another phenomenon, such as a regular separation between tufts, rather than just being an extension of the 19.5-nm fiber lattice.
Figure 6.
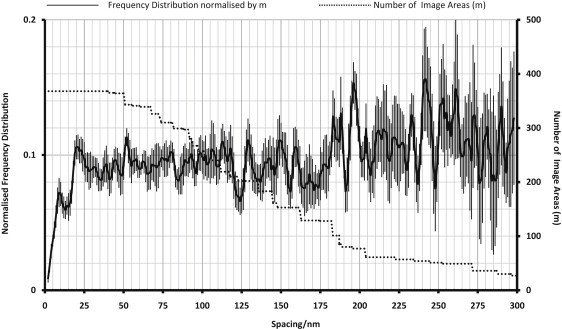
Normalized FD plot of fiber spacings up to 300 nm in glycocalyces from all image areas, irrespective of tissue origin (solid line), with the number of image areas (m; right hand y axis) at each spacing (dotted line).
Fiber size
As discussed in the Methods section, model studies (Fig. 2) have shown that the size of the objects on a tetragonal or hexagonal lattice can be estimated from the FWHM of the peaks in the AC profiles. The ACs observed are projections through the lattice, and therefore, the maximum of the FWHM FD is not the fiber diameter; the holes (which would not correctly fit to the Gaussian assumed) in the lattice are also being convoluted in the measurement. The mean FWHM from the FD appears to give a linear correlation to fiber diameter (Fig. 2). Our data give a mean FWHM of 18.8 (± 0.2 SE) nm for this staining technique. Simple line measurements taken directly from the original micrographs agree with this (data not shown).
Discussion
General
The endothelial glycocalyces lining the rat and rabbit microvessels examined in this study have been found to have a periodic structure with similar predominant spacings parallel to the cell surface. Furthermore, the predominant spacings were present in both continuous (nonfenestrated) and fenestrated endothelia. The nonfenestrated glycocalyx areas gave dominant spacings (± SD) of 19.5 (± 0.6) nm and 27.5 (± 1.3) nm (Table 1), whereas the fenestrated areas, with slightly more disorder, gave spacings of 19.6 (± 2.1) nm and 27.0 (± 1.0) nm. These values are almost identical to those of 19.6 (± 3.0) nm and 31.8 (± 4.0) nm reported by Squire et al. (12) for specimens of glycocalyx of nonfenestrated frog mesenteric vessels that had been both prepared and stained by a range of different techniques.
The findings fulfill the two principal aims of this investigation. First, the endothelial glycocalyx of rat and rabbit microvessels in different tissues has the same quasiperiodic structure as that reported for frog microvessels by Squire et al. (12). It is worth noting that there was no noticeable difference between rat and rabbit tissues (comparison data not shown) and observed variations between the species were similar to or less than variations between sections taken from the same animal. This strengthens the case for believing that the structure of the frog endothelial glycocalyx is a good model for the endothelial glycocalyces of mammals. Second, the spacing of the glycocalyx overlying fenestrated endothelia appears to be identical to that in nonfenestrated endothelia, strengthening the argument that constant structural features of the glycocalyx determine its function as a molecular sieve and account for the similar ultrafiltration properties of fenestrated and nonfenestrated microvessels.
The 100-nm spacing reported in the 2-D analysis of Squire et al. (12) in frog glycocalyx, however, was not observed unambiguously using our 1-D analysis method on the glycocalyces of mammalian vessels. Spacings >100 nm were regularly seen, but their exact position was tissue-dependent and hard to interpret in the present 1-D analysis. All of the glycocalyx image areas that were large enough in extent (>300 nm) showed spacings of 128, 160, 196, and 240 nm in addition to the short-range fiber spacings in the range 0–100 nm. We suggest that these represent a sum of fundamental intertuft spacings that are possibly due to membrane binding to an underlying cytoskeleton, as proposed by Squire et al. (12), and also to some extension of the short-range ordering within tufts continuing across to their neighbors. Further analysis in 2-D will be needed to clarify these issues.
Finally, from a modeling study, we have been able to devise an objective method that allows us to determine the diameter of the constituent fibers of glycocalyx. Here, the best estimate from the observed autocorrelation functions was 18.8 (± 0.2) nm, remembering that this value includes the effects of the stain (see below).
We note here that to try to understand the possible filtering properties of the glycocalyx, we need to have estimates of three main factors. The first is the center-to-center fiber spacing (b). The second is the nature of any lattice organization that the fibers display (i.e., whether it is tetragonal or hexagonal or somewhere between). The third is the fiber diameter. As in Squire et al. (12), with these factors known, we can estimate the relative likelihood that macromolecules of different size will penetrate the glycocalyx. Before discussing these issues further, we first consider the method of analysis that we have used here and the limitations of its application in this study.
Factors affecting the analysis and interpretation of the observations
Autocorrelation
AC is often deemed the lesser brother to a straightforward Fourier transform. What this article has demonstrated could in principle be achieved with a Fourier transform protocol. There are, though, some important advantages in the practical application of AC. The main advantage is that AC is very visual; the output image is in real space instead of reciprocal space. When dealing with the noise and background from physiological micrographs of tissues that in any case are not highly regular, especially without preprocessing, this becomes advantageous, particularly when designing an automated protocol.
Our analysis assumes that the glycocalyx has been randomly orientated in the sections that we have examined. Since our values for each vessel type are based on a minimum of 28 images, this seemed reasonable. Although it is impossible to eliminate subjective influence on the choice of sections, (e.g., unconsciously selecting more images with an apparently structured glycocalyx), we believe the restraints imposed by the dimensions and density of the glycocalyx images kept subjective bias to a minimum. All the chosen areas from the micrographs had a well-defined underlying endothelial cell membrane. Any slight variation in angle should not change the FD maxima values in the direction parallel to the membrane.
Estimate of fiber separation and lattice ordering
It is important to recognize that our analysis indicates the structure of the glycocalyx after its fixation by glutaraldehyde, dehydration, and staining with uranyl acetate, and particularly to note that tannic acid was used before staining. The consistently observed periodic arrangement of the large fibrous molecules that has emerged as a general structural feature of the glycocalyx, in both this study of mammalian vessels and the Squire et al. investigation of frog microvessels (12), is therefore expected to represent the physiological state, since it has been observed in specimens that have undergone a variety of different preparation and staining methods, both for electron microscopy and tissue prepared by the rapid-freeze-deep-etch technique, which does not involve fixation or staining of the tissue (12). We conclude that a dominant d spacing of ∼19–20 nm between fibers is a common feature of all these glycocalyces, and that there is a quasiregular lattice that is mostly tetragonal.
Estimate of the fiber diameter
The fiber diameter of 18.8 nm deduced here from the FWHM values of peaks in the ACs (Fig. 2 D) is significantly different from the value of 12 nm estimated by Squire et al. (12). Microfilament diameters have been reported to increase in relation to the concentration of tannic acid in the fixative (22), probably due to the tannic acid hydrogen-bonding to biomolecules and to successive tannic-acid layers.
Fujikawa et al. (23) found that eliminating tannic acid from fixatives with osmium or glutaraldehyde or both caused a marked (28%) decrease in diameter of the fibrillar components of the erythrocyte membrane skeleton (10.3 ± 0.1 nm down to 7.4 ± 0.2 nm). Particles were similarly changed by 29% (13 ± 0.1 nm down to 9.2 ± 0.1 nm). Intramembranous particles did not decrease in size, and the exoplasmic surfaces remained smooth, showing that this tannic-acid effect may not extend to the roots of the glycocalyx fibers in the cell membrane. If the tannic-acid-treated glycocalyx studied here shows the same reduction in diameter (28.5%), the 18.8 nm is reduced to 13.4 nm, close to the 12–13 nm quoted by Squire et al.
Horiuchi, avoiding tannic-acid staining, looked at the glycocalyx associated with intestinal microvilli, reporting glutaraldehyde- and osmium-fixed fibers 7–15 nm thick by scanning EM (gold 1–1.5 nm thick) (24). The online supplement to a study by van den Berg et al. (25) shows fibers of 3.4 ± 0.1 nm (range 2–9 nm in width) after fixation with Alcian blue/glutaraldehyde/lanthanum/osmium. Other methods, for example in quick-freeze deep-etched samples of frog bladder epithelial glycocalyx, show a mean of 6.3 ± 0.2 (range 3–13 nm in width) (26). Quick freeze followed by osmium-freeze substitution of bovine aortic endothelial cells showed fibers that averaged 18.7 ± 1 nm (measured from Ebong et al. Fig. 1 D) (27).
At present, the published fiber diameters are in the range 3–18 nm. This is due either to natural or artifactual aggregation of thin fibers (e.g., 12 nm is four 3-nm fibers) or to apparent fiber widening due to tannic acid treatment.
The thickness of the glycocalyx
Most EM images of the glycocalyx reveal a layer of noncellular material thinner than that deduced from in vivo studies based on direct observation (e.g., Vink and Duling (4)) and near wall particle image velocimetry (28). The glycocalyx thickness (height) in images used in this study varied between 0.05 and 0.15 μm, whereas the exclusion zone for large fluorescent macromolecules from luminal endothelial cell membrane is estimated to be between 0.3 and >1.0 μm in larger vessels. Weinbaum et al. (29) suggest that the glycocalyx is organized in two layers, the inner region being that seen in EM, with an outer layer of up to 0.5 μm thick, which, it is suggested, contains the extended core proteins. They propose that the outer layers are cleaved from the inner region during fixation of tissues in preparation for EM. This explanation does not account for the substantial similarity, reported by Squire et al. (12), between glycocalyx structures fixed by rapid freezing and those prepared by chemical fixation. Furthermore, it is important to note that a decrease in the molecular sieving properties of the glycocalyx does not necessarily accompany a reduction in its thickness if its porosity is unchanged. However, an increase in the absolute values of its hydraulic conductivity and solute permeability coefficients would be expected to follow a decrease in glycocalyx thickness. In this context, Gao and Lipowsky (11) recently described a reduction of the diffusion coefficient of fluorescein isothiocyanate in rat mesenteric venules in the outer region of the glycocalyx after a reduction of glycocalyx thickness induced by heparinase. The authors consider the possibility that removal of the heparin sulfate from the outer zone may lead to collapse and compression, with a reduction in porosity of this outer glycocalyx. Whatever proves to be the explanation of this phenomenon, the structure of the inner layers of glycocalyx seen in TEM to be in contact with the luminal endothelial surface is likely to determine its molecular sieving properties.
A model for the glycocalyx and estimates of its filtering properties
Relating glycocalyx structure to its possible properties as a filter is important, because the glycocalyx is proposed to be the most selective ultrafilter of the endothelial barrier and so determines the ultrafiltration properties of vascular endothelia. The major pathways of fluid flow through fenestrated endothelia are the fenestrae, and those through continuous endothelia are the intercellular clefts, so according to the fiber-matrix hypothesis, it is the filtering properties of the glycocalyx over these sites that are most relevant. For filtering properties to be the same, we would expect to find glycocalyces of similar structure. Here, we have been able to examine the glycocalyx overlying fenestrae, but we have had insufficient material to detect quantitative differences in structure between glycocalyces overlying the intercellular clefts of continuous endothelia and those over surrounding areas of the cell surface. Inspection suggests that if differences are present, they are small. In a similar way, inspection of micrographs does not suggest that the glycocalyx over the entrances to caveolae differs from that over the surrounding luminal surface. It should be noted that observations that ferritin molecules are excluded from caveolae provided the first evidence that the glycocalyx was a barrier to macromolecules (30) and led to the fiber-matrix model of vascular permeability (10).
Following the structural model of the glycocalyx proposed by Squire et al. (12), Zhang et al. (16) developed a sophisticated hydrodynamic model for ultrafiltration and osmotic flow through a hexagonal array of cylindrical fibers. The latter model requires modification to describe different fiber arrays and here we propose a simple model based on the observations reported in this article.
Fig. 7 A summarizes our findings and serves as a starting point for trying to model the molecular sieving properties of the glycocalyx studied. Essentially, when viewed from the lumen looking toward the endothelial cell membrane, the glycocalyx is seen as a mainly square lattice of fibers where the center-to-center fiber separation, b, is ∼19–20 nm and the fiber radius, r, is ∼6–7 nm. Note that the unit cell can be shown as a square (Fig. 7 A, dashed lines) with the corners centered on adjacent fibers. Each corner is filled with a quarter of a fiber, so each unit cell contains the volume of one cylindrical fiber from which water is excluded. When a macromolecule is present within the unit cell, its center is excluded from a larger cylindrical volume with a radius of r + a. With this kind of structure in mind, Squire et al. (12) used a simple calculation to estimate the relative chance that a spherical macromolecule of radius a would get through the glycocalyx lattice. In the Supporting Material for this article, the calculations for a square lattice and the corresponding hexagonal lattice are demonstrated. The results for a range of fiber radii are illustrated in Fig. 7 B for a 19.5-nm square lattice and the equivalent 22.5-nm hexagonal lattice. The results for a fiber radius of 6–7 nm give molecular cutoffs close to the observed values across microvascular walls (31).
Figure 7.
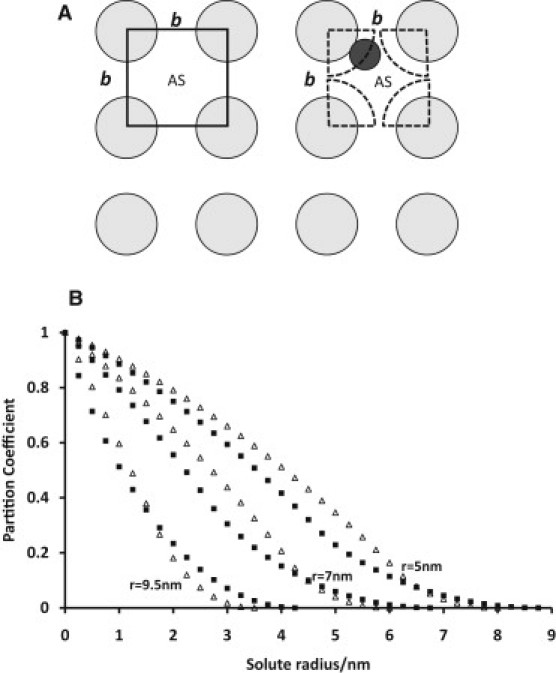
(A) Diagram of the conclusions from this study about the arrangement of the glycocalyx in a view looking toward the endothelial membrane from the lumen and showing the available space (AS) for water and for a macromolecule. (B) The partition coefficient between open solution and solution within the matrix for a tetragonal lattice with interfiber spacing b = 19.5 nm (squares) and for a hexagonal lattice with b = 22.5 nm (triangles), for fiber diameters of 5, 7, and 9.5 nm.
In summary, the results presented here show that the observed glycocalyx structure with spacing of 20 nm and its filtering mechanism could occur not just in frog endothelia but in all the mammalian microvessels that we have studied. We suggest that this might be a universal mechanism for macromolecular filtration in all microvascular glycocalyces.
Acknowledgments
This work was supported by British Heart Foundation PG/08/059/25335.
Footnotes
This manuscript has been prepared since the death of J. Rostgaard.
Supporting Material
References
- 1.Starling E.H. On the absorbtion of fluid from the connective tissue spaces. J. Physiol. 1896;19:312–326. doi: 10.1113/jphysiol.1896.sp000596. [DOI] [PMC free article] [PubMed] [Google Scholar]
- 2.Luft J.H. Fine structure of capillaries: the endocapillary layer. Anat. Record. 1965;151:380. [Google Scholar]
- 3.Levick J.R., Michel C.C. Microvascular fluid exchange and the revised Starling principle. Cardiovasc. Res. 2010;87:198–210. doi: 10.1093/cvr/cvq062. [DOI] [PubMed] [Google Scholar]
- 4.Vink H., Duling B.R. Identification of distinct luminal domains for macromolecules, erythrocytes, and leukocytes within mammalian capillaries. Circ. Res. 1996;79:581–589. doi: 10.1161/01.res.79.3.581. [DOI] [PubMed] [Google Scholar]
- 5.Clementi F., Palade G.E. Intestinal capillaries. I. Permeability to peroxidase and ferritin. J. Cell Biol. 1969;41:33–58. doi: 10.1083/jcb.41.1.33. [DOI] [PMC free article] [PubMed] [Google Scholar]
- 6.Karnovsky M.J. The ultrastructural basis of capillary permeability studied with peroxidase as a tracer. J. Cell Biol. 1967;35:213–236. doi: 10.1083/jcb.35.1.213. [DOI] [PMC free article] [PubMed] [Google Scholar]
- 7.Wissig S.L., Williams M.C. Permeability of muscle capillaries to microperoxidase. J. Cell Biol. 1978;76:341–359. doi: 10.1083/jcb.76.2.341. [DOI] [PMC free article] [PubMed] [Google Scholar]
- 8.Bundgaard M. The three-dimensional organization of tight junctions in a capillary endothelium revealed by serial-section electron microscopy. J. Ultrastruct. Res. 1984;88:1–17. doi: 10.1016/s0022-5320(84)90177-1. [DOI] [PubMed] [Google Scholar]
- 9.Adamson R.H., Michel C.C. Pathways through the intercellular clefts of frog mesenteric capillaries. J. Physiol. 1993;466:303–327. [PMC free article] [PubMed] [Google Scholar]
- 10.Curry F.E., Michel C.C. A fiber matrix model of capillary permeability. Microvasc. Res. 1980;20:96–99. doi: 10.1016/0026-2862(80)90024-2. [DOI] [PubMed] [Google Scholar]
- 11.Gao L.J., Lipowsky H.H. Composition of the endothelial glycocalyx and its relation to its thickness and diffusion of small solutes. Microvasc. Res. 2010;80:394–401. doi: 10.1016/j.mvr.2010.06.005. [DOI] [PMC free article] [PubMed] [Google Scholar]
- 12.Squire J.M., Chew M., Michel C. Quasi-periodic substructure in the microvessel endothelial glycocalyx: a possible explanation for molecular filtering? J. Struct. Biol. 2001;136:239–255. doi: 10.1006/jsbi.2002.4441. [DOI] [PubMed] [Google Scholar]
- 13.Michel C.C. The effects of certain proteins on capillary permeability to fluid and macromolecules. In: Lambert P.P., Bergmann P., Beauwens R., editors. The Pathogenicity of Cationic Proteins. Raven Press; Lake Oswego, OR: 1983. pp. 125–140. [Google Scholar]
- 14.Weinbaum S., Zhang X.B., Cowin S.C. Mechanotransduction and flow across the endothelial glycocalyx. Proc. Natl. Acad. Sci. USA. 2003;100:7988–7995. doi: 10.1073/pnas.1332808100. [DOI] [PMC free article] [PubMed] [Google Scholar]
- 15.Adamson R.H., Lenz J.F., Curry F.E. Oncotic pressures opposing filtration across non-fenestrated rat microvessels. J. Physiol. 2004;557:889–907. doi: 10.1113/jphysiol.2003.058255. [DOI] [PMC free article] [PubMed] [Google Scholar]
- 16.Zhang X.B., Curry F.R., Weinbaum S. Mechanism of osmotic flow in a periodic fiber array. Am. J. Physiol. Heart Circ. Physiol. 2006;290:H844–H852. doi: 10.1152/ajpheart.00695.2005. [DOI] [PubMed] [Google Scholar]
- 17.Rostgaard J., Qvortrup K., Poulsen S.S. Improvements in the technique of vascular perfusion-fixation employing a fluorocarbon-containing perfusate and a peristaltic pump controlled by pressure feedback. J. Microsc. 1993;172:137–151. doi: 10.1111/j.1365-2818.1993.tb03405.x. [DOI] [PubMed] [Google Scholar]
- 18.Rostgaard, J., and K. Qvortrup. 1994. Electron microscopic demonstrations of filamentous molecular sieve plugs in capillary fenestrae. In XV European Section Meeting on Heart Diseases at the Meeting of the International Society for Heart Research, Copenhagen, Denmark. 1–13. [DOI] [PubMed]
- 19.Rostgaard J., Qvortrup K. Electron microscopic demonstrations of filamentous molecular sieve plugs in capillary fenestrae. Microvasc. Res. 1997;53:1–13. doi: 10.1006/mvre.1996.1987. [DOI] [PubMed] [Google Scholar]
- 20.Rostgaard J., Qvortrup K. Sieve plugs in fenestrae of glomerular capillaries—site of the filtration barrier? Cells Tissues Organs (Print) 2002;170:132–138. doi: 10.1159/000046186. [DOI] [PubMed] [Google Scholar]
- 21.Rasband, W. S. 1997–2009. ImageJ. U. S. National Institutes of Health, Bethesda, MD.
- 22.Hayat M.A. Academic Press; New York: 1981. Fixation for Electron Microscopy. [Google Scholar]
- 23.Fujikawa S. Tannic acid improves the visualization of the human erythrocyte membrane skeleton by freeze-etching. J. Ultrastruct. Res. 1983;84:289–298. doi: 10.1016/s0022-5320(83)80008-2. [DOI] [PubMed] [Google Scholar]
- 24.Horiuchi K., Naito I., Ohtsuka A. Three-dimensional ultrastructure of the brush border glycocalyx in the mouse small intestine: a high resolution scanning electron microscopic study. Arch. Histol. Cytol. 2005;68:51–56. doi: 10.1679/aohc.68.51. [DOI] [PubMed] [Google Scholar]
- 25.van den Berg B.M., Vink H., Spaan J.A.E. The endothelial glycocalyx protects against myocardial edema. Circ. Res. 2003;92:592–594. doi: 10.1161/01.RES.0000065917.53950.75. [DOI] [PubMed] [Google Scholar]
- 26.Kachar B., Liang F.X., Sun T.T. Three-dimensional analysis of the 16 nm urothelial plaque particle: luminal surface exposure, preferential head-to-head interaction, and hinge formation. J. Mol. Biol. 1999;285:595–608. doi: 10.1006/jmbi.1998.2304. [DOI] [PubMed] [Google Scholar]
- 27.Ebong E.E., Macaluso F.P., Tarbell J.M. Imaging the endothelial glycocalyx in vitro by rapid freezing/freeze substitution transmission electron microscopy. Arterioscler. Thromb. Vasc. Biol. 2011;31:1908–1915. doi: 10.1161/ATVBAHA.111.225268. [DOI] [PMC free article] [PubMed] [Google Scholar]
- 28.Smith M.L., Long D.S., Ley K. Near-wall micro-PIV reveals a hydrodynamically relevant endothelial surface layer in venules in vivo. Biophys. J. 2003;85:637–645. doi: 10.1016/s0006-3495(03)74507-x. [DOI] [PMC free article] [PubMed] [Google Scholar]
- 29.Weinbaum S., Tarbell J.M., Damiano E.R. The structure and function of the endothelial glycocalyx layer. Annu. Rev. Biomed. Eng. 2007;9:121–167. doi: 10.1146/annurev.bioeng.9.060906.151959. [DOI] [PubMed] [Google Scholar]
- 30.Loudon M.F., Michel C.C., White I.F. The labelling of vesicles in frog endothelial cells with ferritin. J. Physiol. 1979;296:97–112. doi: 10.1113/jphysiol.1979.sp012993. [DOI] [PMC free article] [PubMed] [Google Scholar]
- 31.Michel C.C., Curry F.E. Microvascular permeability. Physiol. Rev. 1999;79:703–761. doi: 10.1152/physrev.1999.79.3.703. [DOI] [PubMed] [Google Scholar]
Associated Data
This section collects any data citations, data availability statements, or supplementary materials included in this article.