Abstract
Background
The aim of this study was to determine the cost-effectiveness of tPA treatment in the 3 to 4.5 hour time-window after ischemic stroke.
Methods
Decision-analytic and Markov state-transition models were created to determine the cost-effectiveness of treatment of ischemic stroke patients with intravenous tPA administered in the 3 to 4.5 hour time-window compared with medical therapy without tPA. Health benefits were measured in quality-adjusted life-years (QALYs). The economic outcome measure of the model was the difference in estimated healthcare costs between the two treatment alternatives. The incremental cost-effectiveness ratio (ICER) was calculated by dividing the cost difference by the difference in QALYs. One-way sensitivity and probabilistic analyses were performed to test the robustness of the model.
Results
The administration of tPA over standard medical therapy resulted in a lifetime gain of 0.28 QALYs for an additional cost of $6,050, yielding an ICER of $21,978 per QALY. One-way sensitivity analyses demonstrated that the ICER was most sensitive to the cost of hospitalization for patients who received tPA. Based on probabilistic analysis there is 88% probability that tPA is the preferred treatment at a willingness to pay threshold of $50,000 per QALY.
Conclusion
The balance of costs and benefits favors treatment with intravenous tPA in the 3 to 4.5 hour time-window. This supports, from a societal perspective, the use of tPA therapy in this treatment time-window for acute ischemic stroke.
Keywords: Stroke, tissue plasminogen activator, cost-effectiveness, quality-adjusted life-year
INTRODUCTION
Stroke is one of the most costly health problems affecting Americans and a leading cause of serious, long-term disability in the United States.1 Multiple analyses have shown that treatment with tPA is cost-effective when administered within the first 3 hours after symptom onset.2 It is estimated that tPA treatment within 3 hours of symptom onset adds 0.75 QALYs and saves $6000 per patient treated.3 These data, however, do not apply to treatment with tPA in the 3–4.5 hour window, because the effect of tPA decreases with longer symptom onset-to-treatment times. The goal of this study was to determine the cost-effectiveness of tPA in this later treatment time-window.
METHODS
Model Overview
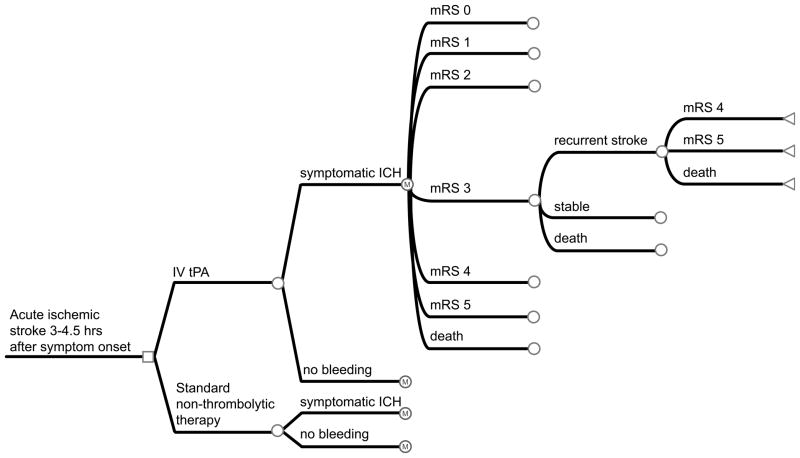
A decision-analytic model was created (TreeAge Software, Inc) to determine the cost-effectiveness of treatment of ischemic stroke patients with intravenous tPA administered in the 3 to 4.5 hour time window compared to treatment without tPA. We developed a Markov state-transition model, to account for the possible health states an individual may enter after presenting with acute ischemic stroke (Figure 1). In the analysis, we estimated average health-care costs and benefits of each alterative from the time of stroke until death.
Figure 1. Decision-analytic tree and Markov state-transition model.
A patient enters the model when they are admitted to the hospital and receive either tPA or non-thrombolytic therapy within 3 to 4.5 hours after the onset of stroke symptoms. After the initial stroke, the patient may remain in the same health state, have a recurrent stroke and transition to a lower health state, or die. Death can occur at any point in the process. Square nodes represent decision nodes. Circle nodes represent chance nodes with Markov nodes where indicated. Triangular nodes represent terminal nodes with corresponding transition states.
Input Parameters
Model input parameters were drawn from published literature. (Table 1). The base case is a man who is 65 years old at the time of his index stroke. This is the mean age of the patients who were enrolled in the ECASS-3 stroke trial.4 The death rates and the distribution of functional outcomes of patients treated with tPA and of patients treated without tPA were also based on results from this trial. Quality of life estimates for stroke survivors were based on published utility values stratified by modified Rankin category.9
Table 1.
Probabilities, utilities, and costs used in the model, and the range of values tested in the one-way and probabilistic sensitivity analyses.
| Model Input | Placebo | IV Alteplase (range) | Reference |
|---|---|---|---|
| Probability of | |||
| sICH | 0.002 | 0.024 | ECASS-34 |
| mRS 0 | 0.218 | 0.275 | ECASS-34 |
| mRS 1 | 0.233 | 0.249 | |
| mRS 2 | 0.164 | 0.141 | |
| mRS 3 | 0.114 | 0.093 | |
| mRS 4 | 0.137 | 0.093 | |
| mRS 5 | 0.052 | 0.081 | |
| mRS 6 | 0.082 | 0.067 | |
| Cost (2010 U.S. Dollars) | |||
| Total cost of hospitalization for acute stroke | 8,990 (7,192–10,788) | 18,407 (14,726–22,088) | Young et al.5 |
| Additional cost of sICH in patients with mRS 0–3 | 1,069 (855–1,283) | 1,069 (855–1,283) | Reed et al.6 |
| Additional cost of sICH in patients with mRS 4–5 or 6 | 2,521 (2,017–3,025) | 2,521 (2,017–3,025) | |
| Annual post-hospitalization cost mRS 0–3 | 5,271 (4,217–6,325) | 5,271 (4,217–6,325) | Earnshaw et al.7 |
| Annual post-hospitalization cost mRS 4–5 | 13,502 (10,802–16,202) | 13,502 (10,802–16,202) | |
| Recurrent stroke hospitalization | 18,824 (±20%) | Chambers et al.8 | |
|
| |||
| Utility (QALY) | Range | ||
| mRS 0 | 0.80 | 0.80–1.00 | Samsa et al.9 |
| mRS 1 | 0.80 | 0.80–0.95 | |
| mRS 2 | 0.65 | 0.68–0.90 | |
| mRS 3 | 0.50 | 0.45–0.65 | |
| mRS 4 | 0.35 | 0.10–0.40 | |
| mRS 5 | 0.20 | 0.00–0.32 | |
| mRS 6 (death) | 0.00 | 0.00–0.00 | |
| Death Hazard ratios | |||
| mRS 0 | 1 | 1.0–1.2 | Samsa et al.9 |
| mRS 1 | 1 | 1.0–1.2 | |
| mRS 2 | 1.11 | 1.0–1.2 | |
| mRS 3 | 1.27 | 1.2–1.4 | |
| mRS 4 | 1.71 | 1.3–2.0 | |
| mRS 5 | 2.37 | 1.5–4.0 | |
| Probability of | |||
| Recurrent stroke | 0.051 | 0.02–0.065 | Fagan et al.2 |
| Death with recurrent stroke | 0.19 | 0.1–0.3 | |
| Discount rates | |||
| Costs | 0.03 | ±20% | Earnshaw et al.7 |
| Outcomes | 0.03 | ±20% | |
sICH indicates symptomatic intracerebral hemorrhage; mRS, Modified Rankin Scale; QALY, quality adjusted life years; ICH, intracerebral hemorrhage. All costs were converted to 2010 dollars using the medical care component of the Consumer Price Index.
All costs reflect published estimates inflated to 2010 dollars using the medical care component of the Consumer Price Index. Hospitalization costs for the index event were based on nationwide U.S. estimates of Medicare costs.10 The additional cost incurred by patients with sICH was estimated based on the difference in cost per hospital day for ICH patients compared to ischemic stroke patients, and multiplied by the average length of stay for ischemic stroke patients.6 This additional cost was applied to the base hospitalization cost for the proportion of patients who experienced a sICH. Annual post-hospitalization costs were determined from lifetime costs for patients with minor and major stroke.7 Death (by stroke or other causes) is the only absorbing state after which the patient is excluded from the model. No further costs or benefits incurred by the absorbing state are included in the analysis. Subsequent hospital costs for recurrent stroke were obtained from an economic study that assessed these costs at 5 major academic centers.8 All costs and utilities were discounted by 3% per year, which has been suggested as the optimal discount rate for cost-effectiveness analyses.11
Health States
In the model, patients could undergo transitions between 7 post-stroke disability states based on the modified Rankin disability scale: no symptoms (mRS score 0), no significant disability (mRS score 1), minimal disability (mRS score 2), moderate disability (mRS score 3), moderate to severe disability (mRS score 4), severe disability (mRS score 5), and death (mRS score 6). The model cycle length was 1 year with a time horizon of 30 years. At the end of each annual cycle, patients could remain in their current health state, transition to a lower health state due to recurrent stroke, or die due to a recurrent stroke or an age-related cause (see Figure 1).
Patients with stroke were assumed to have an all-cause mortality rate higher than that of the average population.2 Life tables for stroke patients were generated by adjusting life tables from the United States National Vital Statistics Reports according to mRS score specific death hazard ratios, referring to death from causes other than stroke.9, 12
Patients with recurrent stroke were assumed to have a mortality of 0.19.2 Patients remaining alive after recurrent stroke events were reallocated equally among Rankin categories of greater disability. For example, patients in Rankin category 2 who had a recurrent stroke and lived were allocated equally among Rankin 3, 4, and 5 categories.
Outcome Assessment
Health outcomes were measured in quality-adjusted life-years (QALYs), which captured the effects of treatment on rates of morbidity and mortality. The economic outcome measure of the model was the difference in estimated health care costs between the two treatment alternatives. The economic costs included the cost of hospitalization for acute ischemic stroke, the cost of symptomatic intracranial hemorrhage (sICH), and the cost of post-hospitalization long-term care (such as inpatient and outpatient rehabilitation and ambulatory care costs) associated with each health state.
The difference in the costs and benefits between treatment with tPA and treatment without tPA were assessed. The incremental cost-effectiveness ratio (ICER) was calculated by dividing the cost difference by the difference in QALYs. The intervention was considered cost-effective if the ICER was less than $50,000 per QALY gained, and borderline cost-effective if the ICER was between $50,000 and $100,000 per QALY gained. Cost per death prevented at 90 days post-stroke was also calculated. The analysis was conducted from the societal perspective. Indirect economic costs such as work loss were not included.
Sensitivity Analysis
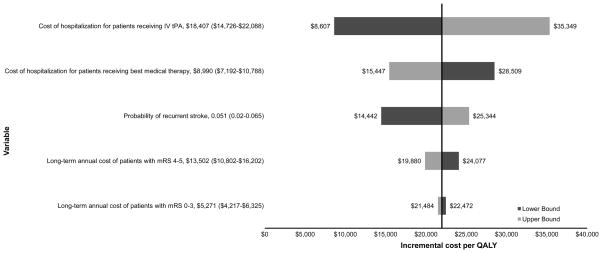
Deterministic one-way sensitivity analyses were performed to test the robustness of the model. Parameters varied and analyzed included hospitalization costs for each treatment, annual post-hospitalization costs, recurrent stroke cost, sICH costs, probability and mortality of recurrent stroke, utilities, hazard ratios, and discount rates (Figure 2). Plausible ranges were obtained from the literature or by varying estimates up to 20% in each direction (see Table 1).
Figure 2. One-way sensitivity analyses: effect of parameter variation on the ICER.
All model parameters were varied and those with the highest relative effect on ICER are displayed. Dark-shaded bars represent the lower bound of variable range. Light-shaded bars represent the upper bound. The first number listed after the variable name is the base case value. Numbers listed in parentheses indicate the range over which the value was varied in the sensitivity analysis. Baseline incremental cost per QALY is ~$22,000. IV tPA indicates intravenous tissue plasminogen activator; mRS, modified Rankin Scale; QALY, quality-adjusted life-year.
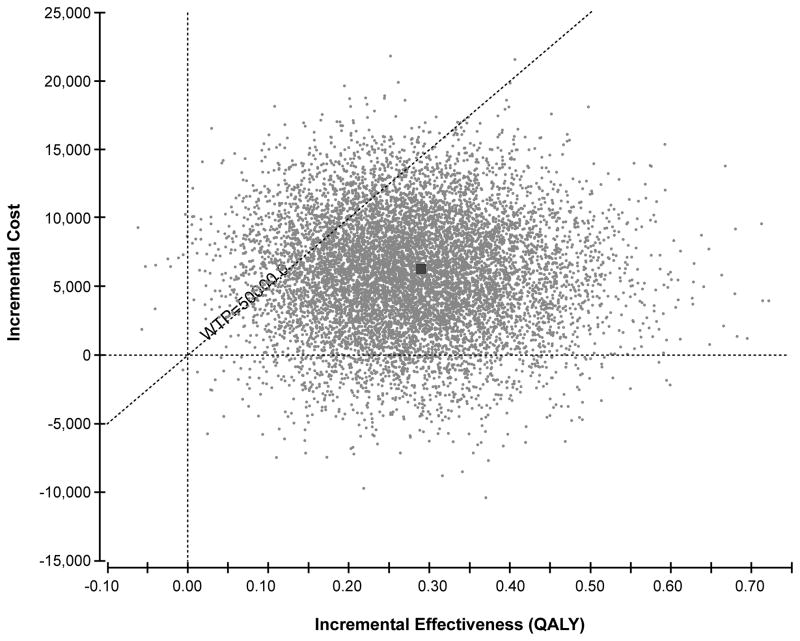
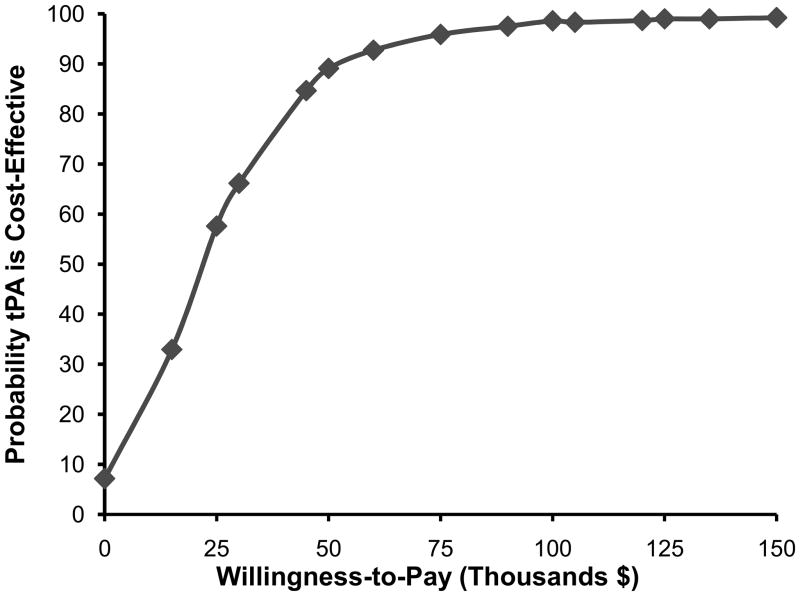
Since parameters are unlikely to change in isolation, all parameters were also varied simultaneously in a probabilistic sensitivity analysis (Monte-Carlo simulation). Costs were varied assuming a normal distribution. Probabilities were varied assuming a beta distribution. Utilities were varied using a gamma distribution. The analysis was run 10,000 times to capture stability in the results. Uncertainty was represented on a scatter plot (Figure 3). Probabilities that tPA therapy is cost-effective were determined at a wide range of willingness to pay (WTP) thresholds (Figure 4).
Figure 3. Results of probabilistic sensitivity analysis: incremental cost-effectiveness scatter plot.
Incremental effectiveness is measured in QALYs. The dotted diagonal line represents the willingness to pay threshold of $50,000 per QALY. All points to the right of the willingness to pay line are considered cost-effective. Each point represents a simulation run. The dark square represents the base case result (0.28 QALYs gained at an incremental cost of $6,050).
Figure 4. Cost-effectiveness Acceptability Curve.
The curve presents the probability that tPA is cost-effective as a function of WTP threshold. tPA indicates tissue plasminogen activator.
RESULTS
Base Case Analysis
For the base case scenario, medical therapy without tPA was associated with 6.08 residual post-stroke QALYs at a cost of $95,603. Treatment with intravenous tPA in the 3 to 4.5 hour time-window was associated with 6.35 QALYs at a cost of $101,653. Therefore, the administration of tPA resulted in a lifetime gain of 0.28 QALYs at an additional cost of $6,050, yielding an ICER of $21,978 per QALY. At 90 days post-stroke, the additional cost associated with tPA treatment to prevent 1 death was $629,073.
Sensitivity Analysis
One-way sensitivity analyses indicated that the study results were robust. The effects of varying input parameters on the ICER are illustrated in the tornado diagram in Figure 2. Changes in parameters led to small changes in the ICER that were well within the limits of cost-effectiveness for all parameters tested. The ICER was most sensitive to the cost of hospitalization for patients who received tPA. At the upper bound of the hospitalization cost for patients who received tPA ($22,088), the ICER increased to a maximum of $35,349 per QALY. The ICER was relatively insensitive to varying parameters of recurrent stroke cost, sICH costs, probability of recurrent stroke, probability of death from recurrent stroke, utilities, hazard ratios, and discount rates.
Results of the probabilistic sensitivity analysis are shown in Figure 3. In 7.7% of simulation runs, tPA was less costly and more effective than standard medical therapy and was recommended. In 80.7% of simulation runs, tPA was more costly and more effective than standard medical therapy, and was recommended because the ICER did not exceed the WTP threshold of $50,000 per QALY. In 11.6% of simulation runs, tPA was more costly and more effective and was not recommended because the ICER exceeded $50,000 per QALY. Overall, there was 88% probability that tPA was the preferred treatment at a willingness to pay threshold of $50,000 and 98.2% probability at a willingness to pay threshold of $100,000. A cost-effectiveness acceptability curve shows the probability of cost-effectiveness of tPA as a function of the willingness-to-pay threshold (Figure 4).
DISCUSSION
Our results indicate that intravenous tPA administered for acute stroke within the 3 to 4.5 hour time window is associated with better outcomes and higher costs. The incremental cost-effectiveness of intravenous tPA given within 3 to 4.5 hours, compared to treatment without tPA, is $22,000 per QALY gained.
The robustness of our study results are supported by the probabilistic sensitivity analysis. At the commonly used willingness to pay threshold of $50,000 per QALY, there was more than 85% probability that tPA is the preferred treatment option. Although $50,000 per QALY is a commonly used threshold, it is not a universally accepted norm and some experts have recommended against using any kind of preset threshold.13 We have therefore presented a full range of thresholds in a cost-effectiveness acceptability curve (Figure 4) This curve shows that tPA treatment remains the preferred option with at least 50% probability at willingness-to-pay thresholds down to $25,000 per QALY.
Multiple prior studies support the cost-effectiveness of treating acute stroke patients with tPA within 3 hours of symptom onset. An early study based on the NINDS Stroke Trial results showed that intravenous tPA therapy reduced health expenditures by $8,000 per QALY (1996 US dollars).2 A subsequent study based on a meta-analysis of 6 trials (NINDS parts 1 and 2, ATLANTIS A and B, and ECASS -1 and -2) also found that tPA was economically dominant within the 3 hour time-window. In this study tPA therapy was associated with a gain of 0.43 QALYs and $16,000 in cost savings compared to standard treatment.14 In contrast, our study shows that, although cost-effective, tPA treatment in the 3 to 4.5 hour time-window leads to an increase in costs. This increase results from higher initial hospitalization costs that are only partially offset by a reduction in long-term care costs for patients treated with tPA.
The difference in cost-effectiveness between this study and prior studies is the result of two key factors. First, whereas prior studies assumed the initial hospitalization costs to be nearly equivalent between groups, we assumed higher hospitalization costs for patients treated with tPA.2 This is based on recent cost-analysis studies showing that in-hospital costs of acute ischemic stroke are higher for patients treated with tPA compared to patients not treated with tPA.15 This is also reflected in higher Medicare reimbursement for patients treated with tPA (MS-DRG 61–63 = $14,806, 2010 US dollars) compared to patients not treated with tPA (MS-DRG 64–66 = $8,968).10 Second, the benefit of tPA therapy was lower in our study compared to previous studies; where our study shows a gain of 0.28 QALYs, previous studies showed a gain of 0.43 to 0.75 QALYs over a lifetime.3 This difference reflects the reduced clinical benefit from tPA treatment when administered in the 3 to 4.5 hour time-window compared to earlier treatment.4
The ICER of $22,000 per QALY gained for treatment with tPA in the 3 to 4.5 hour time-window is comparable to that of most cancer treatments. For example, the median ICER is $29,900 for breast cancer, $24,300 for colorectal cancer, and $38,500 for prostate cancer treatments (2010 US dollars).16 The relatively small increase in QALYs (0.28 over lifetime) associated with tPA treatment is also comparable to cancer therapy. For example, radiation therapy following conservative surgery for breast cancer, compared to surgery alone, resulted in 0.09 QALYs gained and an ICER of $52,200 per QALY gained (2010 US dollars).17
Our study has some limitations. First, we used best-estimates from previously published data for our input parameters. By using high quality cost data from the literature and inflating the costs to 2010 dollars, we have attempted to closely approximate current actual costs. It is, however, possible that these best estimates over- or underestimate the true value of any of the model parameters. Studies that reassess current actual costs of tPA use, stroke hospitalization, and long-term care cost would provide valuable data for future cost-effectiveness studies of tPA and stroke but it is unlikely that the conclusions of our study would have changed based on data derived from such studies because our findings were robust against reasonable variations in all model inputs. Second, in the Markov model we captured future changes in health status as a result of recurrent stroke and all causes of death, but changes in functional status from causes other than stroke were not modeled. Although this is a limitation of the study, it is unlikely that tPA treatment has a significant differential effect on such changes. This limitation is therefore also unlikely to have affected the overall results of the study.
In conclusion, the balance of costs and benefits favors treatment with intravenous tPA in the 3 to 4.5 hour time-window over standard non-thrombolytic therapy. From a societal perspective this supports the use of tPA therapy in this time-window for patients with acute ischemic stroke.
Acknowledgments
Funding
This study was supported by the National Institutes of Health (NINDS, K23 NS051372).
Footnotes
Conflicts of Interest
None
Contributor Information
Christie E Tung, Stanford University.
Sandra S. Win, Stanford University.
Maarten G. Lansberg, Stanford University.
References
- 1.Demaerschalk BM, Hwang HM, Leung G. Cost analysis review of stroke centers, telestroke, and rt-pa. Am J Manag Care. 2010;16:537–544. [PubMed] [Google Scholar]
- 2.Fagan SC, Morgenstern LB, Petitta A, Ward RE, Tilley BC, Marler JR, et al. Cost-effectiveness of tissue plasminogen activator for acute ischemic stroke. Ninds rt-pa stroke study group. Neurology. 1998;50:883–890. doi: 10.1212/wnl.50.4.883. [DOI] [PubMed] [Google Scholar]
- 3.Johnston S. The economic case for new stroke thrombolytics. Stroke. 2010;4:S59–62. doi: 10.1161/STROKEAHA.110.597351. [DOI] [PMC free article] [PubMed] [Google Scholar]
- 4.Hacke W, Kaste M, Bluhmki E, Brozman M, Davalos A, Guidetti D, et al. Thrombolysis with alteplase 3 to 4.5 hours after acute ischemic stroke. N Engl J Med. 2008;359:1317–1329. doi: 10.1056/NEJMoa0804656. [DOI] [PubMed] [Google Scholar]
- 5.Young KC, Benesch CG, Jahromi BS. Cost-effectiveness of multimodal ct for evaluating acute stroke. Neurology. 2010;75:1678–1685. doi: 10.1212/WNL.0b013e3181fc2838. [DOI] [PMC free article] [PubMed] [Google Scholar]
- 6.Reed SD, Blough DK, Meyer K, Jarvik JG. Inpatient costs, length of stay, and mortality for cerebrovascular events in community hospitals. Neurology. 2001;57:305–314. doi: 10.1212/wnl.57.2.305. [DOI] [PubMed] [Google Scholar]
- 7.Earnshaw SR, Jackson D, Farkouh R, Schwamm L. Cost-effectiveness of patient selection using penumbral-based mri for intravenous thrombolysis. Stroke. 2009;40:1710–1720. doi: 10.1161/STROKEAHA.108.540138. [DOI] [PubMed] [Google Scholar]
- 8.Chambers MG, Koch P, Hutton J. Development of a decision-analytic model of stroke care in the united states and europe. Value Health. 2002;5:82–97. doi: 10.1046/j.1524-4733.2002.52011.x. [DOI] [PubMed] [Google Scholar]
- 9.Samsa GP, Reutter RA, Parmigiani G, Ancukiewicz M, Abrahamse P, Lipscomb J, et al. Performing cost-effectiveness analysis by integrating randomized trial data with a comprehensive decision model: Application to treatment of acute ischemic stroke. J Clin Epidemiol. 1999;52:259–271. doi: 10.1016/s0895-4356(98)00151-6. [DOI] [PubMed] [Google Scholar]
- 10.Hirsch JA, Yoo AJ, Nogueira RG, Verduzco LA, Schwamm LH, Pryor JC, et al. Case volumes of intra-arterial and intravenous treatment of ischemic stroke in the USA. J NeuroIntervent Surg. 2009;1:27–31. doi: 10.1136/jnis.2009.000166. [DOI] [PubMed] [Google Scholar]
- 11.Gold M, Siegel JE, Russell LB, Weinstein MC, editors. Cost-effectiveness in health and medicine. New York: Oxford University Press; 1996. [Google Scholar]
- 12.Arias E. United states life tables, 2006. Natl Vital Stat Rep. 2010;58:1–40. [PubMed] [Google Scholar]
- 13.Rawlins M, AJC National institute for clinical excellence and its value judgments. BMJ. 2004;329:224–227. doi: 10.1136/bmj.329.7459.224. [DOI] [PMC free article] [PubMed] [Google Scholar]
- 14.Ehlers L, Anderson G, Clausen LB, Bech M, Kjolby M. Cost-effectiveness of intravenous thrombolysis with alteplase within a 3-hour window after acute ischemic stroke. Stroke. 2007;38:85–89. doi: 10.1161/01.STR.0000251790.19419.a8. [DOI] [PubMed] [Google Scholar]
- 15.Demaerschalk BM, Hwang HM, Leung G. US cost burden of ischemic stroke: A systematic literature review. Am J Manag Care. 2010;16:525–533. [PubMed] [Google Scholar]
- 16.Greenberg D, Earle C, Fang CH, Eldar-Lissai A, Neumann PJ. When is cancer care cost-effective? A systematic overview of cost-utility analyses in oncology. J Natl Cancer Inst. 2010;102:82–88. doi: 10.1093/jnci/djp472. [DOI] [PMC free article] [PubMed] [Google Scholar]
- 17.Suh WW, Hillner BE, Pierce LJ, Hayman JA. Cost-effectiveness of radiation therapy following conservative surgery for ductal carcinoma in situ of the breast. Int J Radiat Oncol Biol Phys. 2005;61:1054–1061. doi: 10.1016/j.ijrobp.2004.07.713. [DOI] [PubMed] [Google Scholar]


