Abstract
Nucleosomes sterically occlude their wrapped DNA from interaction with many large protein complexes. How proteins gain access to nucleosomal DNA target sites in vivo is not known. Outer stretches of the nucleosomal DNA spontaneously unwrap and rewrap with high frequency, providing rapid and efficient access to regulatory DNA target sites located there; but rates for access to the nucleosome interior have not been measured. Here we show that for a selected high affinity nucleosome positioning sequence the spontaneous DNA unwrapping rate decreases dramatically with distance inside the nucleosome. The rewrapping rate also decreases, but only slightly. Our results explain the previously known strong position-dependence to the equilibrium accessibility of nucleosomal DNA, which is characteristic of both selected and natural sequences. Our results point to slow nucleosome conformational fluctuations as a potential source of cell-cell variability in gene activation dynamics; and they reveal the dominant kinetic path by which multiple DNA binding proteins cooperatively invade a nucleosome.
Introduction
The large enzyme complexes that carry out replication, transcription, recombination, and DNA repair function on naked DNA substrates; yet most eukaryotic DNA is wrapped in nucleosomes, which sterically occlude and strongly distort the DNA.1 How these enzyme complexes gain access to their DNA substrates in vivo is not understood. ATP-dependent nucleosome remodeling complexes can help by moving or disassembling nucleosomes,2 creating stretches of naked DNA on which other DNA-binding enzymes can act. What is not understood, however, is how these remodelers themselves “know” which nucleosomes to remodel. The remodelers are recruited to specific chromatin regions, through the actions of other site specific DNA binding regulatory proteins,2-5 raising a chicken-egg question of how these latter proteins gain access to their own target sites. One potential explanation, that nucleosomes in vivo simply do not cover up critical regulatory target sites, is falsified at over 1,000 gene promoters in yeast by the results of genome-wide nucleosome mapping studies.6-9. For example, at the well-studied GAL10–1 locus in yeast, in many cells a nucleosome centered over the four binding sites for the Gal4 transcription activator protein is occupied by the RSC remodeling complex, leaving the nucleosomes with only ~135 bp of wrapped DNA and potentially facilitating binding by the Gal4 protein.10 However many other cells in the population have full length nucleosomes covering this region,7 leaving all Gal4 sites sterically occluded; yet all cells in the population respond appropriately to galactose (L. Chen and J.W., unpublished).
These considerations led us to hypothesize that nucleosomes might not be inert, frozen structures, as imaged by X-ray crystallography,1 but instead might be dynamic, such that DNA that in the time average is wrapped might nevertheless be transiently accessible to other DNA binding proteins. Using biochemical and fluorescence resonance energy transfer (FRET)11 assays, we and others found that nucleosomes are indeed highly dynamic, spontaneously but transiently unwrapping stretches of their DNA starting from one end,12-17 while the rest of the nucleosome remains fixed in position along the DNA.12; 13 For both isolated nucleosomes and nucleosomes in long arrays,18; 19 the equilibrium constant for such spontaneous “site exposure” near the nucleosomal DNA ends is remarkably high, ~0.01–0.1 (i.e., end-stretches of the nucleosomal DNA are spontaneously unwrapped 1–10% of the time), decreasing progressively with distance inside the nucleosome, down to 10−5–10−6 for DNA sites near the middle.14; 20
Spontaneous nucleosomal site exposure is thought to facilitate the ability of RNA polymerase and other processive enzymes to elongate through a nucleosome.16; 21-23 In addition, it may play a role in photolyase-mediated repair of DNA, which occurs more quickly than can be explained by known ATP-dependent remodeling activities;24 and it may contribute to genome-wide transcriptional regulation,25; 26 through a nucleosome-induced cooperativity.27-30
In order for such intrinsic nucleosome dynamics to contribute to the real abilities of gene regulatory proteins to gain access to their DNA target sites, it is necessary that site exposure occur both with acceptably high probability (equilibrium constant), and also with acceptably high rate. In an initial study,16 we analyzed the dynamics for the ends of the wrapped nucleosomal DNA, and found that nucleosomes indeed spontaneously open up (partially unwrap their DNA) with remarkably high frequency, ~4 times per second (i.e., DNA remains fully wrapped for only ~250 milliseconds before spontaneously unwrapping). Once unwrapped, this open state lasts ~10–50 milliseconds, before the DNA spontaneously re-wraps. Thus, for regulatory DNA target sites located short distances inside a nucleosome, the rate of spontaneous nucleosome site exposure is sufficiently great so as to plausibly allow regulatory proteins to find and bind to these sites in vivo.
What happens, however, when a critical regulatory binding site is further inside a nucleosome, where its equilibrium accessibility is not 1–10%, but orders of magnitude lower? This question has not been systematically investigated. Moreover, the isolated data that do exist are complicated by problems of heterogeneous nucleosome positioning and unexpected nucleosome disassembly31, or by blinking of the FRET dyes32; 33 (see ref.34). On simple thermodynamic grounds, the greatly reduced equilibrium accessibility measured in our earlier work14; 20 must reflect a decreased unwrapping rate, or an increased rewrapping rate, or both. Here, we utilize two independent complementary approaches, stopped-flow FRET and FRET-fluorescence correlation spectroscopy (FRET-FCS), to measure the rates of nucleosome unwrapping and rewrapping for differing DNA sites from the end of the nucleosomal DNA in toward the middle. Our results establish that spontaneous access to sites further inside a nucleosome occurs with greatly reduced rate, and lead to new conclusions about the dynamics and mechanisms with which proteins can gain access to nucleosomal DNA target sites in vivo.
Results
Coupled protein binding / FRET assay for position-dependent site exposure
To investigate the position-dependent kinetics of nucleosome site exposure we take advantage of the steric occlusion of the wrapped nucleosomal DNA, by coupling site exposure to the binding of a site specific DNA binding protein. We use for convenience the LexA repressor protein of Escherichia coli. We construct homogeneously positioned nucleosomes that contain somewhere within their wrapped DNA a specific target site for LexA, such that LexA would “like” to bind to its target site, but can’t, because the site is sterically occluded inside the nucleosome. The nucleosomes are specifically labeled with a FRET donor dye (Cy3) placed at the DNA 5′-end distal to the LexA target site, and a fluorescence acceptor dye (Cy5) attached to a unique engineered cysteine residue (H3 V35C C110A)12 located nearby in space on the histone core (Fig. 1a). We estimate the expected donor–acceptor distance as ~2 nm, in comparison to a characteristic distance for energy transfer for this dye pair of ~6 nm, and thus we expect to, and indeed do observe, high FRET efficiency when the DNA is fully wrapped.12; 16 A second copy of the acceptor, present on the other symmetry-related copy of H3, is much further away and thus contributes little to the FRET signal (Fig. 1b). Spontaneous unwrapping of the nucleosomal DNA increases the distance between the unwrapped DNA and the histone core, decreasing the FRET efficiency and simultaneously freeing up the LexA binding site. Subsequent binding by LexA traps the nucleosome in this site exposed low FRET state. Although the unwrapping and re-wrapping process likely occur stepwise (e.g., in successive ~10 bp unwrapping or re-wrapping steps; see Discussion), within the limits of accuracy of our data they are well-described as two state processes with a single apparent unwrapping rate and a single re-wrapping rate.16 This FRET system allows the spontaneous unwrapping rate (the rate of site exposure itself, k12) to be measured directly, simply by adding LexA protein in sufficient concentration such that, once its binding site is exposed, binding itself occurs near-instantaneously and thus the unwrapping process is rate-limiting.16 In practice, the rate constants for site-specific DNA binding of LexA (and most other DNA binding proteins) are so great that this kinetic regime is easily achieved.16
Fig. 1. Experimental systems for stopped flow FRET analyses.
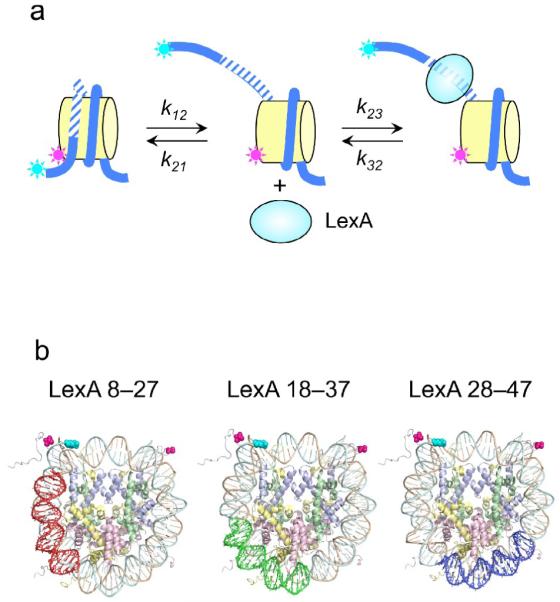
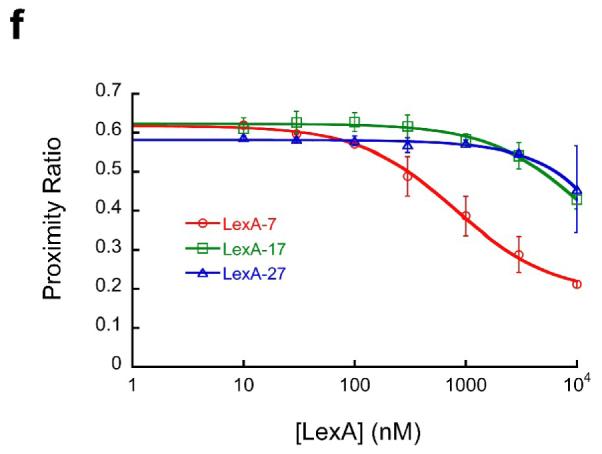
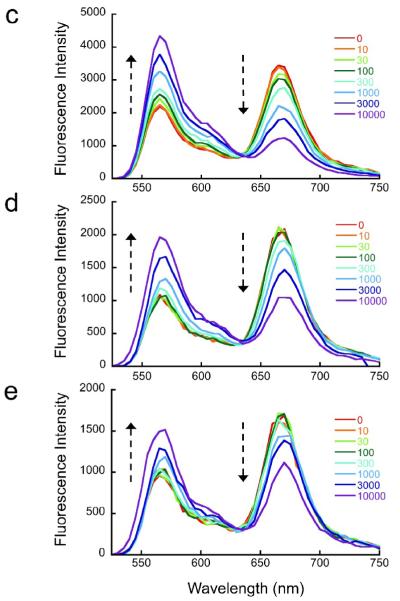
(a) Schematic illustration of experimental design. Nucleosomes are constructed having a fluorescent donor (Cy3, cyan) attached to one end of the DNA, and a fluorescent acceptor (Cy5, magenta) attached nearby on the histone protein core, to a unique engineered cysteine residue on H3 V35C C110A. A second, symmetry-related copy is located too far away to yield significant FRET. Spontaneous partial DNA unwrapping (middle panel) exposes a buried DNA target site (hatched) for the site specific DNA binding protein LexA. When LexA protein is rapidly added at sufficiently high concentration (200 nM or greater; ref.16), the rate of binding (k23 times the concentration of LexA) is much greater than the rewrapping rate (k21), trapping nucleosomes in the unwrapped state as these occur. In this regime, the observed relaxation rate equals the intrinsic unwrapping rate itself, k12. (b) Structural illustrations of three systems having the same FRET dye pair but moving the LexA target site inward toward the middle of the nucleosome in 10 bp steps. The actual basepairs comprising the target site are indicated. The overall nucleosome length is 147 bp, with the center at bp 74. (c–e) Normalized steady state fluorescence emission spectra from LexA titrations of the three systems in panel (b), respectively. Addition of increasing concentrations of LexA lead to increased Cy3 emission (at ~570 nm) and decreased Cy5 emission (at ~670 nm), implying decreased FRET efficiency. (f) Proximity ratios calculated from the data of panels (c-e); the mean and standard deviation (n=3) are indicated. The curves represent least-squares fits to a non-cooperative binding isotherm; the apparent affinities for the LexA 18–37 and 28–47 systems are too low to determine accurately given practical limits on the concentrations of LexA.
We recreated the system utilized in our earlier studies, in which the LexA site occupied basepairs 8–27 of the (147 bp-long) nucleosome DNA,12; 16 and we created two additional systems, in which the LexA site was moved further inside the nucleosome, to basepairs 18–37 or 28–47.
To confirm that these FRET systems were properly monitoring site exposure coupled to LexA protein binding, we carried out equilibrium titrations with increasing concentrations of LexA protein while monitoring the fluorescence emission spectra. As expected, addition of LexA protein led to decreased FRET, as reflected by the loss of sensitized emission from the FRET acceptor (Cy5, at ~670 nm) and corresponding increase in FRET donor emission (Cy3, at ~570 nm) (Fig. 1c–e). Parallel experiments using native gel mobility shift assays revealed equal affinities of LexA for all three DNAs, as expected, but were not capable of detecting site-specific binding to the nucleosome, because the site-specifically bound LexA-nucleosome complex does not survive native gel electrophoresis (results not shown, and ref.(12). We obtained apparent affinities (EC50’s) of 1–3 nM, in good agreement with our value (~5 nM) reported earlier.12 At micromolar concentrations, such as will be used in the stopped flow FRET experiments, below, LexA can also bind DNA nonspecifically; however control studies using the same FRET-labeled nucleosome constructs as studied here except with DNA lacking a specific LexA binding site show that, in the conditions of our experiments, nonspecific LexA binding is not accompanied by changes in unwrapping of the nucleosomal DNA as detected by FRET.12 Similarly, our earlier studies using restriction enzymes as probes for nucleosomal DNA site exposure showed that nonspecific binding by various restriction enzymes did not lead to positive or negative changes in nucleosomal DNA unwrapping equilibria.14; 35
Quantitative analysis of the FRET changes (Fig. 1f) showed that binding to the outermost of the LexA sites (bp 8–27) occurred with an apparent affinity of ~300 nM, i.e., ~100-fold lower affinity than for binding to naked DNA, consistent with our previous results12 and with expectation35; 36 given that at least ~30 or more DNA basepairs must unwrap from the nucleosome surface to allow LexA binding.37 Consistent with the predictions of the site exposure model,13; 14; 35 movement of the binding sites to positions further inside the nucleosome was accompanied by further large decreases in net LexA binding affinity. The resulting affinities were too low to measure accurately, since we could not add sufficient LexA protein to drive saturation; for the LexA site located at basepairs 18–37 we estimate an apparent affinity >10 μM.
Dynamics of position-dependent site exposure measured by stopped-flow FRET
We used these FRET systems to measure the rates of DNA unwrapping coupled to LexA protein binding. We rapidly mixed nucleosomes with equal volumes of a LexA protein solution or with buffer only, using a stopped flow instrument. We excited the Cy3 and monitored emission from both Cy3 and Cy5. A final LexA concentration of 1 μM ensured that LexA binding to a freely accessible target site occurs within the deadtime of the stopped flow mixing, <1 millisecond, since even 200 nM LexA suffices to reach this kinetic regime.16 Thus spontaneous DNA unwrapping itself (with rate constant k12) is rate-limiting for the binding process, and therefore the rates of the observed FRET changes directly reflect the rates with which the nucleosomes spontaneously unwrapped their DNA to the depth needed to allow LexA occupancy of its cognate target sites.
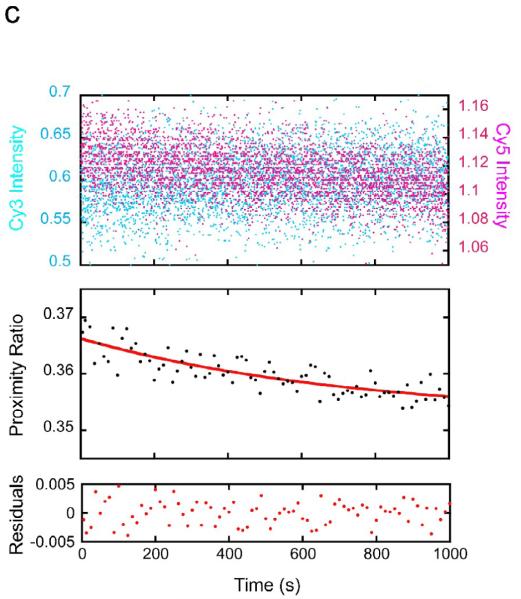
With nucleosomes having a LexA site at basepairs 8–27, addition of 1 μM LexA results in a rapid substantial decrease in acceptor emission and simultaneous increase in donor emission, implying a rapid decrease in FRET and thus, rapid nucleosome site exposure (Fig. 2a). No time-dependent change in either donor or acceptor was observed in mock reactions in which nucleosomes were mixed with buffer lacking LexA protein (results not shown). The corresponding decay in FRET proximity ratio fits well to a single exponential, yielding a relaxation time of 0.25 seconds, i.e., corresponding to a spontaneous unwrapping rate of 4.1 ± 0.2 sec−1, in agreement with our previous results with the same nucleosome system.16 Note too that we obtain the same apparent unwrapping rate despite the present use of a 5-fold higher LexA protein concentration (1 μM here, vs. 200 nM previously), confirming independently that these experiments take place in the required kinetic regime, where the observed rate equals the unwrapping rate, k12.
Fig. 2. Position-dependent unwrapping rates measured by stopped flow FRET.
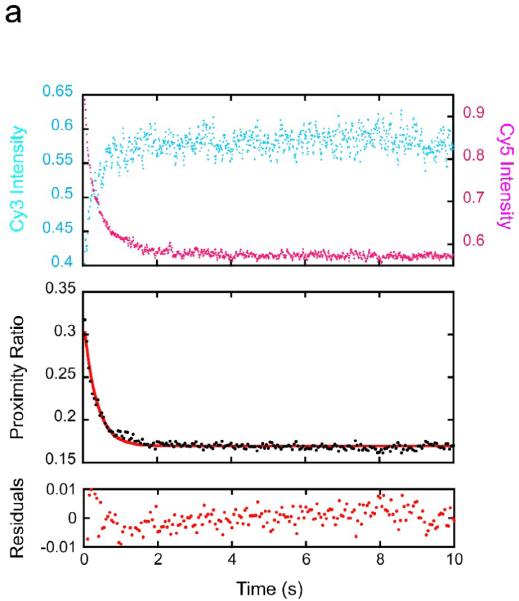
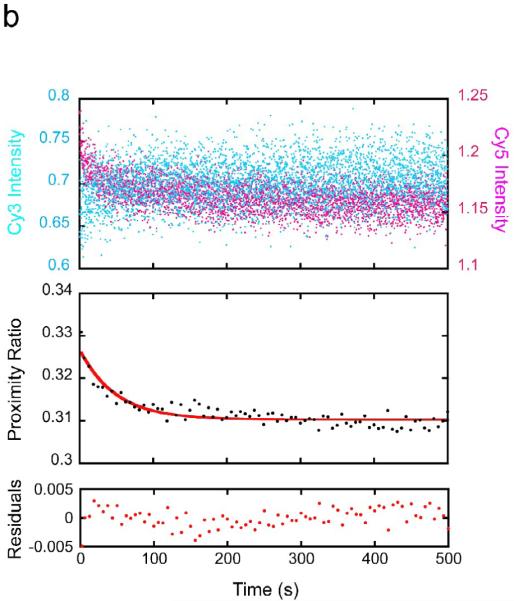
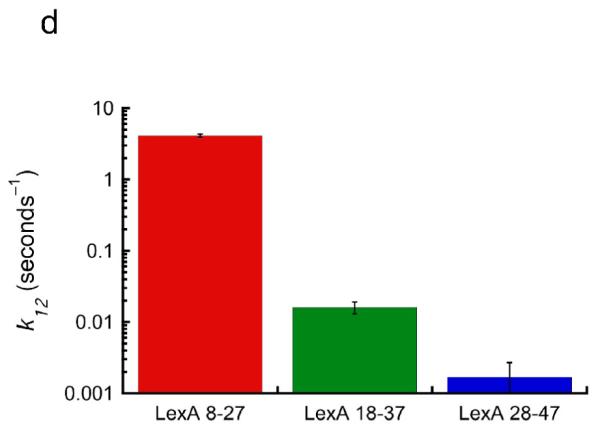
(a) FRET-labeled nucleosomes with the LexA site at bp 8–27 were rapidly mixed with LexA protein at a concentration for which DNA unwrapping is rate limiting (1 μM final concentration) while exciting the FRET Cy3 donor dye, and the fluorescence emission intensities from the Cy3 donor (cyan) and Cy5 acceptor (magenta) were measured over time. Top panel: the raw measured emission intensities; results from 5 replicates are averaged. Middle panel: proximity ratio calculated from the averaged Cy3 and Cy5 intensities of the top panel (black points), and single exponential fit (red curve). Bottom panel: residuals from the fit. The data fit well to a single exponential with a rate of 4.1 ± 0.2 sec−1, in good agreement with our previous results.16 (b) As in (a) but for the LexA target site located at bp 18–37; results from multiple replicates obtained on multiple timescales are averaged. Note the much longer timescale. These data fit well to a single exponential with a 250-fold slower rate, ~0.016 ± 0.003 sec−1. (c) As in (b) but for the LexA site at bp 28–47. Note the even longer timescale; the rate is another ~10-fold slower still, ~0.0017 ± 0.0010 sec−1.
Remarkably, when the LexA binding site was moved further inside the nucleosome by as little as 10 bp (to bp 18–37), the rate of DNA unwrapping sufficient to allow LexA binding at this more-buried site was far slower (Fig. 2b; note the 50x longer timescale), 0.016 ± 0.003 sec−1, ~250-fold lower than for the site at bp 8–27, corresponding to a time constant of 1 unwrapping event per ~63 seconds, i.e., ~1 per minute. The suddenness of this increase in unwrapping rate could be related to a high affinity of histone-DNA contacts over the H32–H42 region in this DNA sequence,38; 39 as site exposure sufficient to allow binding over basepairs 18–37 may require unwrapping into the region contacted by the H32–H42 tetramer. Site exposure to a site 10 bp even-further inside, bp 28–47, occurred ~10-fold even-more slowly (Fig. 2c), 0.0017 ± 0.0010 sec−1, i.e., 1 unwrapping event per every ~10 minutes. Since 200 nM LexA already sufficed to place the system in the needed unwrapping-limited kinetic regime for unwrapping rate at bp 8–27,16 the even higher LexA concentration used here together with the even slower unwrapping rates at the more-buried sites ensure that all of these observed rates reflect the spontaneous unwrapping rates.
Position-dependent FRET systems for site exposure
The site exposure mechanism supposes that partial DNA unwrapping and rewrapping occurs spontaneously at equilibrium, with unwrapping preceding and allowing the subsequent binding by a DNA binding protein. If this is correct, then these equilibrium unwrapping/rewrapping conformational fluctuations characterized in the stopped flow FRET experiment must be occurring even in the absence of added LexA. In our previous analysis, we used FRET-FCS to test for and characterize such equilibrium conformational fluctuations at the ends of the nucleosomal DNA.16 We showed that such unwrapping/rewrapping fluctuations did indeed occur spontaneously even in the absence of exogenous LexA protein, and moreover, that they occurred with the same unwrapping rate constant, ~4 sec−1 in the two independent experiments, i.e., regardless of whether LexA was present or not.
We therefore sought to use FRET-FCS in the present study as well, to provide an independent test for the existence of spontaneous equilibrium unwrapping/rewrapping fluctuations even to the inner more DNA sites, and to characterize the rates. In particular, the FRET-FCS experiment offers useful complementary information on the rates: in the stopped flow FRET experiment, we measure the unwrapping rate k12 (Fig. 1a) directly, and infer the corresponding rewrapping rate k21 indirectly, from the corresponding position-dependent equilibrium constant, Keq = k12 / k21. In contrast the FRET-FCS experiment is dominated by the (much faster) rewrapping rate k21, yielding this directly, while the unwrapping rate can be inferred given an estimate of Keq. (In certain cases, the unwrapping rate, too, can be inferred directly from the FRET-FCS data. However in the present case, the slow kinetics for the inner more sites, together with uncertainties about the FRET efficiencies of the unwrapped states for the different FRET systems, preclude a definitive determination of the unwrapping rates by this method; see Methods).
We created a series of FRET systems in which a Cy3 donor at a unique site on the DNA is located in close proximity to a Cy5 acceptor at a unique site on the protein core, for a set of DNA sites from the end in toward the middle of the nucleosome (Fig. 3a). We marched the Cy3 along the DNA, concomitantly moving the Cy5 around the circumference of the histone core, so that in each system, as for the FRET system used for the stopped flow experiments, at least one copy of the acceptor dye remains close to the donor (much closer than the expected characteristic distance for energy transfer, R0), yielding a high FRET signal when the DNA is in the fully-wrapped state.
Fig. 3. Experimental systems for FRET-FCS analyses.
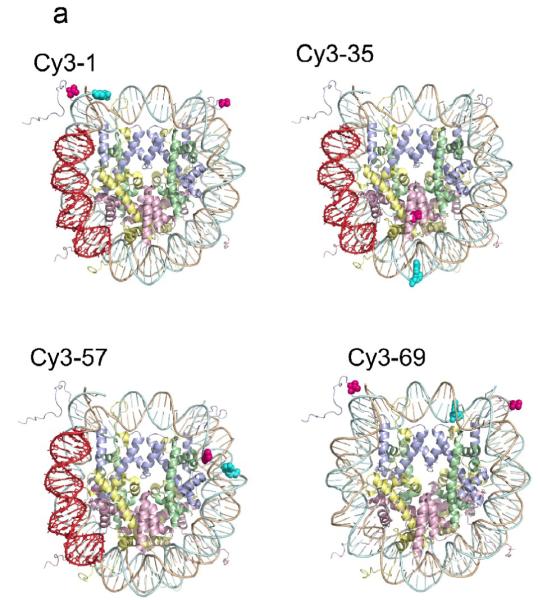
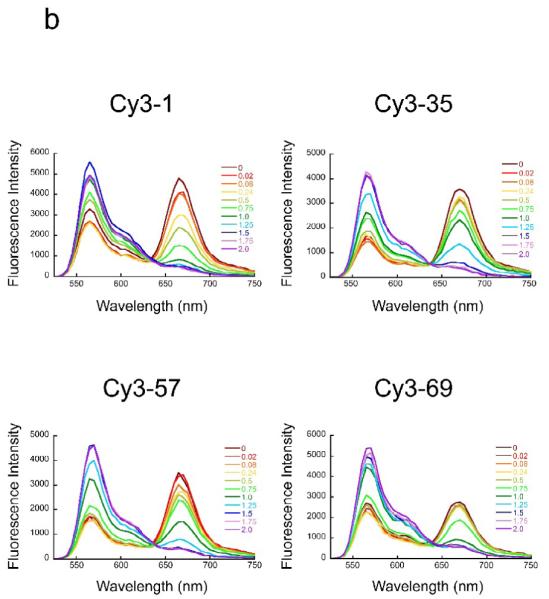
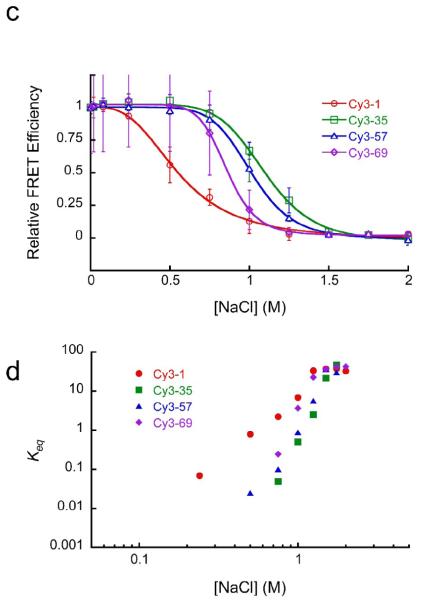
(a) Structural illustrations of four experimental systems. Cy3-1 is the same as the LexA 8–27 construct of Fig. 1b; the Cy3 donor (cyan) is located at the 5′ DNA end of bp 1, while the Cy5 acceptor (magenta) is attached to the unique engineered cysteine on histone H3 V35C C110A; both copies of the Cy5 acceptor are illustrated. The LexA target site, not used in the FRET-FCS analyses, is highlighted. Cy3-35 has the Cy3 at bp 35 and the Cy5 acceptor on H2B T112C (H3 C110A); a second copy of the acceptor is further away and is not visible in this view. Cy3-57 has the Cy3 at bp 57 and the acceptor on H4 L22C (and H3 C110A); again only the closer copy of the acceptor is illustrated. Cy3-69 has the Cy3 at bp 69 and the acceptors are again placed on histone H3 V35C C110A. (b) NaCl titrations of these four FRET systems. In all four systems, increasing the concentration of NaCl is accompanied by increased emission from the Cy3 donor and decreased emission from the Cy5 acceptor, implying decreased FRET efficiency. This behavior is expected: increasing NaCl concentrations first increase the fraction of time that DNA spends partially unwrapped from the histone surface (i.e., increases the equilibrium constant for site exposure), just as NaCl weakens any other ordinary protein–DNA interaction. Higher NaCl concentrations, in the range 0.75–1 M, drive histone H2A/H2B heterodimers off of the DNA, and from 1–2 M, drive H32H42 tetramers off the DNA as well.50 Error bars represent standard deviation from the mean from at least three replicates. (c) Quantitative analysis of the FRET titrations of panel (b). Relative FRET values are defined as ratios of proximity ratios in a given NaCl concentration to the proximity ratio measured at the lowest NaCl concentration. (d) Two-state analysis of the titrations. The apparent equilibrium fraction of time that the DNA is sufficiently unwrapped so as to give a low FRET signal is plotted as a function of the NaCl concentration. When the relative FRET values are too close to 1 or 0, an accurate determination of the equilibrium constant is not possible. The steeper dependence of the equilibria for internal sites compared to the Cy3-1 system is consistent with a requirement to disrupt a greater number of ionic contacts between protein and DNA for the more internal sites, as expected if access to these sites requires even more DNA unwrapping.
To confirm that these FRET systems properly monitor site exposure, we carried out titrations with NaCl, which destabilizes the wrapping of the nucleosomal DNA and, at sufficiently high concentrations, drives DNA off the histones altogether. Titration of each of these systems with increasing concentrations of NaCl (Fig. 3b) leads to increasing emission from the Cy3 donor (at ~570 nm) and decreasing emission from the Cy5 acceptor (at ~670 nm), which equate to a substantial decrease in FRET efficiency (Fig. 3c), as expected for a system monitoring DNA unwrapping. The decreasing FRET efficiency arises from the progressively increasing fraction of time that the DNA spends partially (or, at very high NaCl concentrations, completely) unwrapped off the surface of the histones. The simplest analysis of such data supposes that only two states are highly populated at any point: a fully-wrapped state with high FRET, and a significantly unwrapped state with low FRET. (Note that unwrapping can only approximate true two-state behavior at any given depth of unwrapping, since the observed equilibrium accessibilities depend on distance inside the nucleosome, in accord with a stepwise unwrapping mechanism – see Discussion.) In this 2-state approximation, the FRET titrations can be analyzed for the equilibrium constant for DNA unwrapping at each NaCl concentration (Fig. 3d). The lower Keq for inner-more sites, at any given NaCl concentration, reflects a lower probability that unwrapping proceeds to sufficient distance to give a FRET change at these inner locations, consistent with expectation for progressive DNA unwrapping starting from one end of the DNA. The FRET system with the DNA labeled at basepair 69 consistently showed greater population of unwrapped states at a given concentration of NaCl than do the systems monitoring site exposure at basepairs 35 and 57. This might reflect a destabilization of these nucleosomes due to the dye bound at basepair 69 or to unique nicks in the DNA backbone arising from the DNA labeling approach used for this construct only (see Methods).
Site exposure dynamics measured by FRET-FCS
We next used these FRET-labeled nucleosomes in FRET-FCS studies to measure the dynamics of position-dependent DNA rewrapping. A technical problem that we can anticipate based on the above stopped flow FRET results is that, because of the low rates for spontaneous DNA unwrapping, most nucleosomes will diffuse into and then back out of the FCS observation volume without ever undergoing an unwrapping conformational fluctuation, leading to poor signal to noise ratios. Nevertheless, because an alternative approach of using immobilized nucleosomes has other well documented technical problems (see ref.34), we preferred to make measurements in free solution at higher nucleosome concentrations. Again, although the unwrapping and re-wrapping process likely occur stepwise (see Discussion), within the limits of accuracy of our data they are well-described as two state processes with a single apparent unwrapping rate and a single re-wrapping rate.16 We improved our past experiment by measuring both donor autocorrelations and donor-acceptor cross-correlations from a single sample.40 These data allow the contributions of diffusion to be removed without requiring separate analysis of a donor-only labeled sample,16; 41-43 thereby eliminating some sources of experimental error. We confirmed this new approach in a separate study using the Cy3-1 system prepared here40 (Fig. 4a,b), obtaining the rewrapping rate constant k21 = 21 sec−1 (i.e., the lifetime of this unwrapped state is ~48 milliseconds, before the DNA spontaneously re-wraps), in good agreement with the results of our previous FRET-FCS ratio autocorrelation measurement.
Fig. 4. Position-dependent rewrapping rates measured by FRET-FCS.
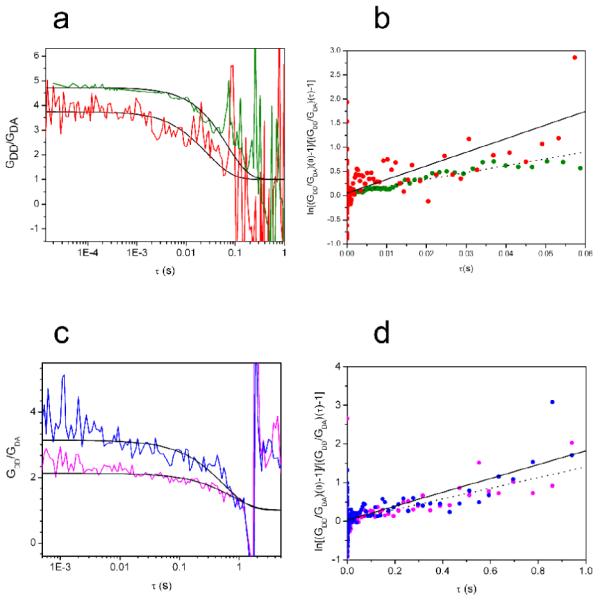
(a) Ratios of donor-donor autocorrelations to donor-acceptor cross correlations, plotted versus lag time (log scale). Red, results for Cy3-1 system, reported elsewhere40; green, results for Cy3-35 system. The characteristic decay time of such curves is the reciprocal of the sum of the unwrapping and rewrapping rate constants (k12 + k21), which is dominated by the rewrapping rate, yielding k21 directly. The solid lines represent theoretical predictions using k21 = 21 sec−1 for Cy3-1, in good agreement with our earlier measurement of 20 sec−1 which was obtained using a different FRET-FCS approach;16 and using k21 = 15 sec−1 for Cy3-35. (See Methods for additional details.) (b) At long delay times the logarithm of the ratio function decays of panel (a) becomes linear, with a slope that equals the reciprocal of the relaxation time independently of other experimental variables. Red and green data points from the curves of panel (a). Lines represent linear fits from which the rates used for the modeling of panel (a) were obtained. (c) As in panel (a) except for the Cy3-57 and Cy3-69 systems (blue, magenta, respectively). Lines represent theoretical predictions using k21 = 1.8 sec−1 for Cy3-57, and using k21 = 1.4 sec−1 for Cy3-69. (d) As in panel (b) but for the Cy3-57 and Cy3-69 systems (blue, magenta, respectively), with linear fits.
Moving the dye pair from the end of the DNA to a location 35 basepairs inside the nucleosome (Cy3-35) – which requires unwrapping to a depth even greater than 35 basepairs, so as to get a significant FRET change for the dye at basepair 35 – only slightly decreased the rewrapping rate, to 15 sec−1, corresponding to an unwrapped state lifetime of ~65 milliseconds before the DNA spontaneously re-wraps (Fig. 4a,b). Thus, while the unwrapping rate decreased by orders of magnitude when unwrapping to this depth was required, the rewrapping rate changes little; and together these net out to the significantly decreased equilibrium accessibility of such interior sites.
Moving the dye pairs even further inside the nucleosome (Fig. 4c,d) led to further significant but modest decreases in the rewrapping rate. The Cy3-57 system yielded a rewrapping rate of 1.8 sec−1 (unwrapped state lifetime of ~560 milliseconds), while the Cy3-69 system yielded a rewrapping rate of 1.4 sec−1 (unwrapped state lifetime of ~740 milliseconds). Since the Cy3-69 system revealed an anomalously decreased stability compared to the others, it is possible that the corresponding rewrapping rate could be similarly be anomalously slow; but such an effect would be small at most, as the difference between this rate and that for the Cy3-57 system are small.
Discussion
Dynamics of position-dependent site exposure
Our major finding is that the rate with which the nucleosomal DNA spontaneously unwraps to make buried DNA target sites accessible for binding decreases dramatically – by orders of magnitude – for target sites located increasingly far inside the nucleosome. The rewrapping rates vary too, but much less so, and opposite in direction to what might have been anticipated from the known position dependent equilibrium constants for accessibility.
The outer stretch of the nucleosomal DNA spontaneously unwraps off the histone surface with high frequency, ~4 times every second (4 sec−1). We showed this previously both by stopped flow FRET, monitoring the accessibility of the LexA target site located at bp 8–27, and by FRET-FCS with a FRET donor placed at the end of the nucleosomal DNA (bp 1) and an acceptor nearby on the histone core. We reconfirmed the FRET-FCS result recently,40 and reconfirm the stopped flow FRET results again here (Figs. 2a, 5a). Thus, nucleosomes look like those imaged by X-ray crystallography for only short periods of time, ~250 milliseconds on average, before undergoing a spontaneous large scale DNA unwrapping conformational change, making this outer stretch of nucleosomal DNA accessible.
Fig. 5. Summary of kinetic measurements.
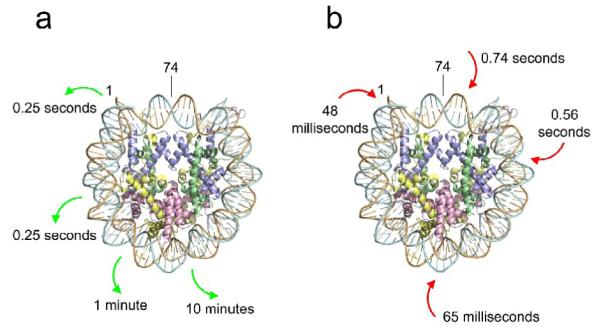
(a) Characteristic times required for spontaneous DNA unwrapping measured as a function of distance inside the nucleosome with probes centered basepairs 1, 17-18, 27-28, and 37-38 (green arrows). Results at basepairs 17-18, 27-28, and 37-38 from stopped flow LexA binding experiments (Fig. 2); results at basepair 1 measured by FRET-FCS using samples with the Cy3 donor dye attached at basepair 1 prepared in this study and reported elsewhere.40 The center of the nucleosomal DNA is basepair 74. (b) Characteristic times for DNA rewrapping, measured from the FRET-FCS experiments (Fig. 4). The locations to which the Cy3 donor dye was attached (basepairs 1, 35, 57, 69) are indicated (red arrows).
When the LexA binding site is moved just 10 bp further inside the nucleosome, to bp 18–37, the rate of spontaneous accessibility decreases ~250-fold, to 0.016 sec−1, i.e., spontaneous unwrapping to this inner more site occurs on average only once every minute (Fig. 5a). Moving the site another 10 bp further inside (bp 28–47) decreases the rate even further, to 0.0017 sec−1, i.e., spontaneous unwrapping to this even more buried site occurs on average only once every ten minutes.
The rewrapping rates, measured directly here by FRET-FCS, changed too, but much less so than for the unwrapping rates. For FRET dye pairs with the donor dye located on the DNA at basepairs, 1, 35, 57, and 69, and acceptor dyes in each case located on the protein core nearby the donor, we obtained rewrapping rates (lifetimes for the unwrapped state) of 21 sec−1 (48 milliseconds), 15 sec−1 (65 msec), 1.8 sec−1 (560 msec), and 1.4 sec−1 (740 msec), respectively (Fig. 5b).
These results mean that the large decrease in equilibrium accessibility that occurs with increasing distance inside the nucleosome is due to an even larger decrease in the rate of spontaneous unwrapping with distance inside the nucleosome, partially mitigated by modest increases in the lifetime of the resulting increasingly-unwrapped states.
One can estimate position-dependent equilibrium constants from the present data, by taking ratios of the measured unwrapping and re-wrapping rates, interpolating the measurements where needed to obtain an estimate for a given nucleosomal location. For example, for the location around basepair 35, one might use the unwrapping rate observed for the LexA 18–37 system (k12 = 0.016 sec−1), together with the re-wrapping rate measured for the Cy3-35 system (k21 = 15 sec−1), yielding an apparent equilibrium constant for site exposure at this location of Keq ≅ 10−3. This value falls in between other measurements that we have made for nearby nucleosome locations on other DNA sequences. It is significantly greater than the ~10−5–10−4 measured at analogous locations for a different derivative of the 601 sequence,20 although we emphasize that the results are not strictly comparable since a majority of the nucleotides between the DNA end and basepair 35 differ in the two experiments. Conversely, the Keq estimated here is also at the low end of the 10−3–10−2 measured at analogous locations on an unrelated DNA sequence.14
While the results of this work pertain specifically to the DNA sequences that we analyzed, which are all derivatives of the high affinity “601” nucleosome positioning sequence isolated earlier in our laboratory,39 there is nothing fundamentally unnatural about this sequence. Its affinity is only slightly greater that that of natural sequences such as the mouse “TATA” sequence, and only modestly greater than that of the mouse “CAG” and “NoSecs” sequences, or the sea urchin 5S rRNA nucleosome positioning sequence.44 When incorporated into genomic DNA it causes no ill consequences to living cells, and its nucleosome positioning properties are subsequently overridden by other genetic processes.45 All nucleosomes, not just lower-affinity ones, need to have their DNA accessible in vivo, for processes such as DNA repair and replication.
Moreover, the decrease in equilibrium constant for site exposure with distance inside the nucleosome that is characteristic of the 601 sequence20 (and is experienced by diverse ligands, not just DNA binding proteins)36; 46 applies to many, and possibly all DNA sequences, both natural and non-natural, not just 601;14; 20; 27; 28; 47-49 and this generally observed position-dependent decreasing equilibrium accessibility is most naturally explained by a corresponding decrease in the rate of DNA unwrapping – as measured directly in the present study on the 601 sequences. No existing experiments or theories support the alternative possibility for the natural sequences, namely, that their decreasing equilibrium accessibility is attributable to an increased rate of DNA re-wrapping. Similarly, the strongly decreased rate of DNA unwrapping over the central stretches of the nucleosomal DNA is unlikely to be unique to the 601 sequences, since this region of nucleosomal DNA is wrapped by the histone H32H42 tetramer, which is bound exceedingly strongly to DNA in essentially all nucleosomes, as measured by the high concentrations of NaCl required to drive the tetramer off.50. Finally, while the 601 sequence can apparently influence the kinetics of nucleosome remodeling,51 other detailed mechanistic studies chiefly reveal not differences of mechanism between 601 and natural sequences but instead commonality.52; 53 Thus, while our present findings apply specifically to the 601-like sequences studied here, we expect that our conclusions will apply to nucleosomal DNA sequences generally.
Mechanism of site exposure
Our early observations of a stepwise decrease in equilibrium accessibility with distance of target sites inside the nucleosome, together with the structure of the nucleosome itself, suggested a simple physical model for the site exposure process, in which the nucleosomal DNA unwraps progressively in steps of ~10 bp (one DNA helical turn), starting from one end.14 Contacts between DNA and the histone protein core occur chiefly in small patches on the DNA backbone, every DNA helical turn, when the backbone (and minor groove) face inward toward the histone core.1 Assuming for simplicity that each such protein–DNA contact patch contributes an approximately equal favorable interaction energy, then each successive ~10 bp of DNA unwrapped would incur a roughly constant additional energetic cost, leading to a stepwise increase in total energy cost, and thus to a stepwise decrease in equilibrium accessibility, as observed experimentally. Key aspects of this model for the site exposure process were subsequently confirmed in FRET experiments which showed that the DNA end does indeed move away from the histone core when a protein is bound to the DNA just inside the nucleosome from the end (bp 8–27, as in the present study),12 and in FRET-FCS experiments that showed that such unwrapping fluctuations for the end stretches of the nucleosomal DNA occurred spontaneously even in the absence of exogenous DNA binding proteins16.
If this model for the mechanism of site exposure is correct, it follows that not only should the equilibrium constant for site exposure decrease with distance inside the nucleosome, but, specifically, the unwrapping rate itself should decrease. The reason is that after each successive helical turn of DNA is unwrapped, the system has a stochastic choice between rewrapping the most-recently unwrapped ~10 bp, or unwrapping another ~10 bp. Since unwrapping incurs an energy cost, while rewrapping lowers the energy, the system is biased at each step in favor of rewrapping, thus the probability of n successive unwrapping steps decreases strongly with increasing n, thereby decreasing the average rate for unwrapping n DNA helical turns.
Our results uphold this chief prediction: as the LexA binding site is moved inward in steps of ~10 bp, the unwrapping rate does indeed decrease substantially, as predicted. Note however that the amount by which the unwrapping rate decreases with distance is plainly not constant, since moving the LexA binding site in two successive 10 bp steps decreased the rate by ~250-fold and ~10-fold, respectively.
Gerland and colleagues54 have analyzed a detailed physical and kinetic model for stepwise nucleosomal DNA unwrapping, in which equivalent attractive contacts between histone and DNA occur at regularly spaced 10 bp intervals. Our results uphold qualitative but not quantitative predictions this model for site exposure. This model predicts that the unwrapping rate should decrease with distance inside the nucleosome, in agreement with our findings, however the model again assumes that protein–DNA contacts are equivalent and thus predicts a strictly exponential dependence of the unwrapping rate on distance, contrary to observation. Similarly, this model correctly predicts that the rewrapping rate should decrease with increasing extent of unwrapping, but, again, our findings reveal that this dependence is irregular. Leaving aside the data for the FRET pair at bp 69 because of its possible anomalous equilibrium stability noted earlier, we still observe irregular decreases in rewrapping rate, with a small decrease for probes at bp 35 versus bp 1, but a large decrease in rate for bp 57 versus bp 35 (Fig. 4). Thus, within the context of this model for the site exposure process, the approximation that all protein–DNA contact patches are energetically equivalent is not quantitatively correct. This is not surprising, as details of the chemical interactions between histone and DNA are not precisely conserved along the length of the nucleosome DNA, and indeed the conservation of sequence among 601-like family members is not constant along the full nucleosome length.38 Future models would then need to incorporate position-dependent (and sequence-dependent20) differences in protein–DNA contact energetics in order to reach a quantitative agreement with experiment. Alternatively, a different model altogether might be needed. These questions await further research.
Mechanisms of access to nucleosomal DNA target sites in vivo
How can gene regulatory proteins access their target sites when these are buried inside a nucleosome in vivo – as happens in yeast at more than 1,000 genes?6-9; 55 One possibility is that a ubiquitous activity of ATP-dependent remodeling enzymes renders all buried target sites accessible on sufficiently rapid timescales so that accessibility is not rate limiting for binding in vivo. However, these remodeling factors are known to be recruited,2; 4; 5; 56 raising a chicken-egg question of how they are recruited if the recruiter’s site is buried, while ubiquitous (unrecruited) activities have not been demonstrated. Moreover the slow kinetics of remodeling compared to DNA repair,24 gene specific activities of the different remodeling factors,4; 5; 57 and the relative lack of changes in the detailed distributions of nucleosomes coupled to gene activation or repression at many genes58 argue against ubiquitous remodeler activity as a primary mechanism for target site accessibility.
A different possibility is that access to buried target sites is an intrinsic property of nucleosomes both in vitro and in vivo. Our findings point to three new conclusions about the mechanisms of this spontaneous access.
First, the rate with which a given target site will become accessible by spontaneous nucleosome dynamics strongly depends on the detailed location of the target site within the nucleosome. Target sites near the end of the nucleosome become accessible with high frequency (many times per second), while access to target sites nearer the middle of the nucleosome may require minutes or tens of minutes on average. Moreover, the unwrapped states do not persist very long before the DNA re-wraps, rendering the site inaccessible again. Depending on the concentration of the regulatory protein in question, multiple nucleosome unwrapping events – requiring even longer periods of time – might be required before a successful encounter of a regulatory protein with its target site.
Position-dependent DNA unwrapping rates, together with the observed variability in nucleosome positioning between cells even in a clonal population, would thus lead naturally to a dispersion in response times at a given promoter, with some cells in the population potentially taking long periods of time before responding with changed expression of a given gene. Such dispersion in response times, including slow kinetics for some cells, have previously been observed and linked to nucleosome occupancy,59; 60 although these differences were previously ascribed to cell to cell differences in remodeling rates. Our findings provide an alternative, and potentially simpler, explanation, in which the observed rates might instead be limited by a requirement for spontaneous nucleosome unwrapping.
If access of a given DNA binding protein to a more-internal nucleosomal DNA binding site is indeed limited chiefly by slow rates of DNA unwrapping, the actual rate of binding might then be relatively insensitive to the protein’s concentration. Conversely, because of the high rate of DNA re-wrapping especially at outer-more nucleosomal sites, access of proteins at these outer-more regions might be more-limited by the short lifetime of the open (unwrapped) state, and thus might be more-sensitive to the protein’s concentration.
Second, processive enzymes such as RNA polymerase, which track along DNA, can beat these intrinsic limits on rates of access to the nucleosome interior by acting as molecular ratchets, trapping unwrapping fluctuations as they occur. We previously found that bacteriophage RNA polymerases are able to progress through a nucleosome with little reduction in the enzyme’s elongation rate,22; 23; 61 implying that access to the entire nucleosomal DNA can occur within just seconds – far faster than our new results show is possible for passive binding proteins to access sites far inside the nucleosome. We proposed that processive enzymes enter the nucleosomal DNA during an unwrapping fluctuation, which occur at high frequency at the ends of the nucleosome.16 Once inside the nucleosome’s DNA, the enzyme acts as a ratchet, with its steric bulk preventing the nucleosomal DNA from rewrapping. Successive unwrapping steps can be similarly trapped, thereby providing far faster access to inner more stretches of the nucleosome DNA. Notably, the elongation rate of eukaryotic RNA polymerase II through a nucleosome might be governed by the detailed dynamics of these spontaneous nucleosome unwrapping events.21
Third, genomes can take advantage of an intrinsic nucleosome-dependent cooperativity to facilitate the rate of access even by simple (passive) DNA binding proteins. We showed previously that two or more arbitrarily-chosen DNA binding proteins having target sites contained within the same nucleosome will automatically act cooperatively (synergistically), facilitating each others’ binding, simply as a consequence of fighting against a common nucleosome competitor. Such behavior is implicit in the site exposure mechanism,14 and occurs in vitro in quantitative accord with this model28. Equivalent effects are observed in vivo,29; 30 and are thought to contribute to transcriptional regulation genome-wide.25; 26
An equilibrium description for the binding of two proteins, X and Y, to distinct nucleosomal target sites requires a complete thermodynamic cycle, with four distinct nucleosome states (Fig. 6): N, N–X, N–Y, and N–XY, where N is the nucleosome, and X and Y bind the outer more and inner more sites, respectively. Our kinetic analysis implies that, for comparable concentrations and affinities of X and Y, the actual flux through this pathway will be dominated by the upper path, because of the much greater rate for exposure of the outer more site (for X) than for the inner more site (for Y).
Fig. 6. Model for the cooperative invasion of a nucleosome by two arbitrary DNA binding proteins.
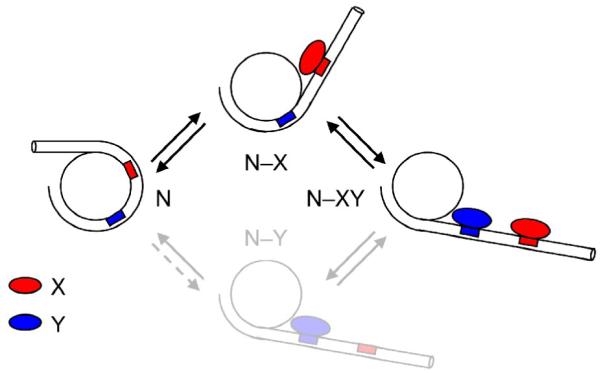
N represents a nucleosome with fully wrapped DNA; N–X the complex in which DNA has partially unwrapped, allowing protein X to occupy its site (defined as the outer more of the two target sites); in N–Y the DNA has unwrapped even further, allowing binding by Y. N–X and N–Y convert to the doubly occupied complex N–XY by subsequent binding of Y or X, respectively. The results of the present study imply that, while all states of the system can in principle exist, given comparable concentrations and binding affinities (to naked DNA) for proteins X and Y, the actual flux of the system is dominated by the upper path.
Unwrapping of the shorter (outer more) length allows binding by X, which traps this partially unwrapped state, facilitating the further unwrapping that allows access to Y’s site, and thus binding by Y to yield the doubly occupied complex N–XY.
It follows that genomes can ensure rapid access to DNA target sites, despite cell to cell variability in nucleosome positioning, by juxtaposing multiple target sites for the same or different proteins together in space such that at least one of them is always close to the end of the nucleosome. Spontaneous intrinsic nucleosome dynamics allows rapid access to this outer more site, thereby enhancing the rate of access to inner more sites. Thus, cooperative nucleosome invasion provides an alternative mechanism with which cells can overcome intrinsically slow access to target sites in the interior of the nucleosome.
Finally, we note that, while our present study has addressed the position dependence of rates of target site accessibility within individual nucleosomes, similar results might hold also for long nucleosome arrays, since the position-dependent equilibrium accessibilities – which represent ratios of the unwrapping and rewrapping rate constants – changed little when a distinguishable test nucleosome was placed in the middle of a highly compacted 17-mer long nucleosome array.19
METHODS
DNA, histones, and LexA protein
Cy3-labeled DNA LexA 8–27 (also used as FRET-FCS construct Cy3-1) was prepared exactly as described,12 using a 2-stage PCR procedure. The first stage incorporates a LexA consensus sequence (TACTGTATGAGCATACAGTA) into basepairs 8–27 of the 147 bp “601” nucleosome positioning sequence.12; 38; 39 The second stage incorporates the Cy3 dye at the 5′ end of basepair 1. A commercially synthesized 5′-Cy3 labeled primer is first purified away from unlabeled primer and free Cy3 by reverse phase HPLC, then incorporated into the nucleosomal DNA by the second stage of preparative PCR. The resulting labeled DNA is purified by reverse phase HPLC. See ref.12 for further details. LexA 18–37 and LexA 28–47 DNAs were prepared identically except that the LexA consensus sequence replaced those corresponding nucleotides of the 601 sequence. Cy3-35 and Cy3-57 DNAs were prepared by the same procedure as for LexA 8–27 DNA except that the second generation dye labeled primer had the Cy3 attached off the DNA base at nucleotide position 35 or 57, respectively, instead of at the 5′-end of the primer. In this case, the primers for labeling were purchased with amino-dT residues at the position to be labeled; these were then subsequently derivatized with amine-reactive Cy3, and the resulting dye-labeled oligonucleotides purified by reverse phase HPLC. Subsequent steps were as for LexA 8–27 (Cy3-1). The Cy3-69 DNA was prepared using a different approach. It incorporates the 601 DNA sequence itself (with no LexA site), and was assembled from 4 HPLC-purified long oligonucleotide primers, one containing a 5′-Cy3 end label at the position destined to become basepair 69 (counted here from the right hand end of the 2-fold rotationally symmetric nucleosome; i.e., basepair 79 counted from the left), together with HPLC-purified unlabeled oligonucleotides of lengths 48 nt, 78 nt, and 99 nt. The four oligonucleotides were annealed, and the resulting 147 bp double stranded labeled DNA purified by preparative PAGE. Recombinant Xenopus core histone proteins were expressed in Escherichia coli, purified in denatured form, refolded, reconstituted into histone octamers, and, when required, labeled with a sulfhydryl reactive Cy5 dye, as described.12; 16; 62; 63 All systems prepared contained the engineered substitution H3 C110A, eliminating the unique wild type cysteine residue. Histones used for the LexA 8–27 (Cy3-1), 18–37, and 28–47 systems, and for Cy3-69, additionally contained the mutation H3 V35C, described previously.12; 16; 63 Two additional engineered histone mutants were prepared and purified by the same methods: H2B T112C, used for Cy3-35; and H4 L22C, used for Cy3-57. LexA protein was expressed in E. coli and purified in native form as described.12; 16; 63
Nucleosome reconstitution
Cy3-labeled DNAs were reconstituted with Cy5-labeled or unlabeled histone octamers in the presence of excess salmon sperm DNA as a histone buffer, using salt gradient double dialysis as described.64; 65 The resulting nucleosomes were purified away from any free 601 DNA, the competitor DNA, any non-nucleosomal aggregates, and any remaining free dye, by sucrose gradient ultracentrifugation as described.14; 39 Nucleosome concentrations were determined from the Cy3 absorbance.
Gel mobility shift measurements of LexA binding to DNA
The binding affinity of LexA protein to the different naked DNA constructs was measured by quantitative native gel mobility electrophoresis, using tracer quantities of the 32P-labeled DNAs, as described.12 The gels were analyzed by phosphorimager. The resulting band intensities were fit to simple binding isotherms; we report the results as midpoints of the fits (EC50’s).
Steady state and stopped flow fluorescence measurements
Steady state and stopped flow fluorescence measurements were carried out as described.63 For titration experiments, raw emission spectra from each titration points were brought onto a common scale by normalization for total integrated intensity. For all experiments, nucleosome solutions were diluted to 5 nM final concentration in 0.5 x TE, pH 8.0 (TE is 10 mM Tris, 1 mM Na3EDTA). LexA binding titrations were fit to simple binding isotherms, and are reported as midpoints of the fits (EC50’s). Stopped flow kinetic experiments were done with 0, 400 nM or 1 μM LexA. Stopped flow fluorescence changes were measured simultaneously from two channels for 10 to 1000 seconds. Emission intensities from multiple replicates were averaged. We calculated the proximity ratio (A/(D+A)), where A is the (replicate-averaged) emission intensity in the Cy5 acceptor channel, and D the (replicate-averaged) emission intensity in the Cy3 donor channel, as a proxy for the FRET efficiency. The resulting proximity ratios were smoothed over timescales of 50 msec (LexA 8–27), 200 msec (LexA 18–37) or 2 sec (LexA 28–47).
Fluorescence correlation spectroscopy
FCS measurements were carried out using a Nikon Eclipse TE2000-U microscope (Nikon, Melville, NY). A 532nm CW Nd:YVO4 laser (Millenia Xs, Coherent, Santa Clara, CA) was used as the excitation source and focused onto the sample using a 100X 1.4NA oil immersion objective (Plan Apo, Nikon, Melville, NY). The same objective was used to collect the emitted photons. The donor and acceptor signals were separated using a dichroic mirror (Q660LP Chroma Technology Corp., Rockingham, VT) and detected using two silicon avalanche photodiodes (SPCM-AQR-12, Perkin-Elmer, Fremont, CA). Appropriate filters were used in front of the detectors to further reduce background and crosstalk (BP570/40 for Cy3 and BP670/40 for Cy5, Chroma Technology, Rockingham, VT). A pinhole in the detection path was used to reject out-of-focus light in measurements with samples Cy3-1 and Cy3-35 as described elsewhere.16; 40 Samples Cy3-57 and Cy3-69 were measured without the pinhole (see below); in this case, the observation volume is limited by the active area of the detectors (~200 μm diameter). Donor and acceptor intensities (ID and IA) were measured with 10 μs time resolution using a PCI-6602 acquisition board from National Instruments (Austin, TX). The donor autocorrelation function (GDD) and the donor-acceptor cross-correlation function (GDA) were calculated as a function of the lag time (τ) as
| (1) |
where the angular brackets represent averages over the overall measurement time, δIx,y represents the intensity fluctuation measured at detector x or y, defined as a deviation from the mean: δIx,y = Ix,y - 〈Ix,y(t)〉.
All experiments were performed with 10 nM donor-acceptor nucleosome samples in 1 X TE buffer in the presence of 100 nM unlabeled nucleosome core particles to improve nucleosome stability.66 Background contributions were measured under the same conditions in the absence of labeled nucleosomes, and were less than 0.5% (donor detector) and 1.5% (acceptor detector) of the measured signals in the presence of fluorescent nucleosomes. Crosstalk (donor signal measured in the acceptor channel) was estimated as 5% using a donor-only DNA sample. The contributions of the acceptor signal in the donor channel were negligible.
In previous work, we investigated the dynamics of nucleosomes modified at the 5′ end of the DNA by comparing the autocorrelation decay of the donor signal obtained for donor-only and donor-acceptor labeled nucleosomes.16 For the double-labeled sample, fluctuations in donor intensity are due to translational diffusion as nucleosomes diffuse through the observation volume, and to DNA wrapping-unwrapping transitions that affect the distance between the donor and acceptor probes. The ratio of the donor autorocorrelation decays of the donor-only and donor-acceptor labeled samples isolates the contributions of these conformational transitions from those due to translational diffusion, allowing the determination of the relaxation time of the process (τR = (k12 + k21)−1). This approach requires that the two experiments are carried out under identical conditions so that the diffusion contributions are properly cancelled. However, some experimental variables, including sample concentration, size and shape of the observation volume, inhomogeneities in cover slip thickness, etc, are hard to control precisely between measurements. Subsequent work demonstrated that these experimental difficulties can be overcome by analyzing the ratio of the donor autocorrelation and the donor-acceptor cross-correlation functions (GDD/GDA) measured for the doubly-labeled sample.40 The auto- and cross-correlations are calculated from the same stream of photons, so they are acquired simultaneously in a single experiment, eliminating all sources of experimental artifacts that are associated with the need of conducting two experiments in equal conditions.
Although the ratio GDD/GDA is independent of the diffusion contributions, its signal-to-noise ratio depends strongly on the relative timescales of diffusion and conformational dynamics. Ratios between two correlation decays will have a poor signal-to-noise ratio in those cases in which the average residence time of the nucleosomes in the observation volume is shorter than the relaxation time for conformational dynamics. In other words, in these cases diffusion dominates the autocorrelation decay, and the kinetic information one wishes to isolate lies at the tails of these decays, where statistics is poor. The optical setup used in our previous work16; 40 used a pinhole in the detection path that created an observation volume that limited the residence time of the nucleosomes molecules to a few ms. The noise of the GDD/GDA ratios under these optical conditions limited the timescales accessible experimentally to about 100 ms. Our attempts to measure the dynamics of nucleosome samples containing the donor at positions 57 and 69 inside the DNA using the same optical setup were unsuccessful, from which we concluded that the relevant timescales for the wrapping-unwrapping dynamics in these samples were slower than 100 ms. This dynamic range was extended into the second-timescale by removing the pinhole and aligning the setup so as to create a larger volume of observation. Note that because the mean number of molecules in the observation volume increases, the relative amplitude of the fluctuations decreases largely reducing the signal-to-noise ratio of the correlation decays. A consequence of this is that much longer acquisition times are needed to obtain decays with acceptable signal-to-noise ratios, making it particularly important that the two correlation decays are acquired simultaneously as opposed to sequentially (as it is done when most digital correlator cards are used).
The analytical expressions for the auto- and cross-correlation functions of a two-state system in equilibrium were derived in previous work,40 and can be written as:
| (2) |
where T(τ) represents the contribution of translational diffusion, τr = (k12 + k21)−1 represents the relaxation time of the reaction, k12 and k21 represent the unwrapping and rewrapping kinetic rate constants, and Cxy is a coefficient that depends on the equilibrium constant of the reaction (K= k12 / k21) and the FRET efficiencies (E) in each state:
| (3a) |
| (3b) |
Note that since the analysis of the FCS data deals with the ratio of the auto- and cross-correlation function it is not necessary to express the diffusional term analytically.
The ratio GDD/GDA can be thus written as
| (4) |
An important feature of this expression is that although the amplitude of the GDD/GDA decay depends on variables that we do not know, the characteristic time of the decay is directly the relaxation time of the reaction (τr = (k12 + k21)−1). Because nucleosomes spend most of the time in the closed conformation (k12 << k21), the relaxation time is dominated by the closing transition (i.e. (τR = k21−1)). Consequently, our method of analysis yields the rate of the wrapping reaction (k21) with much higher confidence than the equilibrium constant or the rate of the unwrapping reaction. The amplitude of the decay depends on other experimental factors such as crosstalk (i.e. donor photons that leak into the acceptor detector) and the presence of donor-only species (such as free DNA, or nucleosomes that lack the acceptor molecule). In contrast, the relaxation time is not affected by any of these experimental concerns.
Equation (4) can be manipulated to yield the relaxation time independently of the amplitude as follows:
| (5) |
| (6) |
Therefore, a logarithmic plot of eq.5 is linear at long times with a slope that equals the reciprocal of the relaxation time independently of the experimental variables included in the coefficients Cxy. In addition, this method of analysis yields a relaxation time that is not affected by the presence of partially labeled (e.g. donor-only) nucleosomes.67
>Nucleosomal DNA spontaneously unwraps from one end. >Equilibrium constant for unwrapping decreases with distance inside the nucleosome. >Proteins bind to unwrapped nucleosomal DNA. >Unwrapping of outer stretches of nucleosomal DNA occurs many times per second. >Unwrapping to sites further inside the nucleosome occurs far more slowly.
Table 1.
Unwrapping rates measured by stopped-flow FRET
| DNA construct | k12 | τ wrapped* |
|---|---|---|
| LexA 8–27 | 4.1 ± 0.2 sec−1 | 0.25 sec |
| LexA 18–37 | 0.016 ± 0.003 sec−1 | 63 sec |
| LexA 28–47 | 0.0017 ± 0.0010 sec−1 | 10 min |
τwrapped is the lifetime in the fully wrapped state, i.e., the reciprocal of the unwrapping rate k12.
Table 2.
Re-wrapping rates measured by FRET-FCS
| DNA construct | k21 | τ unwrapped* |
|---|---|---|
| Cy3–1 | 21 sec−1 | 48 msec |
| Cy3–35 | 15 sec−1 | 65 msec |
| Cy3–57 | 1.8 sec−1 | 560 msec |
| Cy3–69 | 1.4 sec−1 | 740 msec |
τunwrapped is the lifetime in the unwrapped state, i.e., the reciprocal of the re-wrapping rate k21.
Acknowledgements
We thank Michael Poirier for help with data analysis, Daniel Grilley and Georgette Moyle for help with preliminary FCS experiments, the Keck Biophysics Facility and Biological Imaging Facility at Northwestern University for the use of instruments, and members of the Widom lab for discussions. J.W. acknowledges research support from the NIH and a Morris Belkin Visiting Professorship at the Weizmann Institute of Science. H.S.T. acknowledges support from an NIH Cell and Molecular Basis of Disease Training Grant; M.L. acknowledges use of the Ultrafast Laser Spectroscopy and Imaging Facility at Arizona State University, and support from NSF CAREER grant NSF-PHY-0644414.
Footnotes
Publisher's Disclaimer: This is a PDF file of an unedited manuscript that has been accepted for publication. As a service to our customers we are providing this early version of the manuscript. The manuscript will undergo copyediting, typesetting, and review of the resulting proof before it is published in its final citable form. Please note that during the production process errors may be discovered which could affect the content, and all legal disclaimers that apply to the journal pertain.
References
- 1.Richmond TJ, Davey CA. The structure of DNA in the nucleosome core. Nature. 2003;423:145–50. doi: 10.1038/nature01595. [DOI] [PubMed] [Google Scholar]
- 2.Clapier C, Cairns B. The Biology of Chromatin Remodeling Complexes. Annu. Rev. Biochem. 2009 doi: 10.1146/annurev.biochem.77.062706.153223. [DOI] [PubMed] [Google Scholar]
- 3.Ng HH, Robert F, Young RA, Struhl K. Genome-wide location and regulated recruitment of the RSC nucleosome-remodeling complex. Genes & Development. 2002;16:806–19. doi: 10.1101/gad.978902. [DOI] [PMC free article] [PubMed] [Google Scholar]
- 4.Hartley PD, Madhani HD. Mechanisms that specify promoter nucleosome location and identity. Cell. 2009;137:445–58. doi: 10.1016/j.cell.2009.02.043. [DOI] [PMC free article] [PubMed] [Google Scholar]
- 5.Badis G, Chan ET, van Bakel H, Pena-Castillo L, Tillo D, Tsui K, Carlson CD, Gossett AJ, Hasinoff MJ, Warren CL, Gebbia M, Talukder S, Yang A, Mnaimneh S, Terterov D, Coburn D, Li Yeo A, Yeo ZX, Clarke ND, Lieb JD, Ansari AZ, Nislow C, Hughes TR. A library of yeast transcription factor motifs reveals a widespread function for Rsc3 in targeting nucleosome exclusion at promoters. Molecular Cell. 2008;32:878–87. doi: 10.1016/j.molcel.2008.11.020. [DOI] [PMC free article] [PubMed] [Google Scholar]
- 6.Lee W, Tillo D, Bray N, Morse RH, Davis RW, Hughes TR, Nislow C. A high-resolution atlas of nucleosome occupancy in yeast. Nat Genet. 2007;39:1235–44. doi: 10.1038/ng2117. [DOI] [PubMed] [Google Scholar]
- 7.Field Y, Kaplan N, Fondufe-Mittendorf Y, Moore IK, Sharon E, Lubling Y, Widom J, Segal E. Distinct modes of regulation by chromatin encoded through nucleosome positioning signals. PLoS Comput Biol. 2008;4:e1000216. doi: 10.1371/journal.pcbi.1000216. [DOI] [PMC free article] [PubMed] [Google Scholar]
- 8.Mavrich TN, Ioshikhes IP, Venters BJ, Jiang C, Tomsho LP, Qi J, Schuster SC, Albert I, Pugh BF. A barrier nucleosome model for statistical positioning of nucleosomes throughout the yeast genome. Genome Research. 2008;18:1073–83. doi: 10.1101/gr.078261.108. [DOI] [PMC free article] [PubMed] [Google Scholar]
- 9.Kaplan N, Moore IK, Fondufe-Mittendorf Y, Gossett AJ, Tillo D, Field Y, Leproust EM, Hughes TR, Lieb JD, Widom J, Segal E. The DNA-encoded nucleosome organization of a eukaryotic genome. Nature. 2009;458:362–6. doi: 10.1038/nature07667. [DOI] [PMC free article] [PubMed] [Google Scholar]
- 10.Floer M, Wang X, Prabhu V, Berrozpe G, Narayan S, Spagna D, Alvarez D, Kendall J, Krasnitz A, Stepansky A, Hicks J, Bryant GO, Ptashne M. A RSC/nucleosome complex determines chromatin architecture and facilitates activator binding. Cell. 2010;141:407–18. doi: 10.1016/j.cell.2010.03.048. [DOI] [PMC free article] [PubMed] [Google Scholar]
- 11.Clegg RM. Fluorescence resonance energy transfer and nucleic acids. Meth Enzymol. 1992;211:353–88. doi: 10.1016/0076-6879(92)11020-j. [DOI] [PubMed] [Google Scholar]
- 12.Li G, Widom J. Nucleosomes facilitate their own invasion. Nat Struct Mol Biol. 2004;11:763–9. doi: 10.1038/nsmb801. [DOI] [PubMed] [Google Scholar]
- 13.Anderson JD, Thåström A, Widom J. Spontaneous access of proteins to buried nucleosomal DNA target sites occurs via a mechanism that is distinct from nucleosome translocation. Molecular and Cellular Biology. 2002;22:7147–57. doi: 10.1128/MCB.22.20.7147-7157.2002. [DOI] [PMC free article] [PubMed] [Google Scholar]
- 14.Polach KJ, Widom J. Mechanism of protein access to specific DNA sequences in chromatin: a dynamic equilibrium model for gene regulation. Journal of Molecular Biology. 1995;254:130–49. doi: 10.1006/jmbi.1995.0606. [DOI] [PubMed] [Google Scholar]
- 15.Koopmans WJA, Buning R, Schmidt T, van Noort J. spFRET using alternating excitation and FCS reveals progressive DNA unwrapping in nucleosomes. Biophysical Journal. 2009;97:195–204. doi: 10.1016/j.bpj.2009.04.030. [DOI] [PMC free article] [PubMed] [Google Scholar]
- 16.Li G, Levitus M, Bustamante C, Widom J. Rapid spontaneous accessibility of nucleosomal DNA. Nat Struct Mol Biol. 2005;12:46–53. doi: 10.1038/nsmb869. [DOI] [PubMed] [Google Scholar]
- 17.Gansen A, Valeri A, Hauger F, Felekyan S, Kalinin S, Tóth K, Langowski J, Seidel C. Nucleosome disassembly intermediates characterized by single-molecule FRET. Proc Natl Acad Sci USA. 2009 doi: 10.1073/pnas.0903005106. [DOI] [PMC free article] [PubMed] [Google Scholar]
- 18.Poirier M, Oh E, Tims H, Widom J. Dynamics and function of compact nucleosome arrays. Nat Struct Mol Biol. 2009 doi: 10.1038/nsmb.1650. [DOI] [PMC free article] [PubMed] [Google Scholar]
- 19.Poirier MG, Bussiek M, Langowski J, Widom J. Spontaneous access to DNA target sites in folded chromatin fibers. Journal of Molecular Biology. 2008;379:772–86. doi: 10.1016/j.jmb.2008.04.025. [DOI] [PMC free article] [PubMed] [Google Scholar]
- 20.Anderson JD, Widom J. Sequence and position-dependence of the equilibrium accessibility of nucleosomal DNA target sites. Journal of Molecular Biology. 2000;296:979–87. doi: 10.1006/jmbi.2000.3531. [DOI] [PubMed] [Google Scholar]
- 21.Hodges C, Bintu L, Lubkowska L, Kashlev M, Bustamante C. Nucleosomal fluctuations govern the transcription dynamics of RNA polymerase II. Science. 2009;325:626–8. doi: 10.1126/science.1172926. [DOI] [PMC free article] [PubMed] [Google Scholar]
- 22.Protacio RU, Polach KJ, Widom J. Coupled-enzymatic assays for the rate and mechanism of DNA site exposure in a nucleosome. Journal of Molecular Biology. 1997;274:708–21. doi: 10.1006/jmbi.1997.1440. [DOI] [PubMed] [Google Scholar]
- 23.Protacio RU, Widom J. Nucleosome transcription studied in a real-time synchronous system: test of the lexosome model and direct measurement of effects due to histone octamer. Journal of Molecular Biology. 1996;256:458–72. doi: 10.1006/jmbi.1996.0101. [DOI] [PubMed] [Google Scholar]
- 24.Bucceri A, Kapitza K, Thoma F. Rapid accessibility of nucleosomal DNA in yeast on a second time scale. EMBO J. 2006;25:3123–32. doi: 10.1038/sj.emboj.7601196. [DOI] [PMC free article] [PubMed] [Google Scholar]
- 25.Bernstein BE, Liu CL, Humphrey EL, Perlstein EO, Schreiber SL. Global nucleosome occupancy in yeast. Genome Biol. 2004;5:R62. doi: 10.1186/gb-2004-5-9-r62. [DOI] [PMC free article] [PubMed] [Google Scholar]
- 26.Tirosh I, Barkai N. Two strategies for gene regulation by promoter nucleosomes. Genome Research. 2008;18:1084–91. doi: 10.1101/gr.076059.108. [DOI] [PMC free article] [PubMed] [Google Scholar]
- 27.Adams CC, Workman JL. Binding of disparate transcriptional activators to nucleosomal DNA is inherently cooperative. Molecular and Cellular Biology. 1995;15:1405–21. doi: 10.1128/mcb.15.3.1405. [DOI] [PMC free article] [PubMed] [Google Scholar]
- 28.Polach KJ, Widom J. A model for the cooperative binding of eukaryotic regulatory proteins to nucleosomal target sites. Journal of Molecular Biology. 1996;258:800–12. doi: 10.1006/jmbi.1996.0288. [DOI] [PubMed] [Google Scholar]
- 29.Miller JA, Widom J. Collaborative competition mechanism for gene activation in vivo. Molecular and Cellular Biology. 2003;23:1623–32. doi: 10.1128/MCB.23.5.1623-1632.2003. [DOI] [PMC free article] [PubMed] [Google Scholar]
- 30.Vashee S, Willie J, Kodadek T. Synergistic activation of transcription by physiologically unrelated transcription factors through cooperative DNA-binding. Biochem Biophys Res Commun. 1998;247:530–5. doi: 10.1006/bbrc.1998.8820. [DOI] [PubMed] [Google Scholar]
- 31.Kelbauskas L, Sun J, Woodbury N, Lohr D. Nucleosomal stability and dynamics vary significantly when viewed by internal versus terminal labels. Biochemistry. 2008;47:9627–35. doi: 10.1021/bi8000775. [DOI] [PubMed] [Google Scholar]
- 32.Tomschik M, van Holde K, Zlatanova J. Nucleosome dynamics as studied by single-pair fluorescence resonance energy transfer: a reevaluation. Journal of Fluorescence. 2009;19:53–62. doi: 10.1007/s10895-008-0379-1. [DOI] [PubMed] [Google Scholar]
- 33.Tomschik M, Zheng H, van Holde K, Zlatanova J, Leuba SH. Fast, long-range, reversible conformational fluctuations in nucleosomes revealed by single-pair fluorescence resonance energy transfer. Proc Natl Acad Sci USA. 2005;102:3278–83. doi: 10.1073/pnas.0500189102. [DOI] [PMC free article] [PubMed] [Google Scholar]
- 34.Koopmans WJA, Brehm A, Logie C, Schmidt T, van Noort J. Single-pair FRET microscopy reveals mononucleosome dynamics. Journal of Fluorescence. 2007;17:785–95. doi: 10.1007/s10895-007-0218-9. [DOI] [PMC free article] [PubMed] [Google Scholar]
- 35.Polach KJ, Widom J. Restriction enzymes as probes of nucleosome stability and dynamics. Meth Enzymol. 1999;304:278–98. doi: 10.1016/s0076-6879(99)04017-3. [DOI] [PubMed] [Google Scholar]
- 36.Widom J. Equilibrium and dynamic nucleosome stability. Methods Mol. Biol. 1999 doi: 10.1385/1-59259-681-9:61. [DOI] [PubMed] [Google Scholar]
- 37.Knegtel RM, Fogh RH, Ottleben G, Rüterjans H, Dumoulin P, Schnarr M, Boelens R, Kaptein R. A model for the LexA repressor DNA complex. Proteins. 1995;21:226–36. doi: 10.1002/prot.340210305. [DOI] [PubMed] [Google Scholar]
- 38.Thåström A, Bingham LM, Widom J. Nucleosomal locations of dominant DNA sequence motifs for histone-DNA interactions and nucleosome positioning. Journal of Molecular Biology. 2004;338:695–709. doi: 10.1016/j.jmb.2004.03.032. [DOI] [PubMed] [Google Scholar]
- 39.Lowary PT, Widom J. New DNA sequence rules for high affinity binding to histone octamer and sequence-directed nucleosome positioning. Journal of Molecular Biology. 1998;276:19–42. doi: 10.1006/jmbi.1997.1494. [DOI] [PubMed] [Google Scholar]
- 40.Torres T, Levitus M. Measuring conformational dynamics: a new FCS-FRET approach. J. Phys. Chem. B. 2007;111:7392–400. doi: 10.1021/jp070659s. [DOI] [PubMed] [Google Scholar]
- 41.Krichevsky O, Bonnet G. Fluorescence correlation spectroscopy: the technique and its applications. Reports on Progress in Physics. 2002 [Google Scholar]
- 42.Bonnet G, Krichevsky O, Libchaber A. Kinetics of conformational fluctuations in DNA hairpin-loops. Proc Natl Acad Sci USA. 1998;95:8602–6. doi: 10.1073/pnas.95.15.8602. [DOI] [PMC free article] [PubMed] [Google Scholar]
- 43.Hess ST, Huang S, Heikal AA, Webb WW. Biological and chemical applications of fluorescence correlation spectroscopy: a review. Biochemistry. 2002;41:697–705. doi: 10.1021/bi0118512. [DOI] [PubMed] [Google Scholar]
- 44.Thåström A, Lowary PT, Widlund HR, Cao H, Kubista M, Widom J. Sequence motifs and free energies of selected natural and non-natural nucleosome positioning DNA sequences. Journal of Molecular Biology. 1999;288:213–29. doi: 10.1006/jmbi.1999.2686. [DOI] [PubMed] [Google Scholar]
- 45.Gracey LE, Chen Z-Y, Maniar JM, Valouev A, Sidow A, Kay MA, Fire AZ. An in vitro-identified high-affinity nucleosome-positioning signal is capable of transiently positioning a nucleosome in vivo. Epigenetics Chromatin. 2010;3:13. doi: 10.1186/1756-8935-3-13. [DOI] [PMC free article] [PubMed] [Google Scholar]
- 46.Widom J. Role of DNA sequence in nucleosome stability and dynamics. Q Rev Biophys. 2001;34:269–324. doi: 10.1017/s0033583501003699. [DOI] [PubMed] [Google Scholar]
- 47.Anderson JD, Widom J. Poly(dA-dT) promoter elements increase the equilibrium accessibility of nucleosomal DNA target sites. Molecular and Cellular Biology. 2001;21:3830–9. doi: 10.1128/MCB.21.11.3830-3839.2001. [DOI] [PMC free article] [PubMed] [Google Scholar]
- 48.Brown PM, Madden CA, Fox KR. Triple-helix formation at different positions on nucleosomal DNA. Biochemistry. 1998;37:16139–51. doi: 10.1021/bi981768n. [DOI] [PubMed] [Google Scholar]
- 49.Kwon J, Imbalzano AN, Matthews A, Oettinger MA. Accessibility of nucleosomal DNA to V(D)J cleavage is modulated by RSS positioning and HMG1. Molecular Cell. 1998;2:829–39. doi: 10.1016/s1097-2765(00)80297-x. [DOI] [PubMed] [Google Scholar]
- 50.Van Holde KE. Chromatin. 1989 [Google Scholar]
- 51.Van Vugt JJFA, De Jager M, Murawska M, Brehm A, Van Noort J, Logie C. Multiple Aspects of ATP-Dependent Nucleosome Translocation by RSC and Mi-2 Are Directed by the Underlying DNA Sequence. Plos One. 2009;4:e6345. doi: 10.1371/journal.pone.0006345. [DOI] [PMC free article] [PubMed] [Google Scholar]
- 52.Racki LR, Yang JG, Naber N, Partensky PD, Acevedo A, Purcell TJ, Cooke R, Cheng Y, Narlikar GJ. The chromatin remodeller ACF acts as a dimeric motor to space nucleosomes. Nature. 2009;462:1016–21. doi: 10.1038/nature08621. [DOI] [PMC free article] [PubMed] [Google Scholar]
- 53.Blosser TR, Yang JG, Stone MD, Narlikar GJ, Zhuang X. Dynamics of nucleosome remodelling by individual ACF complexes. Nature. 2009;462:1022–7. doi: 10.1038/nature08627. [DOI] [PMC free article] [PubMed] [Google Scholar]
- 54.Möbius W, Neher RA, Gerland U. Kinetic accessibility of buried DNA sites in nucleosomes. Phys. Rev. Lett. 2006;97:208102. doi: 10.1103/PhysRevLett.97.208102. [DOI] [PubMed] [Google Scholar]
- 55.Field Y, Fondufe-Mittendorf Y, Moore I, Mieczkowski P, Kaplan N, Lubling Y, Lieb J, Widom J, Segal E. Gene expression divergence in yeast is coupled to evolution of DNA-encoded nucleosome organization. Nat Genet. 2009 doi: 10.1038/ng.324. [DOI] [PMC free article] [PubMed] [Google Scholar]
- 56.Ng HH, Ciccone DN, Morshead KB, Oettinger MA, Struhl K. Lysine-79 of histone H3 is hypomethylated at silenced loci in yeast and mammalian cells: a potential mechanism for position-effect variegation. Proc Natl Acad Sci USA. 2003;100:1820–5. doi: 10.1073/pnas.0437846100. [DOI] [PMC free article] [PubMed] [Google Scholar]
- 57.Whitehouse I, Rando OJ, Delrow J, Tsukiyama T. Chromatin remodelling at promoters suppresses antisense transcription. Nature. 2007;450:1031–5. doi: 10.1038/nature06391. [DOI] [PubMed] [Google Scholar]
- 58.Zawadzki K, Morozov A, Broach J. Chromatin-dependent Transcription Factor Accessibility Rather than Nucleosome Remodeling Predominates during Global Transcriptional Restructuring in Saccharomyces cerevisiae. Mol Biol Cell. 2009 doi: 10.1091/mbc.E09-02-0111. [DOI] [PMC free article] [PubMed] [Google Scholar]
- 59.Kim HD, O’Shea EK. A quantitative model of transcription factor-activated gene expression. Nat Struct Mol Biol. 2008;15:1192–8. doi: 10.1038/nsmb.1500. [DOI] [PMC free article] [PubMed] [Google Scholar]
- 60.Raser JM, O’Shea EK. Noise in gene expression: origins, consequences, and control. Science. 2005;309:2010–3. doi: 10.1126/science.1105891. [DOI] [PMC free article] [PubMed] [Google Scholar]
- 61.Protacio RU, Li G, Lowary PT, Widom J. Effects of histone tail domains on the rate of transcriptional elongation through a nucleosome. Molecular and Cellular Biology. 2000;20:8866–78. doi: 10.1128/mcb.20.23.8866-8878.2000. [DOI] [PMC free article] [PubMed] [Google Scholar]
- 62.Luger K, Rechsteiner TJ, Richmond TJ. Preparation of nucleosome core particle from recombinant histones. Meth Enzymol. 1999;304:3–19. doi: 10.1016/s0076-6879(99)04003-3. [DOI] [PubMed] [Google Scholar]
- 63.Tims HS, Widom J. Stopped-flow fluorescence resonance energy transfer for analysis of nucleosome dynamics. Methods. 2007;41:296–303. doi: 10.1016/j.ymeth.2007.01.001. [DOI] [PMC free article] [PubMed] [Google Scholar]
- 64.Thåström A, Lowary PT, Widom J. Measurement of histone-DNA interaction free energy in nucleosomes. Methods. 2004;33:33–44. doi: 10.1016/j.ymeth.2003.10.018. [DOI] [PubMed] [Google Scholar]
- 65.Thåström A, Gottesfeld JM, Luger K, Widom J. Histone-DNA binding free energy cannot be measured in dilution-driven dissociation experiments. Biochemistry. 2004;43:736–41. doi: 10.1021/bi0302043. [DOI] [PubMed] [Google Scholar]
- 66.Gansen A, Hauger F, Tóth K, Langowski J. Single-pair fluorescence resonance energy transfer of nucleosomes in free diffusion: optimizing stability and resolution of subpopulations. Anal Biochem. 2007;368:193–204. doi: 10.1016/j.ab.2007.04.047. [DOI] [PubMed] [Google Scholar]
- 67.Levitus M. Relaxation Kinetics by Fluorescence Correlation Spectroscopy: Determination of Kinetic Parameters in the Presence of Fluorescent Impurities. J Phys Chem Lett. 2010;1:1346–1350. doi: 10.1021/jz100231v. [DOI] [PMC free article] [PubMed] [Google Scholar]


