Abstract
Objectives
GLUT-1 has been found to have an important role in the upregulation of various cellular pathways and implicated in neoplastic transformation correlating with biological behavior in malignancies. However, literature regarding the significance of GLUT-1 expression in pancreatic neoplasia has been limited and controversial.
Methods
Immunohistochemical expression of GLUT-1 was tested in a variety of pancreatic neoplasia including ductal adenocarcinomas (DAs), pancreatic intraepithelial neoplasms (PanINs), intraductal papillary mucinous neoplasms (IPMNs), and serous cystadenomas.
Results
There was a progressive increase in the expression of GLUT-1 from low- to higher-grade dysplastic lesions: All higher-grade PanINs/IPMNs (the ones with moderate/high-grade dysplasia) revealed noticeable GLUT-1 expression. Among the 94 DAs analyzed, there were minimal/moderate expression in 46 and significant expression in 24 DAs. However, all 4 clear-cell variants of DAs revealed significant GLUT-1 immunolabeling, as did areas of clear-cell change seen in other DAs. Moreover, all 12 serous cystadenomas expressed significant GLUT-1.
GLUT-1 expression was also directly correlated with DA histological grade (P = 0.016) and tumor size (P = 0.03).
Conclusions
GLUT-1 may give rise to the distinctive clear-cell appearance of these tumors by inducing the accumulation of glycogen in the cytoplasm. Additionally, because GLUT-1 expression was related to histological grade and tumor size of DA, further studies are warranted to investigate the association of GLUT-1 with prognosis and tumor progression.
Keywords: GLUT-1, HIF-1α, pancreas, clear cell, mucinous, serous
A family of glucose transporter isoforms (GLUT), which is currently composed of 13 members, facilitates the entry of glucose into cells.1 These are passive carriers and function as an energy-independent system that transports glucose down a concentration gradient.2
GLUT-1, a member of this family, is a basic high-affinity glucose transporter normally expressed in erythrocytes, endothelial cells, the perineurium of peripheral nerves, germinal centers of reactive lymph nodes, renal tubules, and placenta.2,3 It is also considered to be the predominantly upregulated glucose transporter in malignant epithelial tissues as well as in malignant mesothelium4 and has been found to correlate with biological behavior in various malignancies.5–10 An increased GLUT-1 expression has also proved to be associated with pancreatic cancer invasiveness.11 Thus, it may be a good target for therapeutics in pancreatic cancer.1
The aim of this study was to determine the expression pattern of GLUT-1 in pancreatic neoplasia and whether it is correlated with known prognostic parameters of pancreatic ductal adenocarcinomas (DAs) including histological grade, tumor size, lymph node status, and margin status or with survival.
MATERIALS AND METHODS
Cases
Immunohistochemical expression of GLUT-1 was tested in 94 cases of ordinary DA (pancreatobiliary-type adenocarcinoma) of the pancreas, which were identified from the files of Wayne State University and Karmanos Cancer Institute. One representative tissue block from each case was used for constructing tissue microarray blocks. Each case was sampled in triplicate.
The expression was also tested in normal pancreas, which was examined in resected tissue adjacent to the DAs, as well as in 44 pancreatic intraepithelial neoplasms (PanINs; 10 PanIN 1As, 14 PanIN 1Bs, 12 PanIN 2s, and 8 PanIN 3s; all of which were sampled specifically away from the tumor in the pancreas), 13 intraductal papillary mucinous neoplasms (IPMNs; 6 gastric type [all with low-grade dysplasia], 4 pancreatobiliary type [all with high-grade dysplasia], 2 intestinal type [both with moderate dysplasia], and 1 mixed gastric/pancreatobiliary type [with moderate dysplasia]), and 12 microcystic serous adenomas from the same files. Demographic data were obtained from the pathology reports, patient’s charts, and clinical databases.
Staging
According to the American Joint Committee on Cancer guidelines (2010),12 stage IV tumors are unresectable, and stages I and II tumors are resectable (stage III tumors are potentially resectable [resectable only in some centers]). The main clinical parameters, which have been shown to have prognostic relevance in the substratification of the resectable category, are tumor size (≤2 vs >2 cm) and lymph node status. Therefore, these 2 parameters, along with the adequacy of the resection (margin status), were incorporated into the multivariate analysis to determine the prognostic value of GLUT-1.
Histological Grading
The DAs were graded according to the recently proposed scheme.13 Briefly, well-formed tubular units with complete, easily discernible borders were regarded as grade 1. Those with incomplete, ill-defined borders, fusion of glands, or irregular multilumina formation (cribriform architecture) were classified as grade 2. Nonglandular patterns including cordlike areas, individual cell infiltration, and nested or solid (sheet-like) growth patterns were categorized as grade 3.
GLUT-1 Immunolabeling
Tissue sections were deparaffinized in xylene and rehydrated in graded ethanol. The sections then were washed with phosphate-buffered saline (PBS), blocked with 5% goat serum in PBS for 30 minutes, and incubated for 2 hours at 25°C with the primary antiserum at 1:500 dilution in PBS/1% bovine serum albumin/0.05% sodium azide. After washing in PBS, slides were incubated with biotinylated goat anti–rabbit immunoglobulin G (1:200 at 25°C for 30 minutes), after which endogenous peroxidase was blocked with 0.3% hydrogen peroxide in PBS (15 minutes). Bound antibody was detected by routine avidin-biotin-peroxidase immunohistochemistry using the supplier’s protocol (LSAB kit; DAKO, Carpinteria, Calif ). Primary polyclonal rabbit anti–human GLUT-1 (DAKO) was applied to the slides at a dilution of 1:200 and then incubated in a moist chamber for 2 hours at room temperature. The excess of antibody was washed out, and the localization of antibody was visualized by incubating the sections with 3,3′-diaminobenzidine tetrahydrochloride (Research Genetics, Huntsville, Ala). Specificity of GLUT-1 staining was confirmed routinely in all cases by staining of parallel tissue sections with GLUT-1 antiserum that had been preincubated with the immunizing peptide (25 mg/mL for 1 hour at 25°C). GLUT-1 immunostaining was blocked by this peptide competition in all cases. Positive control for GLUT-1 was red blood cells present in each section.
Immunohistochemical Scoring
An established scoring system that evaluates both the extent and intensity was utilized. Briefly, the extent was scored as the percentage of the cells that showed cytoplasmic and/or membranous staining: 0 = less than 1%, 1+ = 1% to 10 %, 2+ = 11% to 50%, 3+ = 51% to 80%, and 4+ = more than 80%. The intensity was arbitrarily scored as 1 = weak, 2 = moderate, and 3 = strong. Scoring was performed by consensus of 2 observers without prior knowledge of the clinical follow-up data for each case. The overall score is then calculated as (1 + intensity/3) × extent, and for comparative analysis, the data were arbitrarily divided into 4 groups: 0 = none, 1 = minimal, 2 = moderate, and 3 = significant.
Statistical Analysis
All statistical tests were performed using the MedCalc data analysis program. Data were analyzed using a χ2 test and Fisher exact test to compare the expression of GLUT-1 protein with histological grade, tumor size, lymph node status, and margin status. Overall survival data were analyzed by using the Kaplan-Meier method and were assessed by log-rank test to compare differences in survival between the patients whose tumors expressed GLUT-1 staining and those whose tumors did not express GLUT-1. By using the Cox proportional hazards regression, multivariate analysis was performed on GLUT-1 protein expression, histological grade, tumor size, lymph node status, and margin status in patients with DA. P < 0.05 was regarded as statistically significant.
RESULTS
GLUT-1 in Normal Pancreas and Noninvasive Ductal Lesions
GLUT-1 was expressed in the islets in addition to the perineurial cells, endothelial cells, and red blood cells but not in the acini or ducts in normal pancreas.
There was a progressive increase in the expression of GLUT-1 from low-grade to higher-grade dysplastic lesions:
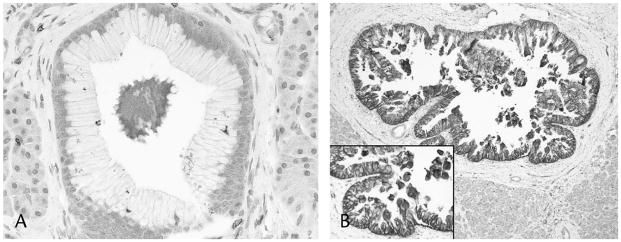
All 10/10 PanIN 1As were virtually negative, and 14/14 PanIN 1Bs expressed only very limited subnuclear GLUT-1 immunolabeling; however, all higher-grade PanIN lesions (12/12 PanIN 2s and 8/8 PanIN 3s) revealed noticeable cytoplasmic and membranous GLUT-1 expression, which was significant in 5/8 PanIN 3s (Figs. 1A and B).
Similarly, whereas low-grade dysplastic examples of IPMNs were generally negative or expressed only very limited sub-nuclear GLUT-1 immunolabeling (6/6 gastric type IPMNs, and 1/2 intestinal-type IPMNs), those with moderate- or high-grade dysplasia revealed higher expression levels: the immunolabeling was moderate in 1 of 2 intestinal-type IPMNs and significant in 4 of 4 pancreatobiliary-type IPMNs (Fig. 2) The only mixed case was negative.
FIGURE 1.
Low-grade PanINs (PanIN 1A and 1B) showed only limited subnuclear GLUT-1 immunolabeling (A); however, higher-grade PanINs (PanIN 2 and PanIN 3) revealed mostly significant (score 3) cytoplasmic and membranous GLUT-1 expression (B).
FIGURE 2.
All pancreatobiliary type IPMNs (4/4) revealed significant (score 3) cytoplasmic and membranous GLUT-1 expression.
GLUT-1 in DA
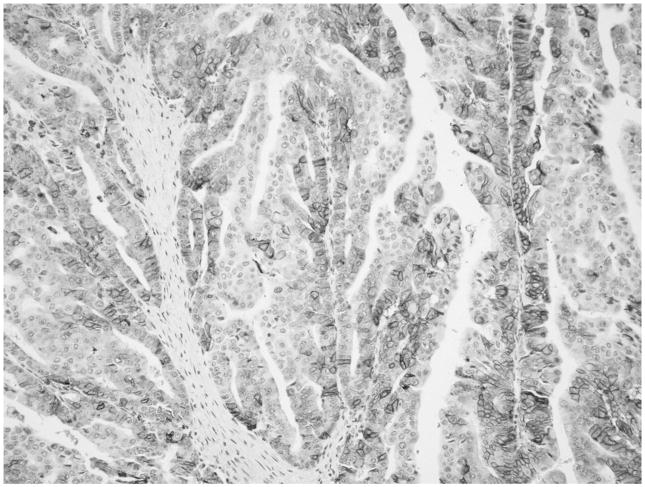
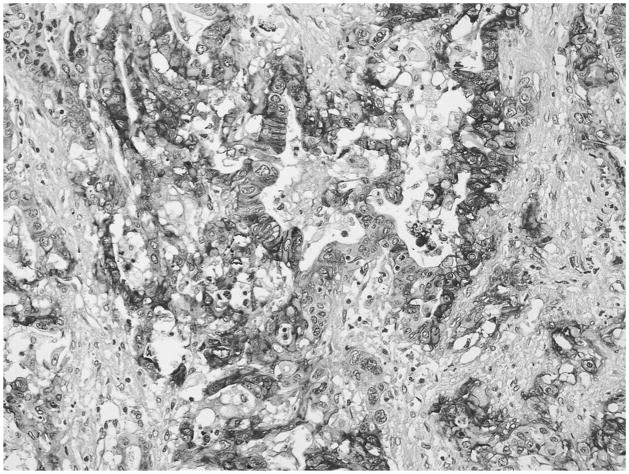
GLUT-1 expression was detected in 70 DA cases (74%). Of these, 31 (33%) showed minimal, 15 (16%) moderate, and 24 (25.5%) significant cytoplasmic and membranous immunolabeling (Fig. 3). Also, all 4 cases (100%) of clear-cell variant of DA revealed significant cytoplasmic and membranous expression, as did areas of clear-cell change seen in other DAs (Fig. 4).
FIGURE 3.
One quarter of DA cases showed significant (score 3) cytoplasmic and membranous GLUT-1 immunolabeling.
FIGURE 4.
Diffuse and strong expression of GLUT1 was seen in all 4 cases of clear-cell variant of DA.
GLUT-1 and Histological Grade
There was a progressive increase in GLUT-1 expression by grade. Significant expression of GLUT-1 was detected in 5 (15%) of 33 grade 1 tumors, in 6 (19%) of 32 grade 2, and in 13 (45%) of 29 grade 3 tumors. The difference between 3 groups was statistically significant (P = 0.016).
GLUT-1 and Staging Parameters
Size of the tumor information was available in 90 cases (Table 1). Average size of the tumors was 3.56 cm (range, 0.8–10 cm). There was a progressive increase in GLUT-1 expression by tumor size: 18 patients had lesions that measured 2.0 cm or less. Of these, only 3 (17%) had significant (score 3) GLUT-1 expression. Seventy-two patients had lesions that measured greater than 2.0 cm. Of these, 20 (28%) had significant (score 3) GLUT-1 expression. The difference between 2 groups was statistically significant (P = 0.03).
TABLE 1.
GLUT-1 Expression and Prognostic Parameters of DA
| No. All Cases | No. (%) GLUT-1 (+) Cases | P | |
|---|---|---|---|
| Histological grade | |||
| 1 | 33 | 5 (15) | |
| 2 | 32 | 6 (19) | 0.016 |
| 3 | 29 | 13 (45) | |
| Tumor size,* cm | |||
| ≤2.0 | 18 | 3 (17) | 0.03 |
| >2.0 | 72 | 20 (28) | |
| Node status† | |||
| Negative | 25 | 7 (28) | 0.35 |
| Positive | 66 | 17 (26) | |
| Stage | |||
| IA | 4 | 2 (50) | 0.79 |
| IB | 14 | 11 (79) | |
| IIA | 3 | 2 (67) | |
| IIB | 42 | 31 (74) | |
| III | 27 | 19 (70) | |
| IV | 2 | 1 (50) | |
| Margin status† | |||
| Negative | 56 | 14 (25) | 0.69 |
| Positive | 35 | 10 (28.5) | |
| K-ras mutations | |||
| Present | 16 | 4 (25) | N/A |
| Absent | 4 | 0 (0) | |
Tumor size information had not been properly documented in 4 cases.
Lymph node and margin status information had not been properly documented in 3 cases.
Lymph node status information was available in 91 cases. Twenty-five cases had negative lymph nodes, and GLUT-1 expression was significant (score 3) in 7 (28%). Sixty-six patients had positive lymph node(s), and GLUT-1 expression was significant (score 3) in 17 (26%). There was no statistical difference between the groups (P = 0.35). Also, of the 24 cases that did not express GLUT-1, 15 (62.5%) had positive lymph node(s) and of the 70 cases that expressed GLUT-1; 51 (73%) had positive lymph node(s). The difference between the groups was still not statistically significant (P = 0.20).
Stage information was available in 92 cases. GLUT-1 expression was significant (score 3) in 6 (33%) of 18 stage I tumors (4 stage IA and 14 stage IB), 14 (31%) of 45 stage II tumors (3 stage IIA and 42 stage IIB), and 4 (15%) of 27 stage III tumors. None of the stage IV tumors (autopsy cases, 0/2) expressed significant (score 3) GLUT-1. The difference between the groups was not statistically significant (P = 0.79).
Margin status information was available in 91 cases. Fifty-six patients had negative margins, and 14 (25%) of these had significant (score 3) GLUT-1 expression. Thirty-five patients had positive margin(s), and 10 (28.5%) of these showed significant (score 3) GLUT-1 expression. There was no statistical difference between the groups (P = 0.69). Also, of the 24 cases that did not express GLUT-1, 11 (46%) had positive margin(s), and of the 70 cases that expressed GLUT-1, 24 (34%) had positive margin(s). The difference between the groups was still not statistically significant (P = 0.38).
GLUT-1 and Survival
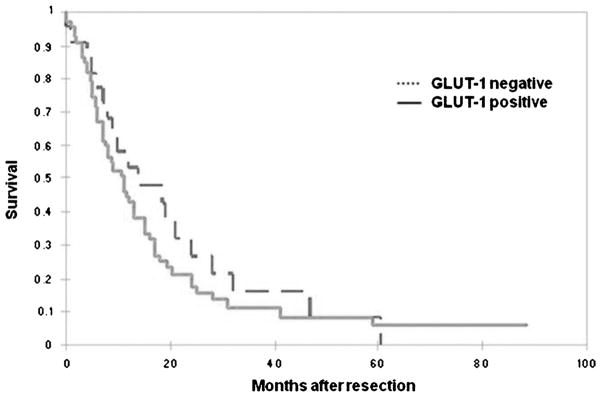
The overall survival rate for patients with DA was in accordance with what is reported in the literature for resectable cases, with a median of 11 months (Table 2). Although the median survival of the cases that did not express GLUT-1 (12 months) was higher than that of the cases that expressed GLUT-1 (10.5 months), when Kaplan-Meier survival curves were analyzed, there was no statistical difference between patients who did not express GLUT-1 and those who expressed GLUT-1 (P = 0.35) (Fig. 5). Similarly there was no statistical difference between the median survival of the patients that expressed minimal, moderate, or significant GLUT-1 (7, 16, and 11 months, respectively). In a Cox proportional hazards regression model incorporating GLUT-1, histological grade, tumor size, lymph node status, and margin status; although tumor size (P = 0.0007) and lymph node status (P = 0.02) were independent prognostic markers, GLUT-1 expression was not statistically significant (P = 0.83).
TABLE 2.
Cox Proportional Hazards Regression
| Covariate | b | SE | P | Exp(b) | 95% Confidence Interval of Exp(b) |
|---|---|---|---|---|---|
| Histological grade | 0.0964 | 0.1537 | 0.5304 | 1.1013 | 0.8160–1.4862 |
| Tumor size | 0.2732 | 0.0805 | 0.0007 | 1.3142 | 1.1233–1.5376 |
| Node status | 0.6782 | 0.2906 | 0.0196 | 1.9704 | 1.1180–3.4725 |
| Margin status | 0.0088 | 0.2534 | 0.9723 | 1.0089 | 0.6155–1.6535 |
| GLUT-1 | −0.0215 | 0.1058 | 0.8392 | 0.9788 | 0.7963–1.2030 |
FIGURE 5.
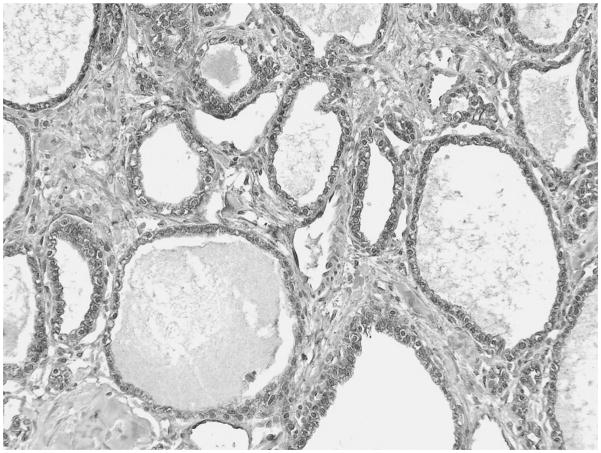
All SCAs (12/12) expressed significant (score 3) cytoplasmic and membranous GLUT 1 immunolabeling.
GLUT-1 and K-ras Mutations
K-ras mutation analysis, performed by polymerase chain reaction method, was available for 20 DA patients. Of the 16 patients with K-ras mutations, 4 (25%) showed significant (score 3) GLUT-1 positivity, whereas none of the patients without K-ras mutations showed GLUT-1 positivity. However, the numbers were not sufficient for statistical analysis.
The correlation between GLUT-1 expression and prognostic parameters and survival of DA is summarized in Tables 1 and 2.
GLUT-1 in Serous Cystadenoma
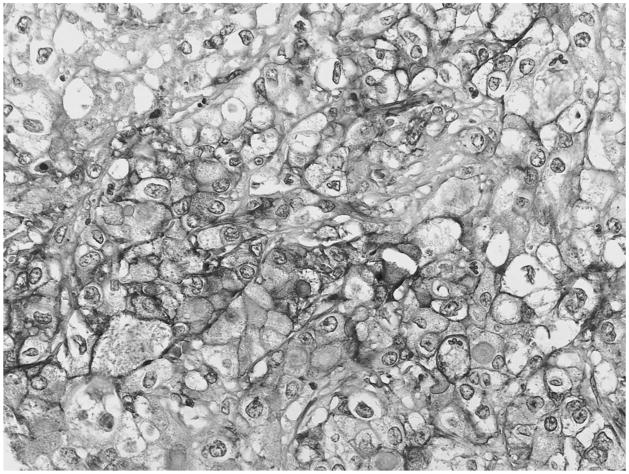
All serous cystadenomas (SCAs), also named glycogen-rich adenoma because of the abundance of intracytoplasmic glycogen in the tumor cells, revealed notable cytoplasmic and membranous GLUT-1 expression, which was significant in 9 of 12, and moderate in 3 of 12 (Fig. 6).
FIGURE 6.
Kaplan-Meier survival analysis showed no statistical difference between patients with GLUT-1 expression and those without GLUT-1 expression (P = 0.35).
DISCUSSION
Various studies have shown a close relationship between GLUT-1 (and/or GLUT-3) expression and tumor aggressiveness and poor prognosis in squamous cell carcinoma of the head and neck and in carcinomas of the lung, stomach, gallbladder, colorectum, kidney, bladder, breast, ovary, and cervix.9,10,14–18 There is also emerging evidence that GLUT-1 may be a marker of malignant transformation in certain cell types, for example, mesothelial cells, because it expressed in most malignant mesotheliomas but not in benign reactive mesothelial lesions.4
An increased GLUT-1 expression has also proved to be associated with pancreatic cancer invasiveness both in vitro and in vivo.11 Moreover, a higher fluorine 18 fluorodeoxyglucose (18F-FDG) uptake rate, quantified by positron emission tomography (PET) and determined as standardized uptake value, has been found to correlate with a greater immunohistochemical expression of GLUT-1 in tumor cells than in normal pancreatic tissue.19–22 18F-FDG–PET has also been found be useful in discriminating between benign and malignant IPMNs,23 and recently, a direct relationship between 18F-FDG–PET positivity and GLUT-1 expression in malignant pancreatic IPMNs has been reported.24 Thus, increased expression of GLUT-1 molecules in human pancreatic tumors has been suggested to contribute to the higher rate of 18F-FDG uptake into tumor cells compared with normal pancreatic tissue.20 Also, standardized uptake value has been found to be a predictor of survival in patients with pancreatic DA.25–27 Therefore, in addition to being of diagnostic value imaging-wise, GLUT-1 may also be a potential therapeutic target to limit glucose uptake and metabolism, thereby limiting the proliferative potential of malignant cells.
However, literature regarding the biologic significance of GLUT-1 expression in pancreatic neoplasia has been limited and controversial. Most of the published studies have focused on invasive DAs, and some reported correlation with poor clinical outcome,28,29 whereas others have failed to identify any prognostic significance.30 In our study involving 94 DAs, the median survival of the cases that did not express GLUT-1 was higher (12 months) than that of the cases that expressed GLUT-1 (10.5 months); however, the difference did not reach statistical significance. Also, GLUT-1 expression did correlate with established markers of tumor aggressiveness including tumor size and histological grade, which indicates a higher glucose uptake in poorly differentiated pancreatic cancer cells.
In this study, we also analyzed GLUT-1 expression in preinvasive lesions and have found that it correlated with the pancreatic carcinogenesis progression model. GLUT-1 immunolabeling was negative or, at best, was confined to subnuclear region of the cells in low-grade dysplastic processes (24/24 PanIN-1 lesions, 6/6 low-grade IPMNs), whereas the expression increased significantly in moderate- to high-grade lesions (5/7 IPMNs). This suggests that GLUT-1 is one of the genes induced in the development of DA and represents a potential therapeutic target for strategies designed to inhibit the progression of pancreatic cancer. Not surprisingly, apigenin, a flavonoid with significant antiproliferative properties that inhibit pancreatic cancer cell proliferation,31,32 has been shown to inhibit glucose uptake as well as both GLUT-1 mRNA and protein expression in human pancreatic cancer cell lines.30
This increased expression of GLUT-1 by carcinogenetic progression should not be surprising because it has been demonstrated previously in animal models that transformation of rodent fibroblasts by Fujiyama sarcoma virus or the ras or src oncogenes results in a marked increase in glucose uptake, which is accompanied by an increase in GLUT-1 mRNA and protein expression.33,34 K-ras mutations are present in 70% of DA.35,36 Data for K-ras mutation analysis were available for 20 patients in our study. Twenty-five percent of the patients with K-ras mutations had strong GLUT-1 expression compared with none of the 4 patients with no mutations. Although these numbers are not sufficient for a definite conclusion; it would be interesting to see if the ras pathway is involved in the up-regulation of GLUT-1 in these neoplasms.
Another interesting finding of our study was that there was significant (score 3) GLUT-1 expression in all clear-cell DAs, in areas of clear-cell change seen in other DAs as well as in SCAs, also characterized by clear cells.37 Recently, our group reported that GLUT-1 and hypoxia-inducible factor 1α (HIF-1α) were consistently expressed in SCAs.38 Clear-cell tumors of the other organs, such as renal cell carcinoma, have been reported to be positive for these markers as well.14 It has been known that the von Hippel–Lindau (vHL) tumor suppressor gene product is required for the degradation of HIF-1α protein by the ubiquitin/proteosome pathway.39,40 In the absence of functional pvHL, which often is the case in these tumors, HIF-1α wrongly starts the angiogenic response to hypoxia by transcribing several oxygen-regulated factors including GLUT-1.41,42 All of these suggest that GLUT-1 also might be one of the major pathways involved in the pathogenesis of these clear-cell lesions,11,43,44 and targeting this pathway for development of therapeutic modalities is thus a viable option.
In conclusion, GLUT-1 seems to be playing a role in pancreatic tumorigenesis as well as in clear-cell pathogenesis. As such, it seems to be a good diagnostic and perhaps even a prognostic marker. It may also serve as a potential target in the management of pancreatic neoplasia, which warrants further investigation.
Acknowledgments
The authors thank Barbara L. Pruetz for providing her expertise in immunohistochemical staining.
This study was supported in part by the National Cancer Institute Specialized Program in Research Excellence CA101936 in Pancreas Cancer (PAR-02-068) and in part by the Georgia Cancer Coalition Distinguished Cancer Clinicians and Scientists Program.
Footnotes
This study was presented in part at the annual meeting of the United States and Canadian Academy of Pathology in Atlanta, GA, February 2006.
References
- 1.Macheda ML, Rogers S, Best JD. Molecular and cellular regulation of glucose transporter (GLUT) proteins in cancer. J Cell Physiol. 2005;202(3):654–662. doi: 10.1002/jcp.20166. [DOI] [PubMed] [Google Scholar]
- 2.Cornford EM, Hyman S, Swartz BE. The human brain GLUT1 glucose transporter: ultrastructural localization to the blood-brain barrier endothelia. J Cereb Blood Flow Metab. 1994;14(1):106–112. doi: 10.1038/jcbfm.1994.15. [DOI] [PubMed] [Google Scholar]
- 3.Kayano T, Burant CF, Fukumoto H, et al. Human facilitative glucose transporters. Isolation, functional characterization, and gene localization of cDNAs encoding an isoform (GLUT5) expressed in small intestine, kidney, muscle, and adipose tissue and an unusual glucose transporter pseudogene-like sequence (GLUT6) J Biol Chem. 1990;265(22):13276–13282. [PubMed] [Google Scholar]
- 4.Kato Y, Tsuta K, Seki K, et al. Immunohistochemical detection of GLUT-1 can discriminate between reactive mesothelium and malignant mesothelioma. Mod Pathol. 2007;20(2):215–220. doi: 10.1038/modpathol.3800732. [DOI] [PubMed] [Google Scholar]
- 5.Kawamura T, Kusakabe T, Sugino T, et al. Expression of glucose transporter-1 in human gastric carcinoma: association with tumor aggressiveness, metastasis, and patient survival. Cancer. 2001;92(3):634–641. doi: 10.1002/1097-0142(20010801)92:3<634::aid-cncr1364>3.0.co;2-x. [DOI] [PubMed] [Google Scholar]
- 6.Noguchi Y, Marat D, Saito A, et al. Expression of facilitative glucose transporters in gastric tumors. Hepatogastroenterology. 1999;46(28):2683–2689. [PubMed] [Google Scholar]
- 7.Yamamoto T, Seino Y, Fukumoto H, et al. Overexpression of facilitative glucose transporter genes in human cancer. Biochem Biophys Res Commun. 1990;170(1):223–230. doi: 10.1016/0006-291x(90)91263-r. [DOI] [PubMed] [Google Scholar]
- 8.Younes M, Brown RW, Mody DR, et al. GLUT1 expression in human breast carcinoma: correlation with known prognostic markers. Anticancer Res. 1995;15(6B):2895–2898. [PubMed] [Google Scholar]
- 9.Younes M, Brown RW, Stephenson M, et al. Overexpression of GLUT1 and GLUT3 in stage I nonsmall cell lung carcinoma is associated with poor survival. Cancer. 1997;80(6):1046–1051. doi: 10.1002/(sici)1097-0142(19970915)80:6<1046::aid-cncr6>3.0.co;2-7. [DOI] [PubMed] [Google Scholar]
- 10.Younes M, Juarez D, Lechago LV, et al. GLUT 1 expression in transitional cell carcinoma of the urinary bladder is associated with poor patient survival. Anticancer Res. 2001;21(1B):575–578. [PubMed] [Google Scholar]
- 11.Ito H, Duxbury M, Zinner MJ, et al. Glucose transporter-1 gene expression is associated with pancreatic cancer invasiveness and MMP-2 activity. Surgery. 2004;136(3):548–556. doi: 10.1016/j.surg.2004.05.032. [DOI] [PubMed] [Google Scholar]
- 12.Edge SB, Byrid DR, Compton CC, et al., editors. AJCC Cancer Staging Handbook. 7. New York: Springer New York, Inc; 2010. pp. 241–242. [Google Scholar]
- 13.Adsay NV, Basturk O, Bonnett M, et al. A proposal for a new and more practical grading scheme for pancreatic ductal adenocarcinoma. Am J Surg Pathol. 2005;29(6):724–733. doi: 10.1097/01.pas.0000163360.40357.f1. [DOI] [PubMed] [Google Scholar]
- 14.Reisser C, Eichhorn K, Herold-Mende C, et al. Expression of facilitative glucose transport proteins during development of squamous cell carcinomas of the head and neck. Int J Cancer. 1999;80(2):194–198. doi: 10.1002/(sici)1097-0215(19990118)80:2<194::aid-ijc6>3.0.co;2-m. [DOI] [PubMed] [Google Scholar]
- 15.Haber RS, Rathan A, Weiser KR, et al. GLUT1 glucose transporter expression in colorectal carcinoma: a marker for poor prognosis. Cancer. 1998;83(1):34–40. doi: 10.1002/(sici)1097-0142(19980701)83:1<34::aid-cncr5>3.0.co;2-e. [DOI] [PubMed] [Google Scholar]
- 16.Lidgren A, Bergh A, Grankvist K, et al. Glucose transporter-1 expression in renal cell carcinoma and its correlation with hypoxia inducible factor-1 α. BJU Int. 2008;101(4):480–484. doi: 10.1111/j.1464-410X.2007.07238.x. [DOI] [PubMed] [Google Scholar]
- 17.Airley RE, Mobasheri A. Hypoxic regulation of glucose transport, anaerobic metabolism and angiogenesis in cancer: novel pathways and targets for anticancer therapeutics. Chemotherapy. 2007;53(4):233–256. doi: 10.1159/000104457. [DOI] [PubMed] [Google Scholar]
- 18.Ozbudak IH, Shilo K, Tavora F, et al. Glucose transporter-1 in pulmonary neuroendocrine carcinomas: expression and survival analysis. Mod Pathol. 2009;22(5):633–638. doi: 10.1038/modpathol.2009.6. [DOI] [PMC free article] [PubMed] [Google Scholar]
- 19.Higashi T, Saga T, Nakamoto Y, et al. Relationship between retention index in dual-phase (18)F-FDG PET, and hexokinase-II and glucose transporter-1 expression in pancreatic cancer. J Nucl Med. 2002;43(2):173–180. [PubMed] [Google Scholar]
- 20.Higashi T, Tamaki N, Honda T, et al. Expression of glucose transporters in human pancreatic tumors compared with increased FDG accumulation in PET study. J Nucl Med. 1997;38(9):1337–1344. [PubMed] [Google Scholar]
- 21.Higashi T, Tamaki N, Torizuka T, et al. FDG uptake, GLUT-1 glucose transporter and cellularity in human pancreatic tumors. J Nucl Med. 1998;39(10):1727–1735. [PubMed] [Google Scholar]
- 22.Reske SN, Grillenberger KG, Glatting G, et al. Overexpression of glucose transporter 1 and increased FDG uptake in pancreatic carcinoma. J Nucl Med. 1997;38(9):1344–1348. [PubMed] [Google Scholar]
- 23.Sperti C, Bissoli S, Pasquali C, et al. 18-Fluorodeoxyglucose positron emission tomography enhances computed tomography diagnosis of malignant intraductal papillary mucinous neoplasms of the pancreas. Ann Surg. 2007;246(6):932–937. doi: 10.1097/SLA.0b013e31815c2a29. [DOI] [PubMed] [Google Scholar]
- 24.Fassan M, Pizzi S, Sperti C, et al. 18F-FDG PET findings and GLUT-1 expression in IPMNs of the pancreas. J Nucl Med. 2008;49(12):2070. doi: 10.2967/jnumed.108.054924. [DOI] [PubMed] [Google Scholar]
- 25.Sperti C, Pasquali C, Chierichetti F, et al. 18-Fluorodeoxyglucose positron emission tomography in predicting survival of patients with pancreatic carcinoma. J Gastrointest Surg. 2003;7(8):953–959. doi: 10.1016/j.gassur.2003.09.002. [DOI] [PubMed] [Google Scholar]
- 26.Nakata B, Chung YS, Nishimura S, et al. 18F-fluorodeoxyglucose positron emission tomography and the prognosis of patients with pancreatic adenocarcinoma. Cancer. 1997;79(4):695–699. [PubMed] [Google Scholar]
- 27.Sperti C, Pasquali C, Decet G, et al. F-18-fluorodeoxyglucose positron emission tomography in differentiating malignant from benign pancreatic cysts: a prospective study. J Gastrointest Surg. 2005;9(1):22–28. doi: 10.1016/j.gassur.2004.10.002. [DOI] [PubMed] [Google Scholar]
- 28.Pizzi S, Porzionato A, Pasquali C, et al. Glucose transporter-1 expression and prognostic significance in pancreatic carcinogenesis. Histol Histopathol. 2009;24(2):175–185. doi: 10.14670/HH-24.175. [DOI] [PubMed] [Google Scholar]
- 29.Sun HC, Qiu ZJ, Liu J, et al. Expression of hypoxia-inducible factor-1 α and associated proteins in pancreatic ductal adenocarcinoma and their impact on prognosis. Int J Oncol. 2007;30(6):1359–1367. [PubMed] [Google Scholar]
- 30.Lyshchik A, Higashi T, Hara T, et al. Expression of glucose transporter-1, hexokinase-II, proliferating cell nuclear antigen and survival of patients with pancreatic cancer. Cancer Invest. 2007;25(3):154–162. doi: 10.1080/07357900701208931. [DOI] [PubMed] [Google Scholar]
- 31.Ujiki MB, Ding XZ, Salabat MR, et al. Apigenin inhibits pancreatic cancer cell proliferation through G2/M cell cycle arrest. Mol Cancer. 2006;5:76. doi: 10.1186/1476-4598-5-76. [DOI] [PMC free article] [PubMed] [Google Scholar]
- 32.Melstrom LG, Salabat MR, Ding XZ, et al. Apigenin inhibits the GLUT-1 glucose transporter and the phosphoinositide 3-kinase/Akt pathway in human pancreatic cancer cells. Pancreas. 2008;37(4):426–431. doi: 10.1097/MPA.0b013e3181735ccb. [DOI] [PubMed] [Google Scholar]
- 33.Flier JS, Mueckler MM, Usher P, et al. Elevated levels of glucose transport and transporter messenger RNA are induced by ras or src oncogenes. Science. 1987;235(4795):1492–1495. doi: 10.1126/science.3103217. [DOI] [PubMed] [Google Scholar]
- 34.Chen C, Pore N, Behrooz A, et al. Regulation of GLUT1 mRNA by hypoxia-inducible factor-1. Interaction between H-ras and hypoxia. J Biol Chem. 2001;276(12):9519–9525. doi: 10.1074/jbc.M010144200. [DOI] [PubMed] [Google Scholar]
- 35.Fleming JB, Shen GL, Holloway SE, et al. Molecular consequences of silencing mutant K-ras in pancreatic cancer cells: justification for K-ras–directed therapy. Mol Cancer Res. 2005;3(7):413–423. doi: 10.1158/1541-7786.MCR-04-0206. [DOI] [PubMed] [Google Scholar]
- 36.Moore PS, Beghelli S, Zamboni G, et al. Genetic abnormalities in pancreatic cancer. Mol Cancer. 2003;2:7. doi: 10.1186/1476-4598-2-7. [DOI] [PMC free article] [PubMed] [Google Scholar]
- 37.Adsay NV, Basturk O, Cheng JD, et al. Ductal neoplasia of the pancreas: nosologic, clinicopathologic, and biologic aspects. Semin Radiat Oncol. 2005;15(4):254–264. doi: 10.1016/j.semradonc.2005.04.001. [DOI] [PubMed] [Google Scholar]
- 38.Thirabanjasak D, Basturk O, Altinel D, et al. Is serous cystadenoma of the pancreas a model of clear-cell-associated angiogenesis and tumorigenesis? Pancreatology. 2009;9(1–2):182–188. doi: 10.1159/000178890. [DOI] [PMC free article] [PubMed] [Google Scholar]
- 39.Gong K, Zhang N, Na X, et al. The expression of hypoxia inducible factor-1,2 alpha in sporadic clear cell renal cell carcinoma and their relationships to the mutations of von Hippel-Lindau gene. Zhonghua Wai Ke Za Zhi [in Chinese] 2005;43(6):390–393. [PubMed] [Google Scholar]
- 40.Paltoglou SM, Roberts BJ. Role of the von Hippel-Lindau tumour suppressor protein in the regulation of HIF-1alpha and its oxygen-regulated transactivation domains at high cell density. Oncogene. 2005;24(23):3830–3835. doi: 10.1038/sj.onc.1208531. [DOI] [PubMed] [Google Scholar]
- 41.Maxwell PH, Wiesener MS, Chang GW, et al. The tumour suppressor protein vHL targets hypoxia-inducible factors for oxygen-dependent proteolysis. Nature. 1999;399(6733):271–275. doi: 10.1038/20459. [DOI] [PubMed] [Google Scholar]
- 42.Maxwell PH, Pugh CW, Ratcliffe PJ. Activation of the HIF pathway in cancer. Curr Opin Genet Dev. 2001;11(3):293–299. doi: 10.1016/s0959-437x(00)00193-3. [DOI] [PubMed] [Google Scholar]
- 43.Akakura N, Kobayashi M, Horiuchi I, et al. Constitutive expression of hypoxia-inducible factor-1alpha renders pancreatic cancer cells resistant to apoptosis induced by hypoxia and nutrient deprivation. Cancer Res. 2001;61(17):6548–6554. [PubMed] [Google Scholar]
- 44.Ding XZ, Fehsenfeld DM, Murphy LO, et al. Physiological concentrations of insulin augment pancreatic cancer cell proliferation and glucose utilization by activating MAP kinase, PI3 kinase and enhancing GLUT-1 expression. Pancreas. 2000;21(3):310–320. doi: 10.1097/00006676-200010000-00014. [DOI] [PubMed] [Google Scholar]


