Abstract
Solid microspheres (diameter = 106–150 μm) of a Li2O–CaO–B2O3 glass were reacted in a K2HPO4 solution to form hollow hydroxyapatite (HA) microspheres. The effect of the temperature (25°–60°C), K2HPO4 concentration (0.01–0.25M), and pH (9–12) of the solution on the diameter (d) of the hollow core normalized to the diameter (D) of the HA microspheres, the surface area, and the pore size of the microsphere wall was studied. The statistically significant process variables that influenced these microstructural characteristics were evaluated using a factorial design approach. While the pH had little effect, the concentration of the solution had a marked effect on d/D, surface area, and pore size, whereas temperature markedly influenced d/D and pore size, but not the surface area. The largest hollow core size (d/D value ≈ 0.6) was obtained at the lowest temperature (25°C) or the lowest K2HPO4 concentration (0.02M), while microspheres with the highest surface area (140 m2/g), with pores of size 10–12 nm were obtained at the highest concentration (0.25M). The consequences of these results for potential application of these hollow HA microspheres as devices for local delivery of proteins, such as drugs or growth factors, are discussed.
I. Introduction
Over the past few decades, there has been considerable interest in the development of controlled-delivery devices for local delivery of proteins such as drugs or growth factors.1 A controlled-release system consists of a biologically active agent (e.g., protein) in a carrier material (commonly a polymer or ceramic). The objective of the controlled-delivery device is to provide a means for local delivery of the protein to the target site at concentrations within the therapeutic limits and for the required duration. Because the delivery device is implanted, injected, or inserted into the body, the biocompatibility and toxicity of the carrier material are of critical importance.
Natural and synthetic biodegradable polymers have found wide application as carrier materials for protein delivery.2 The delivery systems include microspheres, hydrogels, and three-dimensional porous scaffolds.3,4 These polymers degrade in vivo, either enzymatically or nonenzymatically, to produce biocompatible or nontoxic by-products along with progressive release of the dispersed or dissolved protein. Natural polymers and their derivatives in the form of gels or sponges have been used extensively as delivery vehicles. In particular, collagen is a readily available extracellular matrix component that allows cell infiltration and remodeling, making it an attractive delivery system for protein growth factors.5,6 Biodegradable synthetic polymers, such as poly(lactic acid) and poly(glycolic acid), as well as their copolymers, poly(lactic coglycolic acid), are the most widely used delivery systems. In addition to being widely available, they can be prepared with well-controlled, reproducible chemical and physical properties.2–4,7 They are also among the few synthetic biodegradable polymers approved by the Food and Drug Administration for in vivo use.
Inorganic (bioceramic) materials which have been utilized as carriers for protein delivery consist primarily of β-tricalcium phosphate or hydroxyapatite (HA).1 These materials, composed of the same elements as bone, are biocompatible and produce no systemic toxicity or immunological reactions. The delivery systems typically consist of porous particles, granules, or substrates in which the protein is adsorbed or attached to the surfaces of the porous material, or encapsulated within the pores.8–11 Hollow HA microspheres (diameter = 1500–2000 μm), consisting of a hollow core and a mesoporous shell, have been prepared by coating chitin microspheres with a composite layer of chitin and HA, followed by thermal decomposition of the chitin and sinte-ring of the porous HA shell.12
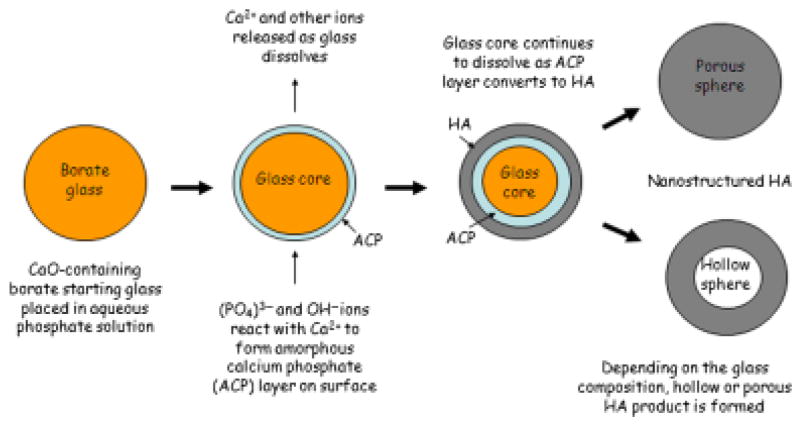
Day and Conzone13 invented a process for the preparation of porous phosphate materials with high surface area by converting borate glasses with special compositions in an aqueous phosphate solution near room temperature.14,15 This process is shown schematically in Fig. 1, using as an example the conversion of a Li2O–CaO–B2O3 glass in the shape of a sphere to form HA. In the conversion process, Ca2+ and other ions are released as the glass dissolves, while (PO4)3− and OH− from the solution react with Ca2+ ions to form an amorphous calcium phosphate (ACP) layer on the glass surface. The glass core continues to dissolve as the ACP converts to HA, until finally a fully reacted shape, hollow or porous, composed of mesoporous HA, is formed. A characteristic feature of the process is that it is pseudomorphic, so the HA product retains the same external shape and dimensions of the starting glass object.
Fig. 1.
Schematic diagram illustrating steps in the reaction process for converting calcium–borate glass microsphere to hollow or porous hydroxyapatite (HA) microsphere in an aqueous phosphate solution.
Wang et al.16 reacted solid glass microspheres (106–125 μm) with the composition (wt%) 4.7Li2O, 13.2CaO, 82.1B2O3 in 0.25M K2HPO4 solution for 5 days at 37°C and pH = 10.0–12.0. They found that the product consisted of hollow microspheres of a calcium phosphate material, which, on heating for 4 h at 600°C, converted to HA. Huang et al.17 prepared hollow HA microspheres by reacting glass microspheres with the composition 10Li2O, 10CaO, 80B2O3 (wt%) for 5 days (microsphere diameter = 106–125 μm) or 14 days (microsphere diameter = 500–800 μm) under similar conditions used by Wang et al.16 They measured the surface area of the smaller HA microspheres (135 m2/g) and the rupture strength of the larger HA microspheres (1.6 MPa), and studied the effect of heat treatment on the surface area and rupture strength. Heating the as-prepared HA microspheres for 8 h at 600° and at 800°C resulted in a marked decrease in surface area and a sharp increase in strength.
The objective of this work was to comprehensively evaluate how the process parameters influence the microstructure of hollow HA microspheres prepared by reacting Li2O–CaO–B2O3 glass microspheres in an aqueous phosphate solution. In contrast to previous studies that used only a single set of reaction conditions,16,17 we used a factorial design approach to evaluate the statistically significant process variables, which influenced the microstructure of the HA microspheres. The effect of the K2HPO4 concentration (0.02–0.25M), temperature (25°–60°C), and pH (9–12) of the solution on the diameter of the hollow core and surface area of the HA microspheres, as well as the average pore size of the microsphere wall was studied. Knowledge of the relationships between the process parameters and the resulting microstructure is vital for the preparation of hollow HA microspheres with characteristics optimized for potential application as carriers for controlled-protein delivery.
II. Experimental Procedure
(1) Preparation of Hollow HA Microspheres
Borate glass, with the composition (wt%): 15CaO, 10.63Li2O, 74.37B2O3, designated CaLB3-15, was prepared by melting reagent grade CaCO3, Li2CO3, and H3BO3 (Alfa Aesar, Haverhill, MA) in a Pt crucible at 1200°C for 45 min, and quenching between cold stainless steel plates. This glass composition was used because it had been shown in previous work to produce hollow HA microspheres by the glass conversion process.14 Particles of size 106–150 μm were obtained by grinding the glass in a hardened steel mortar and pestle, and sieving through 100 and 140 mesh sieves. Solid glass microspheres were obtained by dropping the crushed particles down a vertical tube furnace at 1000°C, as described in detail elsewhere.14
Hollow HA microspheres were prepared by reacting the glass microspheres with K2HPO4 solution for 2–7 days. In all the experiments, 1 g of glass microspheres was placed in 200 mL solution, and the system was gently stirred continuously. A range of temperature (25°, 37°, and 60°C), K2HPO4 concentration (0.02, 0.10, and 0.25M), and pH (9 and 12) of the solution was used to study the effect of these process variables on the microstructure of the synthesized HA microspheres. Upon completion of the conversion process, the HA microspheres were washed three times with distilled water, soaked in anhydrous ethanol to displace residual water, dried for at least 12 h at room temperature, then for at least 12 h at 90°C, and stored in a desiccator before being characterized.
(2) Factorial Design of Experiments
An approach based on factorial design of experiments was used to evaluate the statistically significant process variables that influenced the microstructure of the hollow HA microspheres. The three process variables investigated were the temperature of the conversion reaction, the K2HPO4 concentration of the phosphate solution, and the pH value of the solution. Each of these variables was set at two levels, as shown in Table I. The factorial design required eight sets of experimental conditions, which were carried out in a random order given in Table II. The microstructural properties evaluated in the experiments were specific surface area (SSA), pore size, and the ratio of the hollow core diameter (d) to the external diameter (D) of the hollow HA microspheres. Analysis of the data to determine the statistically significant process variables that influenced these microstructural characteristics was performed using the software package Minitab 15.1 (Minitab Inc., State College, PA).
Table I.
Control Factors Used in the Statistical Design of the Experiments
| Code | Control factor | Experimental level 1 | Experimental level 2 |
|---|---|---|---|
| T | Temperature | 37°C | 60°C |
| C | Concentration | 0.02M | 0.25M |
| P | pH value | 9 | 12 |
Table II.
Experimental Design with Three Factors (Temperature, K2HPO4 Concentration, and pH of the Solution) Varied at Two Levels
| Run | Temperature (°C) | Concentration (M) | pH value | Surface area (m2/g) | Pore size (nm) | d/D | Reaction time (days) |
|---|---|---|---|---|---|---|---|
| 1 | 60 | 0.25 | 9 | 145±5 | 13±2 | 0.19±0.11 | 2 |
| 2 | 60 | 0.02 | 9 | 82±5 | 10±2 | 0.34±0.03 | 7 |
| 3 | 37 | 0.02 | 12 | 89±5 | 12±2 | 0.55±0.02 | 7 |
| 4 | 37 | 0.25 | 12 | 123±5 | 17±2 | 0.34±0.03 | 2 |
| 5 | 37 | 0.02 | 9 | 101±5 | 15±2 | 0.61±0.03 | 2 |
| 6 | 37 | 0.25 | 9 | 127±5 | 19±2 | 0.36±0.02 | 2 |
| 7 | 60 | 0.25 | 12 | 140±5 | 12±2 | 0.14±0.07 | 2 |
| 8 | 60 | 0.02 | 12 | 78±5 | 8±2 | 0.37±0.09 | 7 |
| 9 | 37 | 0.10 | 9 | 108±5 | 17±2 | 0.54±0.03 | 2 |
| 10 | 25 | 0.25 | 9 | 101±5 | 20±2 | 0.62±0.08 | 7 |
The measured properties of the hollow hydroxyapatite microspheres (ratio of hollow core diameter to microsphere diameter [d/D], specific surface area, and average pore size) prepared under each condition for the reaction time used are also shown.
(3) Characterization of Hollow HA Microspheres
The phase composition of the as-prepared HA microspheres was checked using X-ray diffraction (XRD) (D/mas 2550 v; Rigaku, The Woodlands, TX) and Fourier transform infrared (FTIR) spectroscopy (Model 1760-X; Perkin Elmer, Norwalk, CT). XRD was performed using CuKα radiation (λ = 0.15406 nm) at a scan rate of 1.8°/min in the 2θ range 20°–70°. The HA microspheres were ground to a powder for the XRD and FTIR analyses. FTIR was performed in the wavenumber range of 400–4000 cm−1 (resolution = 8 cm−1). A mass of 2 mg of the powder was mixed with 198 mg KBr, and pressed to form pellets for the FTIR analysis.
The microstructure of the external surface and the cross section of the HA microspheres was observed using scanning electron microscopy (SEM) (S-4700; Hitachi, Tokyo, Japan), at an accelerating voltage of 10 kV and working distance of 12 mm. The diameter of the hollow core and the external diameter of the microspheres were determined from at least five measurements for each group of microspheres. Local composition of the external surface and across the wall of the microspheres was determined using energy dispersive X-ray (EDS) analysis in the SEM, with an electron beam spot size of 1 μm. X-ray mapping in the SEM was used to analyze the elemental distribution across the cross section of the HA microspheres.
The SSA of the hollow HA microspheres and the pore size distribution of the microsphere wall were measured using nitrogen adsorption (Autosorb-1; Quantachrome, Boynton Beach, FL). Before the measurement, a known mass of HA microspheres (in the range 300–500 mg) was weighed, and evacuated for 15 h at 120°C to remove adsorbed moisture. The volume of nitrogen adsorbed and desorbed at different relative gas pressures was measured and used to construct adsorption–desorption isotherms. The first five points of the adsorption isotherm, which initially followed a linear trend implying monolayer formation of adsorbate, were fitted to the Brunauer–Emmett– Teller equation for the determination of the SSA.18 The pore size distribution was calculated using the Barrett–Joiner– Halenda method applied to the desorption isotherms.19 The surface area and average pore size were determined from two measurements for each group of microspheres.
III. Results
(1) Geometry and Composition of Converted Microspheres
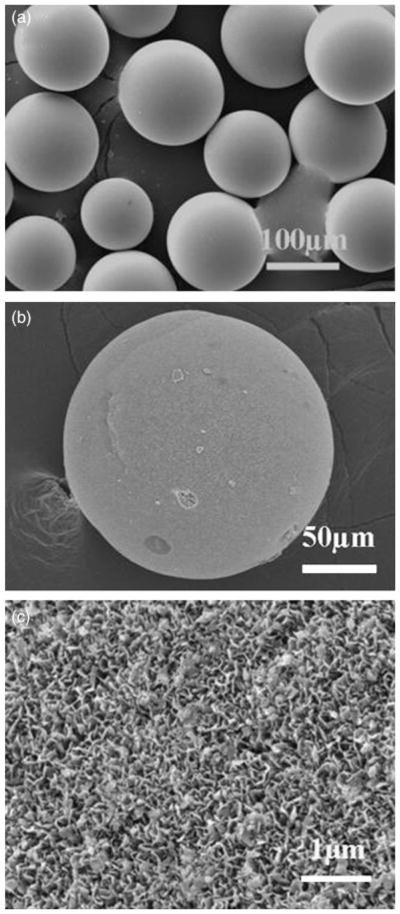
Figure 2 shows SEM images of CaLB3-15 glass microspheres (Fig. 2(a)), and the surface of a converted microsphere formed by reacting the glass microspheres for 2 days in 0.02M K2HPO4 solution at 37°C and pH = 9.0 (Figs. 2(b) and (c)). The converted microspheres had a porous, nanostructured surface with a plate-like particle morphology (Fig. 2(c)). Measurement of the microsphere diameter from SEM images showed no significant difference between the average diameter of the starting glass microspheres and that of the converted microspheres, confirming that the conversion reaction was pseudomorphic.14–16
Fig. 2.
Scanning electron microscopy images of (a) starting glass (CaLB3-15) microspheres, (b) external surface of hollow hydroxyapatite (HA) microsphere formed by conversion of glass microspheres in 0.02M K2HPO4 solution at 37°C and pH = 9 for 48 h, and (c) external surface of hollow HA microsphere at high magnification.
XRD patterns of the starting glass microspheres and the converted microspheres formed by reacting the glass microspheres for 2 days in 0.25M K2HPO4 solution at 37° and 60°C and pH = 9 and 12 are shown in Fig. 3. The starting CaLB3-15 glass had a diffraction pattern with no measurable peaks, typical of an amorphous glass. On the other hand, the patterns of the converted microspheres contained peaks that corresponded to those of a reference HA (JCPDS 72-1243), confirming the formation of the HA phase. The fairly broad width of the peaks in the XRD patterns may indicate that phases were poorly crystallized, or consisted of nanometer-sized crystals, or a combination of both.
Fig. 3.
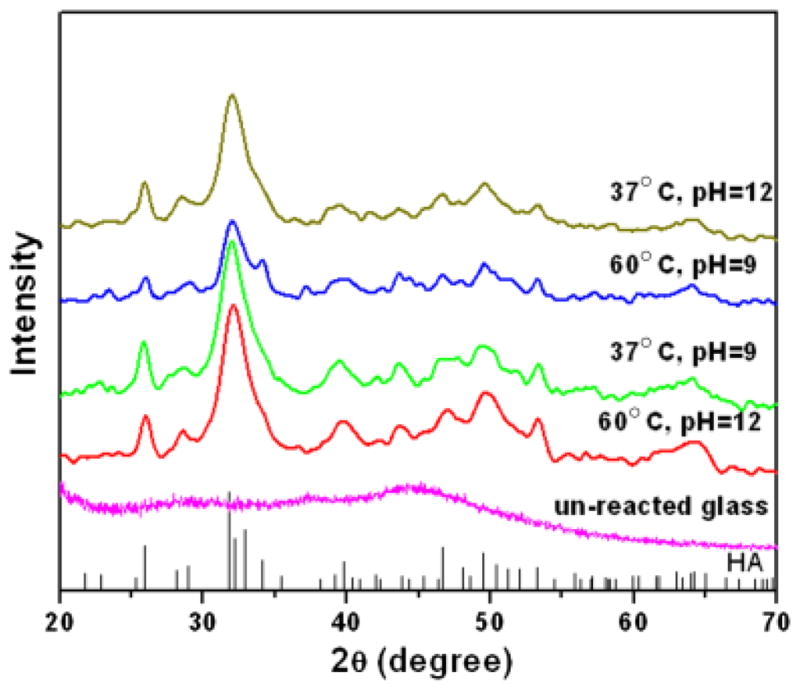
X-ray diffraction of the starting glass microspheres (unreacted glass) and the hollow microspheres formed by reacting the glass microspheres in 0.25MK2HPO4 solution under the conditions shown for 48 h. The pattern of a reference hydroxyapatite (HA) (JCPDS 72-1243) is also shown.
Figure 4 shows FTIR spectra of the starting glass microspheres and the converted microspheres prepared under the conditions described above for the XRD analysis. The spectrum of the as-prepared glass was similar to that of a binary Li2O–3B2O3 glass,20,21 consisting of two broad resonances, at 600–750 and 1200–1600 cm−1, which corresponded to vibrations of the trigonal BO3 groups in the borate glass. The resonance centered at ~975 cm−1 corresponded to the vibration of tetrahedral BO4 groups. The most dominant resonances for the converted microspheres were the phosphate v3 resonance, centered at ~1040 cm−1, and the phosphate v4 resonance, with peaks at ~605 and 560 cm−1, which are associated with crystalline HA.22,23 These FTIR spectra provided further evidence that the converted microspheres consisted of HA. Additional resonances in the spectra of the conversion products included a weak shoulder at ~962 cm−1 corresponding to the phosphate v1 band,24 and a resonance at ~878 cm−1 corresponding to the vibrations of ions substituting for ions in the HA lattice.24
Fig. 4.
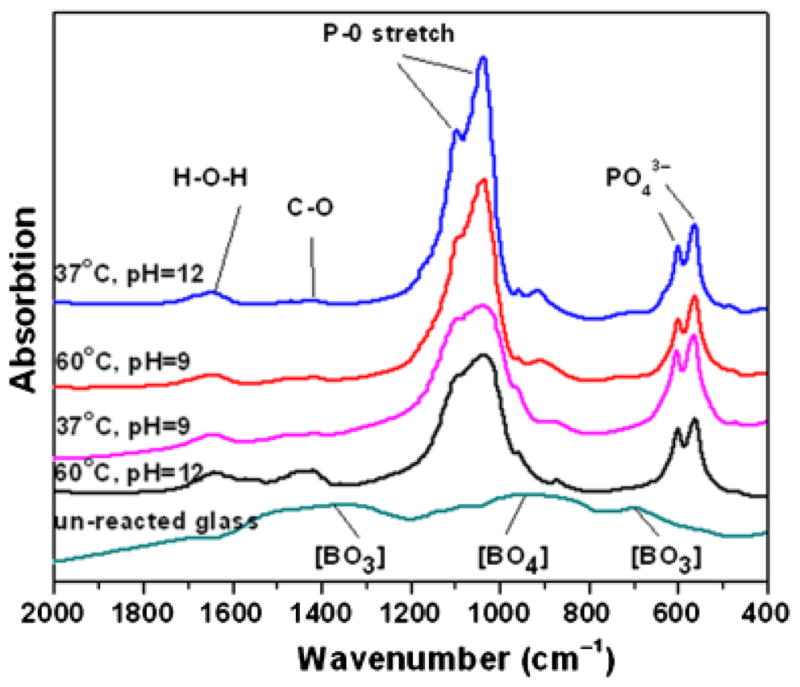
Fourier transform infrared of the starting glass microspheres (unreacted glass) and the hollow microspheres formed by reacting the glass microspheres in 0.25M K2HPO4 solution under the conditions shown for 48 h.
The XRD and FTIR patterns of the converted microspheres formed under the remaining conditions summarized in Table II were generally similar to those described above, and they are omitted for the sake of brevity. Together, the XRD and FTIR analyses showed that the converted microspheres had a phase composition corresponding to that of HA.
A back-scattered SEM image of the polished cross section of a microsphere formed at 37°C in 0.02MK2HPO4 solution with a pH = 9.0 is shown in Fig. 5(a). The cross section was prepared by vacuum impregnation of the as-prepared microspheres with epoxy resin, followed by grinding and polishing. This image (as well as other similar images not shown) confirmed that the HA microspheres were hollow. X-ray maps of Ca(K) and P(K) across the section (Figs. 5(b) and (c)), showed that the microsphere wall was composed of Ca and P, which is consistent with the formation of HA as determined by XRD, FTIR spectroscopy, and EDS analysis.
Fig. 5.
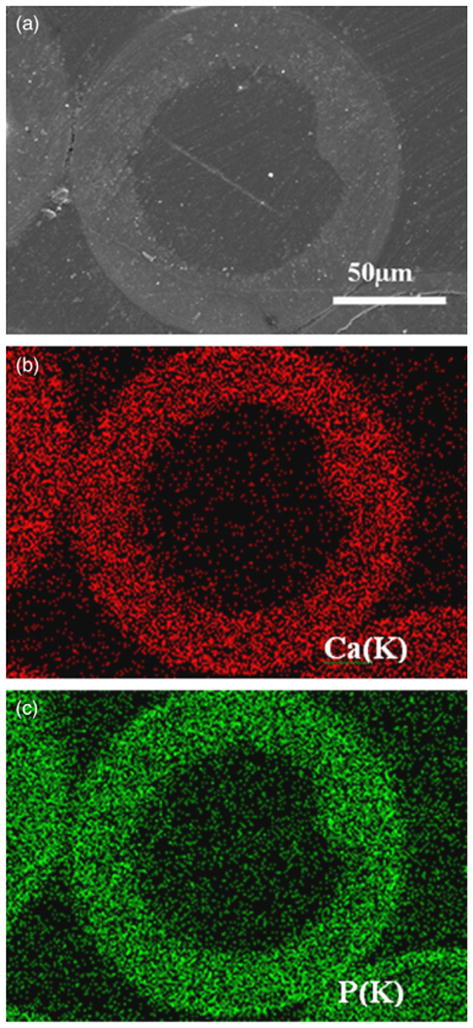
(a) Scanning electron microscopy image in back-scattered mode of a polished cross section of a hollow hydroxyapatite microsphere formed by reacting glass microspheres in 0.02M K2HPO4 solution at 37°C and pH = 9 for 48 h; (b) and (c) X-ray maps of Ca(K) and P(K) across the planar section shown in (a).
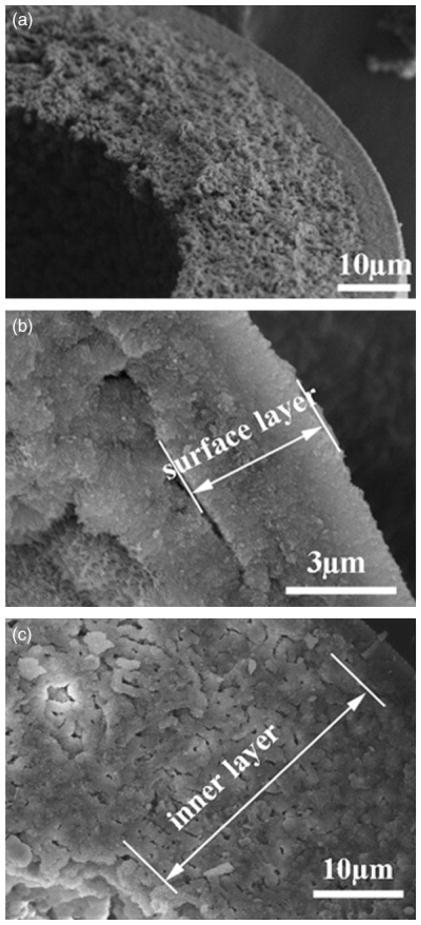
Examination of the cross section at higher magnification in the SEM showed that the HA microsphere wall was not homogeneous in structure. Instead, it consisted of at least two distinct layers. An SEM image (Fig. 6(a)) of the cross section of a hollow microsphere prepared by reacting glass microspheres for 48 h in 0.02M K2HPO4 solution at 37°C and pH = 9.0 showed that the microsphere wall consisted of two layers. The denser surface layer (Fig. 6(b)) was 3–5 μm thick, whereas the remainder of the microsphere wall consisted of a more porous microstructure (Fig. 6(c)). The factors responsible for this layered structure of the microsphere wall are not clear. Experiments are currently underway to provide a clearer understanding of the formation of this layered structure, and the results will be reported in a subsequent publication.
Fig. 6.
Scanning electron microscopy images of the fractured cross section of a hollow hydroxyapatite microsphere formed by reacting glass microspheres in 0.02M K2HPO4 solution at 37°C and pH = 9 for 48 h: (a) concentric bilayered structure, (b) denser surface layer, and (c) more porous inner layer.
(2) Statistical Significance of Process Variables
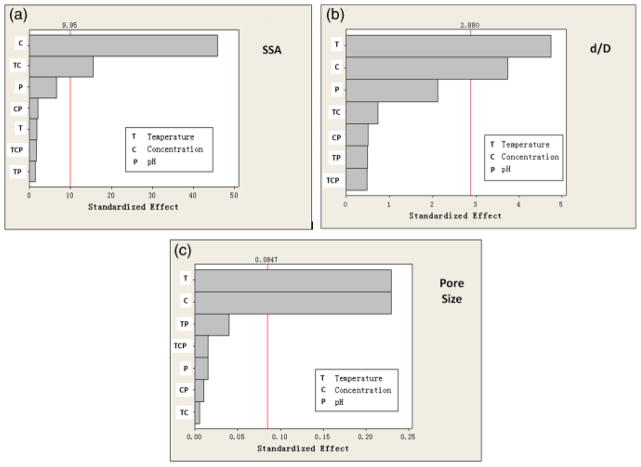
As described earlier, a factorial design approach was used to identify the process variables (temperature, concentration, and pH), which had a statistically significant effect on the microstructural properties (d/D, surface area, and average pore size) of the hollow HA microspheres. The results are shown in the form of Pareto charts (Fig. 7), which provide a useful graphical tool for illustrating the magnitude and significance of an effect. The chart displays, in decreasing order, the absolute value of the standardized effect of the variables (X-axis), together with a reference line giving the level of significance, taken as p = 0.05 in this work. An effect that extends past this reference line is statistically significant. In the present analysis, two-way interactions between the process variables, as well as three-way interactions among the variables were also considered.
Fig. 7.
Pareto charts showing the standardized effect for the process variables and their significance on (a) the specific surface area (SSA), (b) ratio of hollow core diameter to the microsphere diameter (d/D), and (c) pore size of the microsphere wall. T, temperature; C, concentration of K2HPO4 solution; P, pH value.
The most dominant factor influencing the surface area of the hollow HA microspheres was the concentration of the K2HPO4 solution (Fig. 7(a)). An interaction between the reaction temperature and the concentration had a significant effect on the surface area. Surprisingly, temperature by itself did not have a significant effect on the surface area. The interaction among temperature, K2HPO4 concentration, and pH was not found to have a significant effect. Temperature and concentration each had a significant effect on the ratio (d/D) of the hollow core diameter to the microsphere diameter (Fig. 7(b)) and on the average pore size (Fig. 7(c)).
(3) Relationships Between Process Variables and Microstructural Characteristics
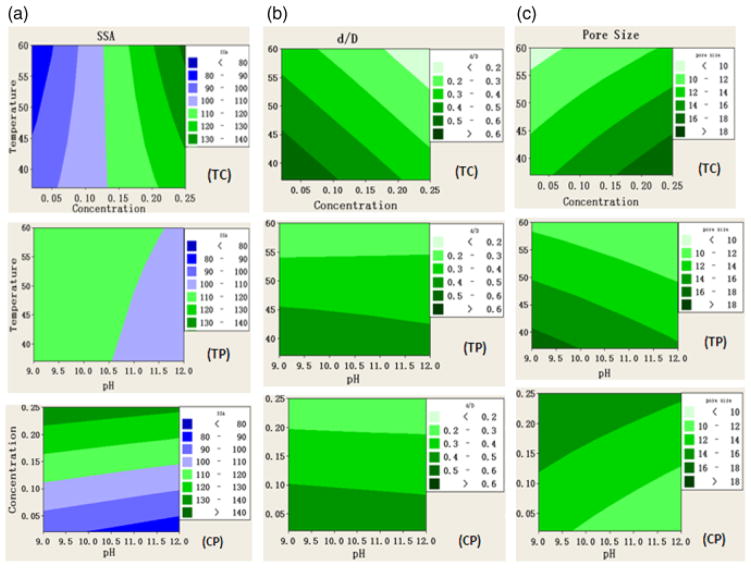
Contour plots were selected to show the main effects of the individual process variables and combinations of these variables on the microstructural characteristics of the hollow HA microspheres. The plots in Fig. 8 show the variations in the SSA, average pore size, and the d/D ratio with changes in two process variables, while holding the third variable constant. The constant values of the third variable were temperature = 37°C, K2HPO4 concentration = 0.25M, and pH = 9, respectively. The results in these plots could be used to identify optimized solution conditions for preparing hollow HA microspheres with a given set of microstructural characteristics.
Fig. 8.
Contour plots showing the effect of the process variables on the microstructural characteristics: (a) specific surface area (SSA), (b) ratio of hollow core diameter to the microsphere diameter (d/D), and (c) pore size of the microsphere wall. T, temperature (°C); C, concentration of K2HPO4 solution (M); P, pH value.
Inspection of the plots in Fig. 8(a) shows that high surface area (>130–140 m2/g) can be achieved by using higher K2HPO4 concentration (0.25M) or using a combination of higher concentration (0.25M) and higher temperature (60°C). Figure 8(b) shows that the diameter of the hollow core (or the d/D ratio) increased with decreasing temperature or with decreasing K2HPO4 concentration. Increasing temperature produced a reduction in the pore size, whereas increasing K2HPO4 concentration produced an increase in the pore size (Fig. 8(c)). Larger pore sizes (>18 nm) are obtained for a combination of lower temperature (37°C) and higher concentration (0.25M). A change in pH of the solution, between 9.0 and 12.0 had little effect on the microstructural characteristics.
(4) Diameter of Hollow Core
The diameter (d) of the hollow core of the HA microspheres, (or the d/D ratio) is of particular interest because it determines the amount of a substance that could be encapsulated within the hollow core of the microsphere. Based on the factorial design approach, two additional sets of experimental conditions were used (designated as Runs 9 and 10 in Table II) to provide further information on the dependence of d/D on the key process variables of temperature andK2HPO4 concentration of the solution.
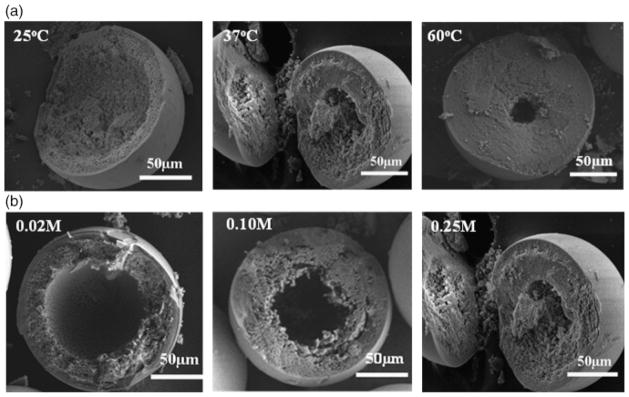
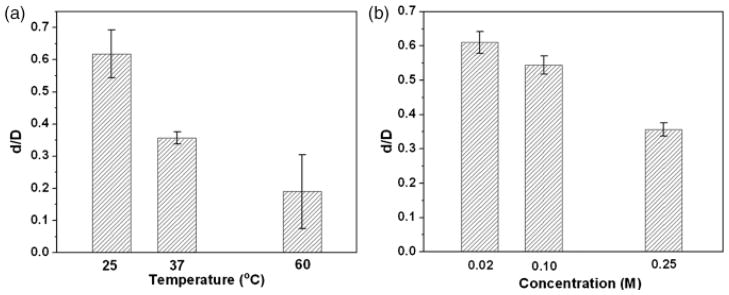
SEM images (Fig. 9) of cross sections of hollow HA microspheres prepared at different temperatures (pH = 9, K2HPO4 concentration = 0.25) and different K2HPO4 concentrations (pH = 9, temperature = 37°C) show a marked change in the diameter (d) of the hollow core (or the d/D ratio). The microspheres in Fig. 9 were broken deliberately to show the cross sections. Increasing the temperature from 25° to 60°C almost resulted in the disappearance of the hollow core (Fig. 9(a)). The diameter of the hollow core also decreased markedly with an increase in the concentration of the K2HPO4 solution. Based on measurements from at least five spheres in each group, the results showed that d/D decreased from 0.62±0.08 at 25°C to 0.19±0.11 at 60°C (Fig. 10(a)), while it decreased from 0.61±0.03 for a K2HPO4 concentration of 0.02M to 0.36±0.02 for a concentration of 0.25M (Fig. 10(b)).
Fig. 9.
Scanning electron microscopy images of the fractured cross sections of hollow hydroxyapatite microspheres, showing (a) the effect of temperature on the hollow core size for microspheres prepared under constant conditions of pH (9.0) and K2HPO4 concentration (0.25M) and (b) the effect of K2HPO4 concentration on the hollow core size for microspheres prepared at constant conditions of pH (9.0) and temperature (37°C).
Fig. 10.
The relationship between the measured values of d/D and (a) temperature and (b) K2HPO4 concentration of the solution, where d/D is the ratio of the hollow core diameter to the microsphere diameter.
IV. Discussion
The present investigation showed that solid microspheres of a Li2O–CaO–B2O3 glass, designated CaLB3-15, can be reproducibly converted to hollow HA microspheres when reacted in an aqueous phosphate solution. Furthermore, by varying the temperature, concentration, and pH of the K2HPO4 solution, hollow microspheres with controlled-microstructural characteristics (diameter of hollow core, surface area, and pore size) can be prepared. The conversion reaction is pseudomorphic, so not only the microstructural characteristics but also the external diameter of the hollow HA microspheres can be controlled.
The ability to control the geometry and microstructure of these hollow HA microspheres is critical for evaluating the potential of the microspheres for their intended application as delivery devices for proteins, such as drugs or growth factors, in tissue repair and regeneration. Key microstructural characteristics for this application are the ratio of the diameter of the hollow core relative to the external diameter of the hollow HA microspheres, d/D, the SSA of the microspheres, and the average pore size of the microsphere wall. A larger d/D value means that a larger amount of protein can be encapsulated within the hollow core, whereas a larger surface area indicates better ability for a protein to be adsorbed to the surfaces of the microsphere wall. The average pore size controls the permeability of the HA microsphere wall, and therefore the ability of a protein to migrate through the microsphere wall, during incorporation of the protein into the hollow core, or release of the protein from the hollow core into a surrounding medium.
Previous investigations studied the ability to prepare hollow HA microspheres by the glass conversion method using a selected set of temperature, solution concentration, and pH conditions.16,17 In contrast, the factorial design approach used in this work allowed an investigation of the statistically significant process variables which influenced the microstructural characteristics of the hollow HA microspheres. By varying the temperature (25°–60°C), K2HPO4 concentration (0.02–0.25M), and pH (9–12) of the solution over practically useful ranges, we were able to determine the key individual variables, as well as combinations of these individual variables, which had a significant influence on the microstructure.
The temperature and K2HPO4 concentration of the solution had the most dominant effect on the three microstructural properties (d/D, surface area, and pore size) of the HA microspheres investigated in this work (Figs. 7 and 8). The basic pH values (9 and 12) of the phosphate solution used in this work, while favorable for the formation of HA,25 had little effect on the microstructure (Figs. 7 and 8).
The achievement of high surface area is promoted by higher K2HPO4 concentration of the solution. Interestingly, higher temperature leads to high surface area only when the solution concentration is high (Fig. 7(a)). The highest surface area (145±5 m2/g) was obtained for a temperature of 60°C and a concentration of 0.25M. Apparently, a high concentration of phosphate ions is required for the rapid formation of fine nuclei at the reaction interface, whereas a rapid reaction rate (higher temperature) is beneficial for the formation of fine HA particles (high SSA).
Lower temperature or lower K2HPO4 concentration is beneficial for the formation of hollow cores with larger d/D (equal to~0.6) (Figs. 8 and 9). In the conversion reaction (Fig. 1), if it is assumed that all the CaO in the glass reacts with the phosphate ions in the solution to form HA, then the amount of HA formed is ~27 wt% of the starting glass, regardless of the conditions used. The occurrence of the largest d/D at low concentration (0.02M) or low temperature (25°C) indicates that under these conditions, the fine HA particles in the microsphere wall are more efficiently packed. Presumably the low temperature or low solution concentration lead to slower growth of the HA nuclei, allowing the smaller HA crystals to achieve a more efficient packing in the microsphere wall. A large d/D value may result in high strength of the HA microspheres, which is an important property for the application of these microspheres. A detailed study of the rupture strength of the microspheres is currently underway.
The average pore size of the microsphere wall varied by a factor of ~2, from ~10 to ~20 nm, for the temperature, K2HPO4 concentration, and pH conditions used in this work, with the smallest pore size obtained for lower concentration (0.02M) and for higher temperature (60°C) (Table II). The pore size, as outlined earlier, controls the ability of a molecule to migrate through the microsphere wall. Based on hydrodynamic experiments, bovine serum albumin (BSA), one of the most widely studied proteins, is reported to take up the shape of an oblate ellipsoid with dimensions of 14 and 4 nm along the long- and short-axis, respectively.26 Some groups of HA microspheres prepared in this work, with the larger pore sizes (15–20 nm), could potentially serve as delivery devices for BSA, as well as other proteins with dimensions approximately equal to, or smaller than, the length of the BSA long-axis. Our current work shows that the pore size can be enlarged by a thermal treatment at temperatures up to ~600°C, which could serve as a further method for controlling the pore size and, therefore, the release rate of a protein from the microspheres.
In these experiments, the reaction time was chosen to ensure complete conversion of the starting glass microspheres to HA. The reaction time was 2 days, except for experiments involving the lowest K2HPO4 concentration (0.02M) or the lowest temperature (25°C), when the reaction time was 7 days (Table II). For the same conditions (temperature, concentration, and pH), varying the reaction time could result in changes to the microstructure. However, a thermal treatment of the as-prepared HA microspheres, as outlined above, may provide a more efficient method for modifying the microstructure.
V. Conclusions
Solid microspheres (106–150 μm in diameter) of a Li2O–CaO– B2O3 glass were completely converted within 2–7 days in an aqueous phosphate solution to hollow HA microspheres with a mesoporous wall. The conversion reaction was pseudomorphic, with the hollow HA microspheres retaining the external shape and diameter of the starting glass microspheres. A factorial design approach, used for designing the conversion experiments, allowed a determination of the statistically significant process variables, which influenced the microstructure of the HA microspheres. Although the pH had little effect, the K2HPO4 concentration of the solution had a marked effect on the diameter of the hollow core, surface area, and pore size, whereas temperature markedly influenced the hollow core diameter and pore size, but not the surface area. The surface area increased with the K2HPO4 concentration, reaching ~140 m2/g at 0.25M. The hollow core diameter increased with decreasing temperature or with decreasing K2HPO4 concentration, reaching a value of ~0.6 times the microsphere diameter at 25°C or 0.02M. The largest pore sizes (~20 nm) were obtained at higher concentration or lower temperature. These hollow HA microspheres could provide potential biocompatible inorganic systems for local delivery of proteins, such as drugs and growth factors in tissue repair and regeneration.
Acknowledgments
This work was supported by the National Institute of Dental and Craniofacial Research, National Institutes of Health, Grant # 1R15DE018251-01.
The authors would like to thank Y. He, MO-SCI Corp., for assistance with surface area and pore size measurements.
References
- 1.Mallapragada SK, Narasimhan B. Drug Delivery Systems. In: von Recum AF, editor. Handbook of Biomaterials Evaluation. 2. Taylor & Francis; Philadelphia, PA: 1999. pp. 425–37. [Google Scholar]
- 2.Sinha VR, Trehan A. Biodegradable Microspheres for Protein Delivery. J Control Release. 2003;90:261–80. doi: 10.1016/s0168-3659(03)00194-9. [DOI] [PubMed] [Google Scholar]
- 3.Tabata Y. Tissue Regeneration Based on Growth Factor Release. Tissue Eng. 2003;9(Suppl 1):S5–15. doi: 10.1089/10763270360696941. [DOI] [PubMed] [Google Scholar]
- 4.Chen RR, Mooney DJ. Polymeric Growth Factor Delivery Strategies for Tissue Engineering. Pharm Res. 2003;20:1103–12. doi: 10.1023/a:1025034925152. [DOI] [PubMed] [Google Scholar]
- 5.Ma S, Chen G, Reddi AH. Collaboration Between Collageneous Matrix and Osteogenin is Required for Bone Induction. Ann NY Acad Sci. 1990;580:525–5. [Google Scholar]
- 6.McPherson JM. The Utility of Collagen-Based Vehicles in Delivery of Growth Factors for Hard and Soft Tissue Wound Repair. Clin Mater. 1992;9:225–34. doi: 10.1016/0267-6605(92)90103-z. [DOI] [PubMed] [Google Scholar]
- 7.Cleek RL, Ting KC, Eskin SG, Mikos AG. Microparticles of Poly(DL-Lactic-Co-Glycolic Acid)/Poly(Ethylene Glycol) Blends for Controlled Drug Delivery. J Control Release. 1997;48:259–68. [Google Scholar]
- 8.Ono I, Ohura T, Murata M, Yamaguchi H, Ohnuma Y, Kuboki Y. A Study on Bone Induction in Hydroxyapatite Combined with Bone Morphogenetic Protein. Plast Reconstr Surg. 1992;90:870–9. doi: 10.1097/00006534-199211000-00023. [DOI] [PubMed] [Google Scholar]
- 9.Ripamonti U, Ma S, Van den Heever B, Reddi AH. Osteogenin, a Bone Morphogenetic Protein, Adsorbed on Porous Hydroxyapatite Substrata, Induces Rapid Bones Differentiation in Calvarial Defects of Adult Primates. Plast Reconstr Surg. 1992;90:382–93. doi: 10.1097/00006534-199209000-00004. [DOI] [PubMed] [Google Scholar]
- 10.Ripamonti U. Osteoinduction in Porous Hydroxyapatite Implanted in Heterotopic Sites of Different Animal Models. Biomaterials. 1996;17:31–5. doi: 10.1016/0142-9612(96)80752-6. [DOI] [PubMed] [Google Scholar]
- 11.Matsumoto T, Okazaki M, Inoue M, Yamaguchi S, Kusunose T, Toyonaga T, Hamada Y, Takahashi J. Hydroxyapatite Particles as a Controlled Release Carrier of Protein. Biomaterials. 2004;25:3807–12. doi: 10.1016/j.biomaterials.2003.10.081. [DOI] [PubMed] [Google Scholar]
- 12.Peng Q, Ming L, Jiang CX, Feng B, Qu SX, Weng J. Preparation and Characterization of Hydroxyapatite Microspheres with Hollow Core and Mesoporous Shell. Key Eng Mater. 2006;309–311:65–8. [Google Scholar]
- 13.Day DE, Conzone SA. Method for Preparing Porous Shells or Gels from Glass Particles. 6,358,531. US Patent. 2002 March 19;
- 14.Day DE, White JE, Bown RF, McMenamin KD. Transformation of Borate Glasses into Biologically Useful Materials. Glass Technol. 2003;44:75–8. [Google Scholar]
- 15.Conzone SD, Day DE. Preparation and Properties of Porous Microspheres Made form Borate Glass. J Biomed Mater Res Part A. 2009;88A:531–42. doi: 10.1002/jbm.a.31883. [DOI] [PubMed] [Google Scholar]
- 16.Wang Q, Huang W, Wang D, Darvell BW, Day DE, Rahaman MN. Preparation of Hollow Hydroxyapatite Microspheres. J Mater Sci: Mater Med. 2006;17:641–6. doi: 10.1007/s10856-006-9227-5. [DOI] [PubMed] [Google Scholar]
- 17.Huang W, Rahaman MN, Day DE, Miller BA. Strength of Hollow Microspheres Prepared by a Glass Conversion Process. J Mater Sci: Mater Med. 2009;20:123–9. doi: 10.1007/s10856-008-3554-7. [DOI] [PubMed] [Google Scholar]
- 18.Coleman NJ, Hench LL. A Gel-Derived Mesoporous Silica Reference Materials for Surface Analysis by Gas Sorption, Part1—Textural Features. Ceram Int. 2000;26:171–8. [Google Scholar]
- 19.Barrett EP, Joyney LG, Halenda PP. The Determination of Pore Volume and Area Distributions in Porous Substances I: Computations from Nitrogen Isotherms. J Am Chem Soc. 1951;73:373–80. [Google Scholar]
- 20.Verhoef AH, DenHartog HW. Infrared Spectroscopy of Network and Cation Dynamics in Binary and Mixed Alkali Borate Glasses. J Non-Cryst Solids. 1995;182:221–34. [Google Scholar]
- 21.Verhoef AH, DenHartog HW. Structure and Dynamics of Alkali Borate Glasses: A Molecular Dynamics Study. J Non-Cryst Solids. 1995;182:235–47. [Google Scholar]
- 22.Clark AE, Hench LL. Early Stages of Calcium-Phosphate Layer Formation in Bioglass. J Non-Cryst Solids. 1989;113:195–202. [Google Scholar]
- 23.Filgueiras MR, LaTorre G, Hench LL. Solution Effects on the Surface Reaction of a Bioactive Glass. J Biomed Mater Res. 1993;27:445–53. doi: 10.1002/jbm.820270405. [DOI] [PubMed] [Google Scholar]
- 24.Rehman I, Bonfield W. Characterization of Hydroxyapatite and Carbonated Apatite by Photo Acoustic FTIR Spectroscopy. J Mater Sci: Mater Med. 1997;8:1–4. doi: 10.1023/a:1018570213546. [DOI] [PubMed] [Google Scholar]
- 25.Nancollas GH, Zhang J. Formation and Dissolution Mechanisms of Calcium Phosphates in Aqueous Systems. In: Brown PW, Constantz B, editors. Hydroxyapatite and Related Materials. CRC Press; Boca Raton, FL: 1994. pp. 473–81. [Google Scholar]
- 26.Peters T. Serum Albumin. Adv Protein Chem. 1985;37:161–245. doi: 10.1016/s0065-3233(08)60065-0. [DOI] [PubMed] [Google Scholar]


