Abstract
INTRODUCTION
The goal of this study was to determine the accuracy of stone composition analysis by commercial laboratories.
METHODS
25 human renal stones with infrared spectroscopy (IR) determined compositions were fragmented into aliquots and studied with micro-computed tomography (CT) to ensure fragment similarity. Representative fragments of each stone were submitted to 5 commercial stone laboratories for blinded analysis.
RESULTS
All laboratories agreed on composition for 6 pure stones. Of 4 stones known to contain struvite, only 2(50%) were identified as struvite by all laboratories. Struvite was reported as a component by some laboratories for 4 stones previously determined not to contain struvite. Overall, there was disagreement regarding struvite in 6(24%) stones. For 9 calcium oxalate (CaOx) stones, all laboratories reported some mixture of CaOx, but the quantities of subtypes differed significantly among laboratories. In 6 apatite containing stones, apatite was missed by the laboratories in 20% of the samples. None of the laboratories identified atazanavir in a stone containing that antiviral drug. One laboratory reported protein in every sample, while all others reported it in only 1 sample. Nomenclature for apatite differed among laboratories, with one reporting apatite as carbonate apatite (CA) and never hydroxyapatite (HA), another never reporting CA and always reporting HA, and a third reporting CA as apatite with calcium carbonate.
CONCLUSIONS
Commercial laboratories reliably recognize pure calculi; however, variability in reporting of mixed calculi suggests a problem with accuracy of stone analysis results. Furthermore, there is a lack of standard nomenclature used by laboratories.
Keywords: calculi, stone composition, micro CT, infrared spectrophotometry, urolithiasis
Introduction
The accuracy of stone composition analysis is not only important in guiding clinical treatment decisions, but also for research that assesses the association of stone composition with pathophysiology of stone disease, treatment outcomes, and long-term disease progression.1–4 Clinically, if infection stones are identified, a more diligent approach to surgical removal of all fragments and prolonged administration of antibiotics will be undertaken.5, 6 Likewise, if calcium stone compositions are identified, a metabolic work-up is generally indicated.7–13 Some non-calcium containing stones such as uric acid and cystine frequently recur and warrant a different approach to the metabolic evaluation. Thus, stone composition can play an important role in guiding the clinical approach to the patient.
There is no accepted standard for conducting stone analysis and hence multiple methods, including wet chemical analysis, infrared spectroscopy (FT-IR), x-ray diffraction, and other methods have been used with variable results.14, 15 One difficulty in assessing accuracy of stone analysis laboratories is that stones are frequently composed of more than one material. Daudon and colleagues studied over 10,000 human renal calculi and found that only 7% were pure.16 For this reason prior studies focusing on the accuracy of stone analyses typically have utilized pure compounds. 14, 15 However, with micro computed tomography (micro CT) scanning we can now nondestructively determine the composition of the entire stone17, and also determine the composition of fragments taken from a stone.
The goal of this study was to test the accuracy of stone composition analysis by major commercial laboratories using human stone samples. Stones were broken into fragments that were verified by micro CT to contain the same materials prior to submission to the laboratories. We found significant discrepancies in the reporting of compositions of mixed stones among the laboratories. Importantly, variability in the detection of struvite casts doubt on the accuracy of current stone analysis procedures.
Materials and Methods
Human urinary stones were obtained from a stone analysis laboratory (Beck Analytical Services, Indianapolis, IN). The specimens used in the present study were large pieces left over after the original stone analysis.
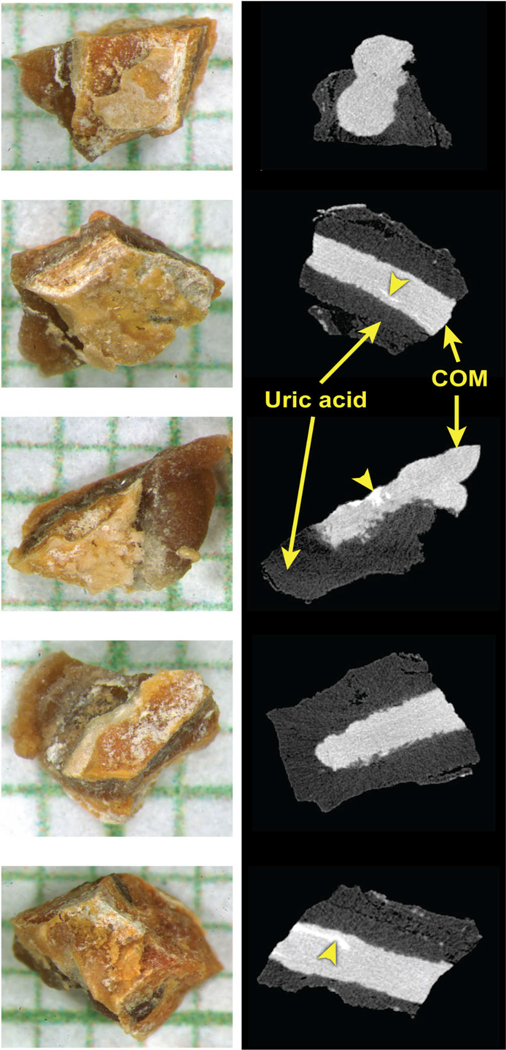
Each stone specimen was photographed, inspected microscopically, and scanned using a Skyscan 1172 micro CT system (Kontich, Belgium) with voxel sizes of 7 µm. Three-dimensional reconstructions of stones were examined using ImageJ (http://rsb.info.nih.gov/ij/) and VOXX2 (http://www.nephrology.iupui.edu/imaging/voxx/) to verify the stone composition and to plan fragmentation. Each stone was hand fragmented into 6 aliquots. Repeat imaging with micro CT was performed on the fragments to ensure similar composition. Of the original 46 stones fragmented only 25 yielded 6 fragments that all appeared to contain the same stone materials (Figure 1). One of the 6 fragments from each stone was kept and further analyzed using stereomicroscopy, microdissection and FT-IR as described by Daudon et al.1, 2, using a Bruker Alpha-T Spectrometer (Bruker Optics, Billerica, MA) and the KBr pellet method. This retained fragment was reported as the “research laboratory” and was considered the reference composition when combined with the micro CT images.
Figure 1.
Example of fragmented stone, showing the samples sent to the 5 laboratories. Images of samples shown on left, on mm grid paper, with representative micro CT slice on right. This stone was mixed uric acid and calcium oxalate monohydrate (COM), which are easily distinguished by micro CT, so that it is certain that each laboratory received a sample containing both materials. Bright white regions (arrowheads) on the micro CT images—seen within the COM—mark areas of apatite, which was present in minor amount in these samples.
Each of the 25 fragmented stones was assigned a fabricated identity. Clinical accounts were arranged with 5 commercial laboratories, and one fragment from each stone was sent to each laboratory, with none of the laboratories aware of the study. All of the laboratories advertised the use of multiple methods of analysis for stones, but the specific methods used were not included in the reports from any of the labs.
Statistics
Variability among laboratories was assessed using coefficient of variation, and the ability to distinguish stone values was tested by two-way analysis of variance with the Tukey method for post hoc testing, using 0.05 as the cutoff value for significance.
Results
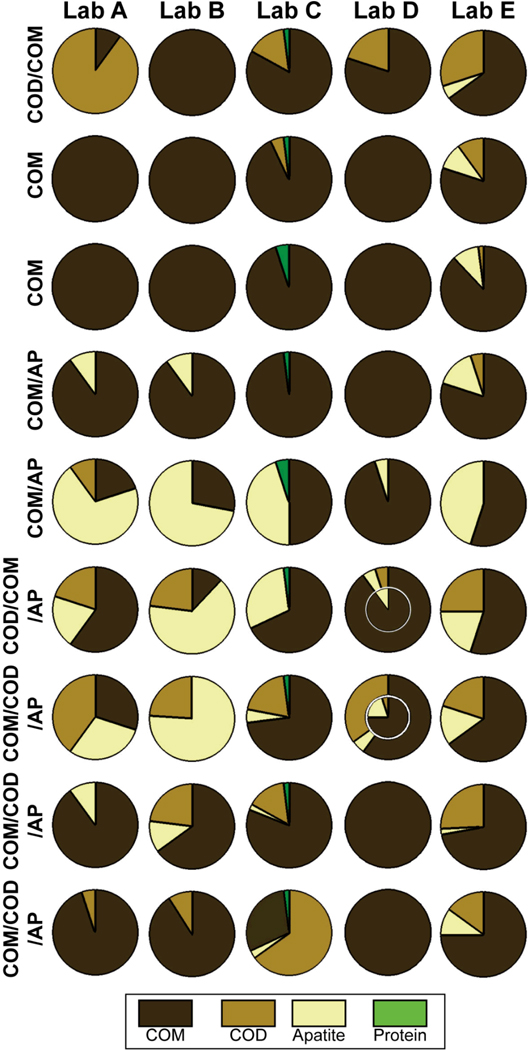
For stones containing calcium oxalate (CaOx) with varying content of apatite, all 5 laboratories correctly reported the general contents of the 9 stones sent for analysis (Figure 2). However, the laboratories did not agree on the major component of 5 of the 9 stones. Using percent content of CaOx monohydrate (COM) as a comparator for these data, analysis of variance showed verification that the stones contained differing amounts of COM (p=0.003), while the laboratories did not consistently differ from one another in their reporting of COM content (p=0.08). The degree with which the 5 laboratories agreed on COM content depended on the nature of the stone sample: When the average COM content was greater than 90% (3 stones), the laboratories gave similar values with a mean coefficient of variation of 8%. However, when the average COM content was less than 90% (6 stones) the laboratories differed dramatically in their reported COM contents (mean coefficient of variation of 47%).
Figure 2.
Results of stone analysis from 5 laboratories (labeled A-E) for 9 calcium oxalate (CaOx) stones. Each row represents a stone that was fragmented into similar samples, one of which was sent to each laboratory. Labels to left indicate composition of stone as determined by micro CT of the original stone and by micro CT-guided dissection and infrared spectroscopy of a sixth sample. Each circle shows composition report by the laboratory; for example, the top left circle shows that Lab A reported the stone as containing 90% COD (CaOx dihydrate) and 10% COM. Nested circles (under Lab D) indicate that report gave details on inner and outer portions of specimen. AP: apatite.
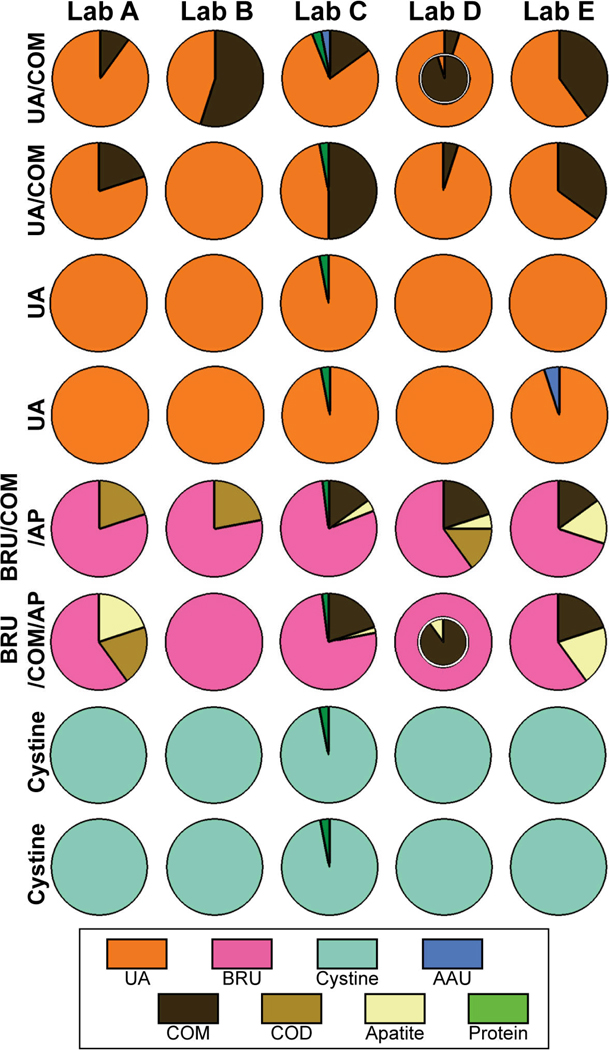
Figure 3 shows the data for stones that were primarily composed of uric acid, brushite, or cystine. Overall the data for these uniform composition stones was more consistent than for the group of stones in Figure 2. Nevertheless, when stones were of mixed composition—for uric acid or for the brushite stones—the reported compositions differed considerably among the laboratories. In some cases—such as the reports of Lab B on the stones in rows 2 and 6—a component that was known to be present in all samples was completely missed.
Figure 3.
Results of stone analysis for non-CaOx metabolic stones. Arrangement of data is as in Figure 2. UA: uric acid; BRU: brushite; AAU: ammonium acid urate. Labels to left indicate composition of stone as in Figure 2.
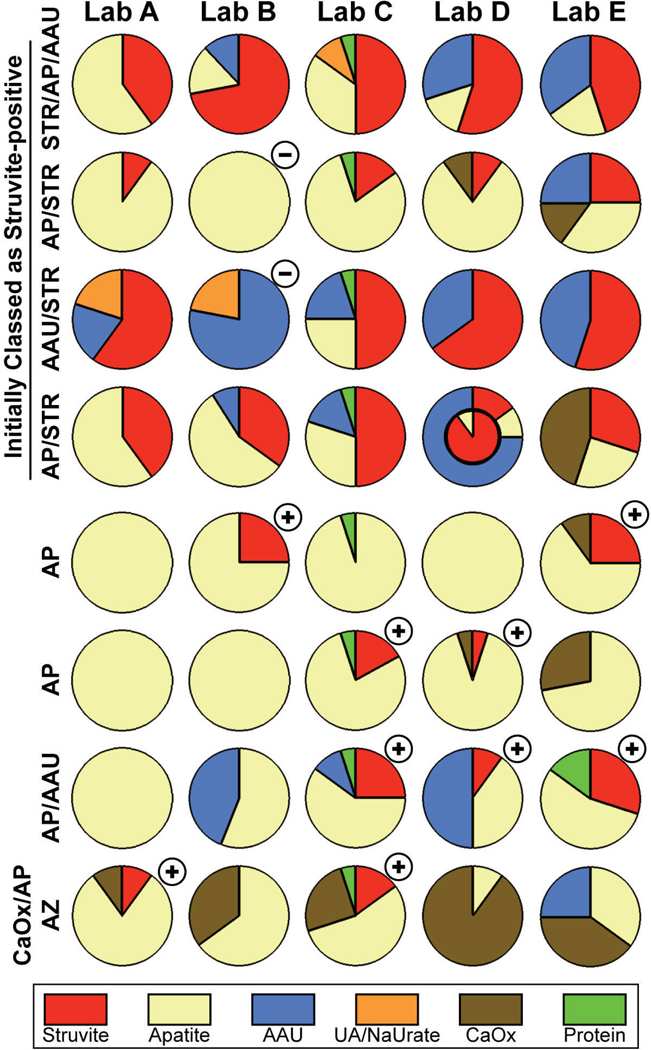
Figure 4 shows data for stones that were reported to contain struvite. Among these are 4 stones that were known to contain struvite, and for which 10% of the reports came back negative for struvite. For the other 4 stones shown, struvite was determined to not be present before the specimens were sent out, but 45% of the reports came back struvite-positive.
Figure 4.
Results of stone analysis for stones related to infection. STR: struvite; NaUrate: sodium urate; AZ: atazanavir. CaOx in this figure combines reports of either COM or COD. Circles marked with a minus (-) show reports that miss struvite that was previously determined to be in the sample. Circles marked with a plus (+) show reports that listed struvite when none was detected in the original stone. Labels to left indicate composition of stone as in Figure 2.
Using apatite content as a comparator for the data in Figure 4, significant variability in reporting can be noted. Analysis of variance of the apatite data in Figure 4 showed that while stones were recognized on average as having different apatite content (p<0.0001), laboratories also differed in their reports of apatite (p=0.002). Correcting for the varying values in the stones, Lab A reported on average higher values for apatite than did other laboratories, while Labs D and E reported lower values on average. The stones with less apatite showed more variability of results: In stones averaging greater than 50% apatite, the average coefficient of variation of reported results was 25%, but with less than 50% apatite content, the coefficient of variation was 101%.
The stone in row 3 of Figure 4 is an illustrative case. Micro CT imaging revealed the stone to be a mass of small, x-ray lucent particles, consistent with the initial analysis of this stone as urates and struvite.17 Thus, the findings of the laboratories of various mixtures of ammonium acid urate, uric acid, and struvite is consistent with the micro CT findings, combined with some variation in sampling of the stone sample by the laboratories. However, micro CT is sensitive for detecting the presence of apatite,17–19 and no apatite was visible in the scan of the original stone nor in the scan of the fragments sent out to the laboratories, so the report of 25% apatite from Lab C is definitely incorrect.
The stone shown in the last row of Figure 4 is a drug stone. This stone was known to contain the antiviral drug, atazanavir, and the fragment retained by us showed on FT-IR the unusual, tapered peaks that are characteristic of that compound.20 None of the 5 laboratories identified this drug as being part of this mixed stone.
Some methods of reporting were consistently different among laboratories. Lab C reported protein in every stone, previously noted by other investigators,21 but which was not reported by other laboratories. Lab D was the only lab to report data on inner and outer portions of stones (as in row 7 of Figure 2). Finally, the nomenclature used for ‘apatite’ differed among laboratories. One laboratory reported all apatite as carbonate apatite, while another laboratory reported only ‘calcium phosphate (apatite).’ Two laboratories reported both carbonate apatite and hydroxyapatite, although neither gave a description of what level of carbonation22 was low enough to be called ‘hydroxyapatite.’ The fifth laboratory reported carbapatite as percentages of apatite and calcium carbonate.
Discussion
Medical prophylaxis to prevent recurrence is still at the core of the treatment of urinary stone disease.23–25 Stone analysis complements but does not replace urine and serum studies to assess for metabolic stone disease.26 However, the stone analysis can present useful information, as it represents a biochemical patient history, documenting the urinary environment over time through type and conformation of crystal deposition. Unfortunately, there is no uniform procedure for conducting stone analysis, which can result in significant inaccuracies.14 Thus, we sought to test the reliability of stone analysis reporting by major commercial laboratories using samples of human stones.
In general, the laboratories in our study accurately reported the composition for relatively pure stones. However, results were concerning for the reporting of struvite and mixed stones. Only 2 stones known to contain struvite were reported as struvite by all laboratories, while struvite was reported as a component for 4 stones determined to contain no struvite pre-submission. A report of struvite in stones can often guide postoperative treatment. If struvite is noted without metabolic components the patient will be treated primarily for the infection post stone extraction with limited further stone evaluation.13 It is generally recommended that the patient receive a prolonged course of antibiotic therapy if they had struvite containing stones, even after complete stone clearance is achieved.27 However, if metabolic components are identified then further metabolic evaluation is generally warranted.12, 13, 27 In the current study struvite was inconsistently reported in over one fourth of the cohort.
The variability in the reporting of mixed stones is represented in the numerical analysis for COM and apatite. For COM, reports for stones containing less than 90% COM differed dramatically in their reported values, with an average coefficient of variation close to 50%. For apatite, the results were worse, with values for apatite as a minor component having a coefficient of variation exceeding 100%. The data also show specific instances in which a component, apatite, was known to be present in the samples, and yet was completely missed by 1 or more laboratories.
Further reporting errors were noted with the atazanavir stone, which was not identified by any of the 5 laboratories. For a laboratory to detect rare stone components, reference spectra must be available and the technician reading the spectrum needs a high index of suspicion.15 In the current study the only laboratory to identify the atazanavir stone was the research laboratory, which was alerted to the possibility of a drug stone present in the study. Thus, to accurately detect rare stone components clinicians should communicate with the laboratory performing the analysis and alert them to the possibility of a rare component stone when appropriate.
In prior studies utilizing artificial samples, similar variability in reporting has been identified and was attributed to differences in analysis technique. Quality control studies conducted in Europe from 1980 to 2001 demonstrated that overall accuracy of stone analyses was improving with time and experience.15 The authors noted that FT-IR and x-ray diffraction methods were most reliable for artificial stone substances, but wet chemical methods produced an error rate from 6.5–94%. Kasidas and colleagues also noted that wet chemical analysis of stones was the least accurate method.14 With the utilization of artificial samples they were able to quantify a 30% error rate in laboratory reporting of stone analyses. Such studies give us an indication that there are inherent errors in stone analyses, but they do not reflect the real clinical environment where most patients have mixed stones16 and laboratories must deal with real stone specimens. The present study suggests that the error rates are indeed high when real, mixed stones are analyzed.
Most likely the errors detected in this study were the result of incomplete sampling by the commercial laboratories. If the stone is not carefully examined by fine microscopic dissection then different areas of crystallization within the stone will be missed and not analyzed for composition. We have noted through micro CT that stones can have different cores, shells, eccentric foci and layering.17 Thus, if the stone is not properly dissected and only a portion is examined with IR or x-ray diffraction the true mixed composition will not be reported.
The use of micro CT is a unique aspect of the present study. Micro CT can reveal great detail in stone structure, and it is possible for mineral components to be identified by a combination of x-ray attenuation values and morphological appearance.17, 28, 29 Its use in commercial stone analysis has not yet been exploited, probably because of cost, with micro CT systems costing about 10 times more than systems for FT-IR. Micro CT was used in the present study to verify the compositional similarity of the specimens sent out to the commercial laboratories, and also to guide the dissection of the retained specimen to maximize the detection of minor mineral components. Micro CT is especially sensitive to the presence of apatite17–19 and so the presence or absence of that substance can be stated with great confidence. However, for minerals with lower x-ray attenuation, such as struvite, it is not always possible to identify a minor inclusion as being a particular mineral. This is a weakness of the present study; coherent x-ray scatter,30 which can visualize even small regions of struvite in stones, would be useful for future studies on the ability of commercial laboratories to correctly identify struvite in stone specimens.
With existing technology, several steps could increase the reliability of stone analysis. Because incomplete sampling leads to errors, all stones obtained by the patient or surgeon should be submitted for analysis; this gives the analysis laboratory the best chance to detect all components that are present. Also, procedures in stone analysis laboratories need to be capable of accurately assessing mixed stones. This is a potentially complex problem that deserves in depth consideration beyond the scope of the present study. However, our experience points to utilization of micro CT as a possible means to provide sensitive and unambiguous detection of mixed mineral components, while preserving the original structure of the stone. The interpretation of stone analysis reports would also benefit from standardization of the nomenclature for stone composition. Specifically, terminology for the different forms of apatite should be defined and standardized for use by all laboratories.
Conclusions
Commercial laboratories can reliably diagnose pure calculi; however, there is enough variability in both qualitative and quantitative results of mixed calculi to suggest a problem with reproducibility of stone analysis results. We noted a tremendous variability in analysis of infection stones, with the struvite component not agreed upon by the laboratories in over a fourth of the cohort. The presence of a metabolic component mixed with struvite was also variably reported. Furthermore, there is a lack of standardization of nomenclature used by laboratories. These findings call for further investigation of stone analysis procedures and reporting, and for the development of a standardized analysis/reporting protocol.
Acknowledgements
Supported by NIH R01 DK59933. The authors thank Christian Beuschel for technical assistance.
References
- 1.Daudon M. Analyse et classification des calculs: contribution à l’etiologie de la maladie lithiasique [Analysis and classification of calculi: contribution to the etiology of calculous disease] Revue medicale de la Suisse romande. 2004;124:445. [PubMed] [Google Scholar]
- 2.Daudon M, Bader CA, Jungers P. Urinary calculi: review of classification methods and correlations with etiology. Scanning Microsc. 1993;7:1081. [PubMed] [Google Scholar]
- 3.Mandel G, Mandel N. Analysis of stones. In: Coe FL, Favus MJ, Pak CYC, et al., editors. Kidney Stones: Medical and Surgical Managemant. Philadelphia: Lippencott-Raven; 1996. pp. 323–335. [Google Scholar]
- 4.Schubert G. Stone analysis. Urol Res. 2006;34:146. doi: 10.1007/s00240-005-0028-y. [DOI] [PubMed] [Google Scholar]
- 5.Goldstone L, Griffith DP. Infection calculi. In: Wickham JEA, Buck AC, editors. Renal Tract Stone. Metabolic Basis and Clinical Practice. London: Churchill Livingstone; 1990. [Google Scholar]
- 6.Abrahams HM, Stoller ML. Infection and urinary stones. Current Opinion in Urology. 2003;13:63. doi: 10.1097/00042307-200301000-00011. [DOI] [PubMed] [Google Scholar]
- 7.Pak CY. Should patients with single renal stone occurrence undergo diagnostic evaluation? J Urol. 1982;127:855. doi: 10.1016/s0022-5347(17)54106-3. [DOI] [PubMed] [Google Scholar]
- 8.Strauss AL, Coe FL, Parks JH. Formation of a single calcium stone of renal origin. Clinical and laboratory characteristics of patients. Arch.Intern.Med. 1982;142:504. [PubMed] [Google Scholar]
- 9.Coe FL, Keck J, Norton ER. The natural history of calcium urolithiasis. JAMA. 1977;238:1519. [PubMed] [Google Scholar]
- 10.Ljunghall S, Danielson BG. A prospective study of renal stone recurrences. Br J Urol. 1984;56:122. doi: 10.1111/j.1464-410x.1984.tb05346.x. [DOI] [PubMed] [Google Scholar]
- 11.Williams RE. Long-term survey of 538 patients with upper urinary tract stone. Br J Urol. 1963;35:416. [PubMed] [Google Scholar]
- 12.Wall I, Hellgren E, Larsson L, et al. Biochemical risk factors in patients with renal staghorn stone disease. Urology. 1986;28:377. doi: 10.1016/0090-4295(86)90065-8. [DOI] [PubMed] [Google Scholar]
- 13.Lingeman JE, Siegel YI, Steele B. Metabolic Evaluation of Infected Renal Lithiasis: Clinical Relevance. J Endourol. 2009;9:51. doi: 10.1089/end.1995.9.51. [DOI] [PubMed] [Google Scholar]
- 14.Kasidas GP, Samuell CT, Weir TB. Renal stone analysis: why and how? Ann Clin Biochem. 2004;41:91. doi: 10.1258/000456304322879962. [DOI] [PubMed] [Google Scholar]
- 15.Hesse A, Kruse R, Geilenkeuser WJ, et al. Quality control in urinary stone analysis: results of 44 ring trials (1980–2001) Clinical Chemistry and Laboratory Medicine. 2005;43:298. doi: 10.1515/CCLM.2005.051. [DOI] [PubMed] [Google Scholar]
- 16.Daudon M, Donsimoni R, Hennequin C, et al. Sex and age-related composition of 10617 calculi analyzed by infrared-spectroscopy. Urol Res. 1995;23:319. doi: 10.1007/BF00300021. [DOI] [PubMed] [Google Scholar]
- 17.Zarse CA, McAteer JA, Sommer AJ, et al. Nondestructive analysis of urinary calculi using micro computed tomography. BMC Urology. 2004;4:15. doi: 10.1186/1471-2490-4-15. [DOI] [PMC free article] [PubMed] [Google Scholar]
- 18.Williams JC, Jr., Zarse CA, Jackson ME, et al. Variability of protein content in calcium oxalate monohydrate stones. J Endourol. 2006;20:560. doi: 10.1089/end.2006.20.560. [DOI] [PMC free article] [PubMed] [Google Scholar]
- 19.Miller NL, Gillen DL, Williams JC, Jr, et al. A formal test of the hypothesis that idiopathic calcium oxalate stones grow on Randall's plaque. BJU International. 2009;103:966. doi: 10.1111/j.1464-410X.2008.08193.x. [DOI] [PMC free article] [PubMed] [Google Scholar]
- 20.Daudon M. Les nouveaux constituants des calculs urinaires. Feuillets de Biologie. 2007;48:19. [Google Scholar]
- 21.Ryall RL. Macromolecules and Urolithiasis: Parallels and Paradoxes. Nephron Physiology. 2004;98:37. doi: 10.1159/000080262. [DOI] [PubMed] [Google Scholar]
- 22.Carpentier X, Daudon M, Traxer O, et al. Relationships Between Carbonation Rate of Carbapatite and Morphologic Characteristics of Calcium Phosphate Stones and Etiology. Urology. 2009;73:968. doi: 10.1016/j.urology.2008.12.049. [DOI] [PubMed] [Google Scholar]
- 23.Fine JK, Pak CY, Preminger GM. Effect of medical management and residual fragments on recurrent stone formation following shock wave lithotripsy. J Urol. 1995;153:27. doi: 10.1097/00005392-199501000-00010. [DOI] [PubMed] [Google Scholar]
- 24.Coe FL. Treated and untreated recurrent calcium nephrolithiasis in patients with idiopathic hypercalciuria, hyperuricosuria, or no metabolic disorder. Ann Intern Med. 1977;87:404. doi: 10.7326/0003-4819-87-4-404. [DOI] [PubMed] [Google Scholar]
- 25.Pearle MS, Roehrborn CG, Pak CY. Meta-analysis of randomized trials for medical prevention of calcium oxalate nephrolithiasis. J Endourol. 1999;13:679. doi: 10.1089/end.1999.13.679. [DOI] [PubMed] [Google Scholar]
- 26.Kourambas J, Aslan P, Teh C, et al. Role of stone analysis in metabolic evaluation and medical treatment of nephrolithiais. J. of Endourology. 2001;15:181. doi: 10.1089/089277901750134548. [DOI] [PubMed] [Google Scholar]
- 27.Lingeman JE, Siegel YI, Steele B. Metabolic evaluation of infected renal lithiasis: Clinical relevance. J Endourol. 1995;9:51. doi: 10.1089/end.1995.9.51. [DOI] [PubMed] [Google Scholar]
- 28.Preminger GM, Assimos DG, Lingeman JE, et al. Chapter 1: AUA guideline on management of staghorn calculi: Diagnosis and treatment recommendations. J Urol. 2005;173:1991. doi: 10.1097/01.ju.0000161171.67806.2a. [DOI] [PubMed] [Google Scholar]


