Abstract
The tracking and compensation of patient motion during a magnetic resonance imaging (MRI) acquisition is an unsolved problem. For brain MRI, a promising approach recently suggested is to track the patient using an in-bore camera and a checkerboard marker attached to the patient’s forehead. However, the possible tracking range of the head pose is limited by the fact that the locally attached marker must be entirely visible inside the camera’s narrow field of view (FOV). To overcome this shortcoming, we developed a novel self-encoded marker where each feature on the pattern is augmented with a 2-D barcode. Hence, the marker can be tracked even if it is not completely visible in the camera image. Furthermore, it offers considerable advantages over the checkerboard marker in terms of processing speed, since it makes the correspondence search of feature points and marker-model coordinates, which are required for the pose estimation, redundant. The motion correction with the novel self-encoded marker recovered a rotation of 18° around the principal axis of the cylindrical phantom in-between two scans. After rigid registration of the resulting volumes, we measured a maximal error of 0.39 mm and 0.15° in translation and rotation, respectively. In in-vivo experiments, the motion compensated images in scans with large motion during data acquisition indicate a correlation of 0.982 compared to a corresponding motion-free reference.
Keywords: Motion estimation, Prospective motion compensation, Optical motion tracking, Real-time, Neuro-MRI
1. Introduction
1.1. Clinical Application
Patient motion during data acquisition remains a challenging problem in MRI. Although the patient is asked to maintain a steady body position during a scan, motion may not always be avoided. In many cases children, elderly people or patients suffering from certain medical conditions (e.g. Parkinsons disease, stroke) hardly satisfy the need to stay still during an MRI exam. Motion within an MRI examination may result in significant image artifacts. These often lower the diagnostic confidence of the image data and require a repetition of the scan.
The anatomical structure of the human head allows a description of the motion using the rigid body model. Motion during acquisition can be corrected by estimating the six degrees of freedom, i.e. three translations and three rotations for each of the orthogonal axes. Thus, by estimating the motion during data acquisition, it can be compensated and no repetition of the scan is required. This may increase patient throughput in daily clinical workflow.
1.2. State of the art
Motion correction in MR can be performed either retrospectively or prospectively. In retrospective motion correction, the effects of motion are compensated after MR data acquisition is over. One of such techniques is to perform image-based registration of multiple acquired volumes for dynamic scans (Kochunov, P. and Lancaster, J. L. and Glahn, D. C. and Purdy, D. and Laird, A. R. and Gao, F. and Fox, P., 2006). Accounting for motion within a volume provides an improvement of this method. Therefore individual slices are registered to a reference volume (i.e. slice-to-volume registration) (Kim, B. and Boes, J. L. and Bland, T. L. and Meyer, C. R., 1999). Even further, motion can also corrupt individual slices for segmented scans (i.e. intra-scan motion). In this case, self-navigated acquisitions (Pipe J. G., 1999) can be used. Another method employed in the presence of intra-scan motion is to acquire additional data (i.e. navigator data) on top of the regular imaging data to measure and correct for motion (Aksoy M., Liu C., Moseley M., and Bammer R., 2006). One disadvantage of retrospective methods is that complete sampling of the Fourier space (i.e. k-space) cannot be guaranteed in the presence of motion (Bammer R., and Aksoy, M., and Liu, C., 2007). Furthermore, these methods require an interpolation of non-Cartesian data on the Cartesian grid, which may cause blurring.
On the other hand, prospective motion correction compensates for motion during data acquisition. In neuro MRI this can be achieved by changing the scanner coordinate system according to the patient’s head position in real-time. However, this implies a real-time detection of the patient’s pose during the scan. In one such application called prospective acquisition correction (PACE) (Thesen S., Heid O., Mueller E., and Schad L. R., 2000), the volumes acquired during a function MRI (fMRI) scan are coregistered and used to correct for motion in real-time. However, in this case, the motion during the acquisition of one volume is assumed to be negligible, which cannot always be satisfied. Additional introduced navigator echoes, similar to those used for retrospective motion correction, are also used to prospectively correct for patient motion between successive data acquisition intervals (White N., Roddey C., Shankaranarayanan A., Han E., Rettmann D., Santos J., Kuperman K., and Dale A. M., 2010). In another prospective method active markers (Ooi M. B., Krueger S., Thomas W. J., Swaminathan S. V., and Brown T. R., 2009) in form of spheres filled with water and enclosed by micro radio frequency (RF)-coils can be attached to the patient’s forehead. In this setup a low flip angle RF-pulse excites the active markers. The pose is estimated during data acquisition using the response of the micro RF-coils.
Another variation of prospective motion correction methods includes the utilization of external tracking systems. In one approach, external optical systems outside the scanner bore were used to track a marker attached to the patient’s head (Dold C., Zaitsev M., Speck O.,Firle E. A., Hennig J., and Sakas G., 2005; Zaitsev M., Dold C., Sakas G., Hennig J., and Speck O., 2006). Drawback of this system is that it requires an uninterrupted line of sight between the marker inside the scanner and the optical system. Aksoy et al. (Aksoy M., Newbould R., Straka M., Holdsworth S., Skare S., Santos J., and Bammer R., 2008) introduced a motion correction system using an in-bore camera. In this approach, an MR-compatible camera is mounted on the head coil, tracking the position and orientation of a checkerboard marker attached to the patients forehead. One essential constraint of this method is that if the marker is occluded by another object or is partly outside the camera’s field of view (FOV), no motion correction is possible anymore. The marker can go partly outside of the camera image by large head motions due to the restricted space inside the scanner bore, which constraints camera-marker distances to 5 and 7 cm. This delimits the possible tracking range of the patient’s head position. Additionally, the shape of different coil types may occlude parts of the camera FOV. To overcome these limitations, we developed the self-encoded marker (Forman C., Aksoy M., Hornegger J., and Bammer. R., 2010) with additional codes for each feature point.
1.3. Outline
In this paper, we introduce a novel marker for optical prospective motion correction in MRI. First, the optical prospective motion correction system is briefly described. Then, the characteristics of the self-encoded marker to circumvent the limitations of the checkerboard marker are discussed. This is followed by a specification of the required modifications for the algorithm to estimate the marker pose. Finally, an evaluation of the self-encoded marker in comparison to the checkerboard marker was performed inside and outside the scanner.
2. Optical Prospective Motion Correction System
2.1. System setup
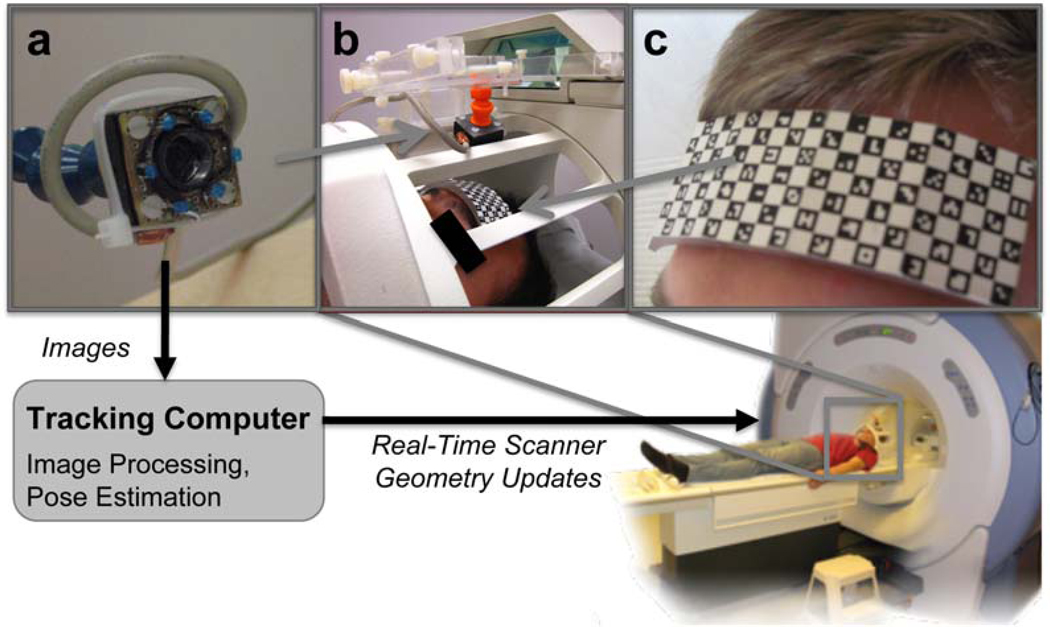
The motion correction system was implemented on a GE Signa 1.5T whole body scanner (GE Healthcare, Milwaukee, WI). Figure 1 shows the setup of the system. A single camera (Swann Communications USA Inc., CA 1/3” sensor, 380 TV lines) was mounted on the head coil to monitor the patient during the scan. Magnetic parts of this camera had been replaced to make it MR-compatible. Furthermore, camera and cable were shielded to reduce the impact of RF pulses on the video signal. Infrared diodes were placed on the camera body to illuminate the scene inside the scanner bore. Outside the scanner room the analog video signal was converted to digital using a frame-grabber (Kworld Xpert, Kworld, Taiwan). An independent tracking computer processed the images of the camera. To achieve reliable and robust features for the tracking, a marker was attached to the patients forehead. In this study, we also compared the pose estimates obtained by the checkerboard marker (Aksoy M., Liu C., Moseley M., and Bammer R., 2006) with those of our novel self-encoded marker design. Next paragraph provides a more detailed description of the latter marker and its detection. In each camera frame the marker was detected and features were extracted. These features served as input to evaluate the 3-D pose of the marker relative to the camera. Assuming rigid head motion, these estimates described the current head position and were used to adjust gradient and RF hardware controller of the MR scanner to compensate for motion. Therefore, the tracking computer was linked to the MR sequencer via Gigabit Ethernet connection sending the pose updates in real-time. The pose estimates of the initial patient position at the first data acquisition were used as reference. During the scan the MR imaging plane was adjusted to the detected pose changes. That way, the scanned anatomy and not the scanner geometry determined the slice position and orientation. However, frame rate of the camera, detection and pose estimation of the marker and the transfer of the pose updates to the scanner introduced an additional latency to the entire system. Thus, if a large difference in rotation and translation of two subsequent pose updates was detected, the current data acquisition was disregarded and repeated.
Figure 1.
Setup of the optical motion correction system: the MR compatible camera (a) was mounted on the 8 channel head coil (b). Reliable features for optical tracking of the patient were provided by the self-encoded marker (c). During data acquisition the camera signal was processed by an external tracking computer to estimate the pose updates. These were sent to the MR scanner via network connection to adjust gradient and RF hardware controller for prospective motion compensation in real time.
For effective motion compensation in the MR image plane, the estimated motion of the marker relative to the optical system had to be transformed into the scanner frame of reference. To achieve this, at the beginning of each MR study, a scanner-camera cross-calibration (Aksoy M., Forman C., Straka M., Skare S., Holdsworth S., Hornegger J., and Bammer, R., 2011) was performed to estimate this transformation.
2.2. Self-encoded Marker
2.2.1. Marker Design
Basis of the self-encoded marker is the checkerboard pattern. On this black and white checkerboard pattern, adjacent corners of neighboring quads describe the feature points. Using the perspective camera model each feature point of the marker-model is projected on the camera image plane. Given a calibrated camera and a known correspondence between detected feature point in the camera image and its representation in the marker-model geometry, the pose of the marker can be estimated by inverting this projection. The planar checkerboard pattern provides no information for an independent identification of each feature point. However, the restricted space inside the scanner bore allowed only a camera to object distance up to 7 cm, which limited the camera FOV. Thus, large motion of the patients head leads part of the marker to stay outside the camera image. Furthermore, since the camera is mounted on the head coil, the line of sight to the patients forehead may partly occluded by the coil elements. Both scenarios result in a partly visible marker. If checkerboard marker is used, partial occlusion of the marker prevents features from being identified and no tracking is possible.
Additional information in form of machine-readable codes allow an independent determination of each feature position in the marker-model geometry from whether or not other features were present in the camera image. For this purpose, we used a unique code to specify each feature on the marker. Codes in form of 2-D barcodes similar to the ARTag marker (Fiala M., 2005) were embedded within the black quads of the self-encoded marker. In contrast to the ARTag marker, we also used a 9bit (3 × 3) encoding instead of 36 bit (6 × 6) for the code. Some of the additional bits in the ARTag marker contained redundant information, which permitted an intrinsic verification and correction of the recognized code. In favor of an increased visual representation of each individual bit on the marker, we reduced the number of bits for the self-encoded marker. This resulted in a more robust recognition of the code within the camera image. However, any redundant information in the code was removed. To account for different orientations of the marker relative to the camera image, rotational equivalence classes of the two-dimensional code were removed from the library of code words. Thus, the library of code words for the self-encoded marker was reduced to 138 unique binary codes.
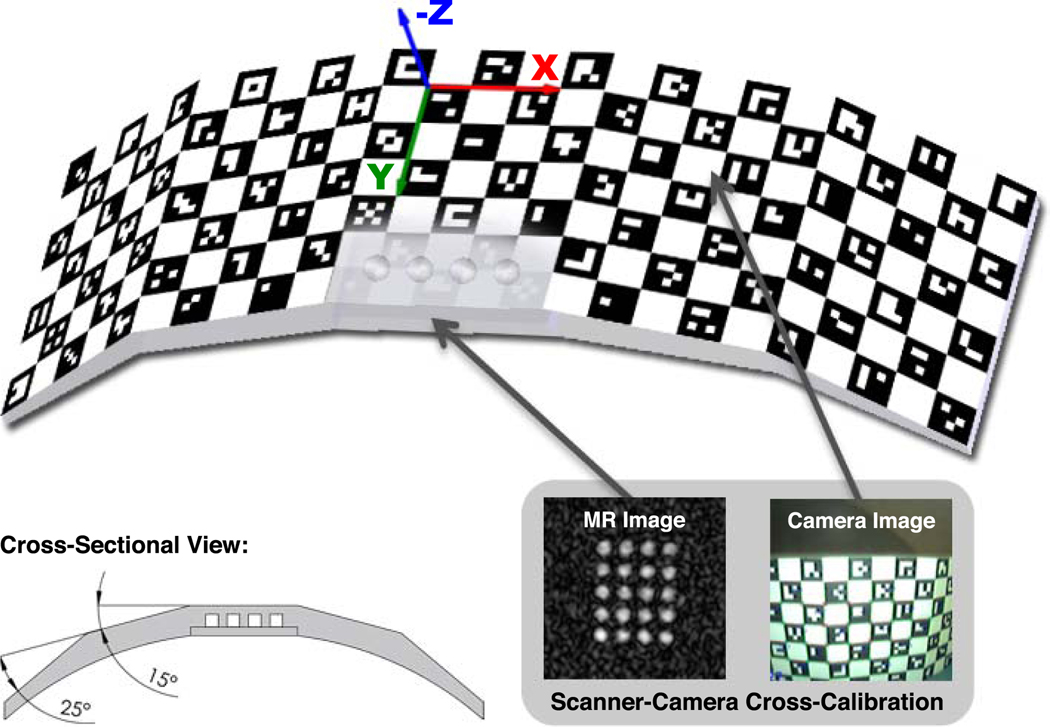
The independent identification of each feature on the marker allowed a detection of the marker pose although the marker is only partly visible. That way, the possible tracking range was defined by the size of the marker and not the camera FOV. This enabled different sizes and geometrical shapes for the marker design. For the shape of the self-encoded marker we divided the checkerboard pattern into five planar parts of equal size (Figure 2). As shown in the cross-sectional view, the four outer parts are bend symmetrically by 25° and 15°, respectively. The reverse side of the marker is convex shaped to fit the surface of the average human forehead. This provides sufficient space to attach it rigidly to the forehead using Velcro strip. Cylindrical holes were drilled below the corner of the central checkerboard pattern. These were filled with MR-detectable agar to make the marker visible to the MR scanner. Detecting the marker pose relative to the scanner frame of reference in the resulting MR image and a simultaneously estimated marker pose relative to the camera, the transformation from camera to scanner space can be evaluated. This procedure is also known as scanner-camera cross-calibration.
Figure 2.
Drawing of the self-encoded marker with the coordinate system of the marker-model geometry. The outer parts of the marker are bended symmetrically by 25° and 15° as seen in cross-sectional view. Embedded agar droplets make the marker visible in the MR images, which is required for scanner-camera cross-calibration.
2.2.2. Marker Detection
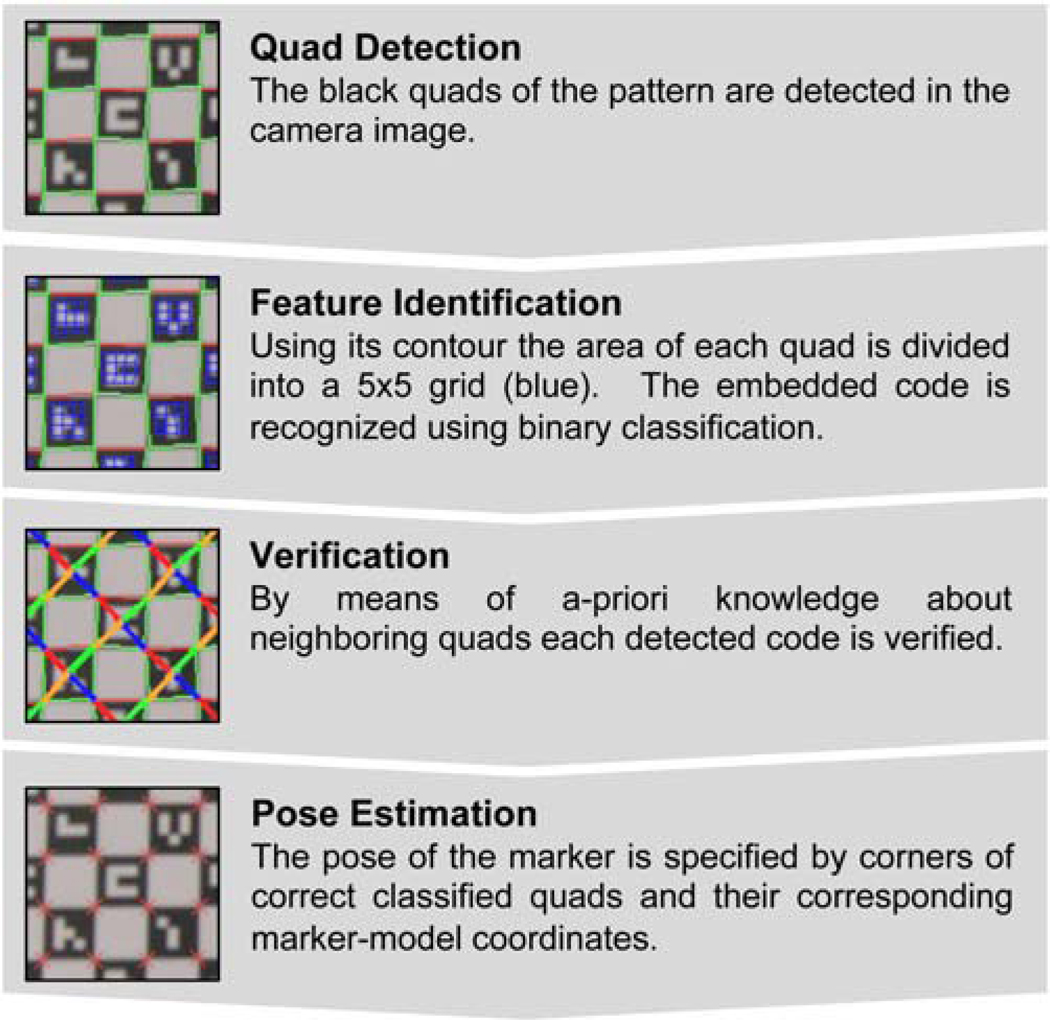
The marker detection of the self-encoded marker can be divided into four sub-steps: quad detection, feature identification, verification, and pose estimation. Figure 3 shows a plot of the workflow of the entire algorithm. The algorithm was written using the computer vision library OpenCV (Bradski, 2000).
Figure 3.
Workflow diagram of the detection algorithm for the self-encoded marker. This algorithm can be divided into quad detection, feature identification, verification, and pose estimation.
Quad Detection
The captured camera image was converted to binary using thresholding. In this image, a contour detection algorithm (OpenCV: cvFindContours)was used to determine the outline of black quads in the underlying checkerboard pattern of the self-encoded marker. Since we were searching for the contour of the quads, only quadrangular contours found by this algorithm were used for further processing. Moreover, to accelerate processing speed and robustness of following procedures, quads below a preliminary defined size were rejected. The rejection parameter was chosen according to the resolution of the camera image and camera marker distance to allow a detection of the marker in a distance up to 9 cm. In order to address various lighting conditions and inhomogeneous illumination within the camera image, this contour detection was sequentially repeated with different threshold levels for binarization. For the self-encoded marker we were using five different thresholds equally distributed over the range of the grayscale image. At the end of the quad detection, all detected quadrangular contours were combined into one group for further processing (OpenCV: cvSeqPartition).
Feature Identification
Given the set of quads, the identification was performed for each quad separately. Using the detected boundary, the interior region of each detected quad was sampled into a 5 × 5 grid as seen in Figure 3(Feature Identification). While the outermost elements in this grid represented the border around the code, the inner 3 × 3 matrix contained the code word. Within this matrix, each element contained the visual representation of one digital bit, which was either white (“1”) or black (“0”). Each code in our library has at least one occurrence of a white or black element. For the identification of the code the mean gray value in each element of this inner 3 × 3 matrix was evaluated. The mean value of minimum and maximum of these nine estimated values determine the threshold for binarization. This adaptive threshold provided a fully automated and robust process, which was independent of the illumination of the camera image.
Verification
On the checkerboard pattern neighboring quads share mutual corners. The detected contour from the quad detection provides only a rough approximation of the actual boundary of the underlying quad. Thus, originally adjacent quads did not share a common corner. Nearest neighbor algorithm was applied to find these common corners. Detected mutual points of two neighboring quads were averaged and used as common corner. Another effect of this optimization of corner coordinates was the generation of a mesh of neighboring quads. Given the known pattern including the embedded codes of the self-encoded marker, a mesh of all neighboring quads on the pattern was loaded in a look-up table at the start of the software. Thus, this information can be exploited to verify the recognized codes. Instead of verifying each code independently as performed for the ARTag marker, we used the recognized codes of neighboring quads for verification. Therefore, each recognized code of one quad and its neighboring quads was compared to the ground truth information provided by this look-up table. A code was correctly classified, if at least 50% of the detected neighboring quads match the known marker geometry.
Pose Estimation
Finally, detected common corners of correct detected quads were iteratively optimized to sub-pixel accuracy using orthogonal gradients of intersecting edges in this point (OpenCV: cvFindCornerSubPix). Then, the pose of the marker was estimated using the detected and optimized corners and their corresponding marker-model coordinates (OpenCV: cvFindExtrinsicCameraParams2).
3. Experiments and Results
3.1. Accuracy
We performed experiments outside the scanner using computer-controlled motion to evaluate the accuracy of the pose estimates. Separate experiments were carried out to compare accuracy of the well-established checkerboard without self-encoded marker for translational and rotational motion. During the entire experiment a calibrated camera was tracking the marker and its pose was estimated using the captured camera images. The camera was calibrated with the checkerboard pattern (Tsai, 1987). Based on the notation of Aksoy et al. (Aksoy M., Forman C., Straka M., Skare S., Holdsworth S., Hornegger J., and Bammer, R., 2011) and homogeneous coordinates, let T be a transformation matrix containing rotation and translation in one 4 × 4 matrix. The initial position of each marker m at the beginning of an experiment relative to the camera c was defined by Tm0→c. This estimated position was used as reference. During the experiment the estimated marker pose at time i was described by Tmi→c. Each subsequent motion conducted by the computer-controlled unit was specified relative to the initial position by:
| (1) |
Accuracy was measured by comparing the estimated motion Tm0→mi and actual performed motion. For translation, the error is obtained by the difference of the norm of estimated translation and the actual performed motion. The measured rotational motion in the 3 × 3 rotation matrix was transformed by Rodrigues rotation formula into the axis-angle representation. In this representation, a vector describes the axis of rotation, while its norm specifies the angle of counter-clockwise rotation. In our experiments, rotation was performed around one axis only, rotational error was estimated by difference of performed and measured rotation.
3.1.1. Translational Motion
For the experiment with translational motion, the marker was mounted on a linear stage (LEZ 1, Isel Automation, Germany), which performed a linear motion with an accuracy of 0.1 mm. In the first experiment the linear stage was arranged perpendicular to the camera image plane. The marker was rigidly attached to the linear stage, whereby the vector defining the motion of the stepwise linear motion was parallel to the optical axis of the camera (i.e. z-translation). In this experiment the camera marker distance was increased in steps of 2 mm and using 10 steps starting with an initial distance of 7 cm. In the second experiment the linear stage was aligned parallel to the camera image plane (i.e. x-translation). At the beginning of the experiment, the marker was placed at a distance of 8 cm at the left edge of the camera image. Throughout the experiment the marker was moved parallel to the camera image plane in steps of 2 mm using 20 iterations. Since no rotation was performed in both experiments with translational motion, any rotational component detected by the pose estimation was considered as an error.
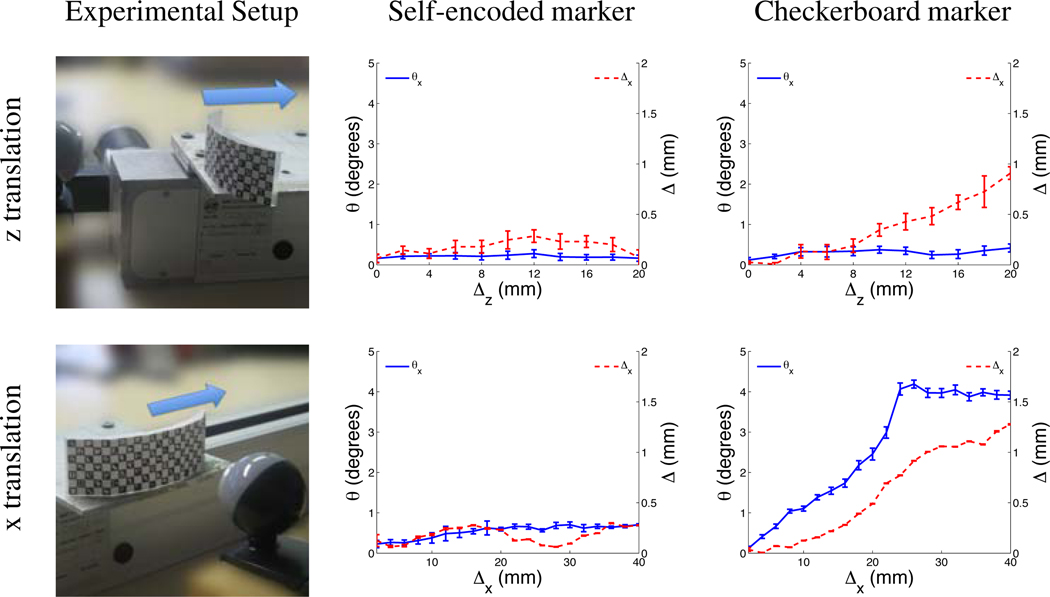
It was possible to track translational motion with high accuracy using the self-encoded marker. For the first experiment, where translation increased the camera-marker distance, the measured error was 0.2 mm after a translation of 20 mm (Figure 4, z translation). For the second experiment, the measured error was 0.3 mm after a total translation of 40 mm (Figure 4,× translation). Both experiments showed a measured error below 0.7° in rotation. In the same experiments, the checkerboard marker exhibited an error that increased linearly with marker position. For the checkerboard marker, the error in measured translation was 0.7 mm and 1.3 mm after translation of 20 mm in z-direction and 40 mm in x-direction, respectively. For the same experiments, the errors in detected rotation were 0.2° and 4° for the checkerboard marker.
Figure 4.
System setup and measured error of estimated translation and rotation using self-encoded and checkerboard marker for experiments with z-translation and x-translation
3.1.2. Rotational Motion
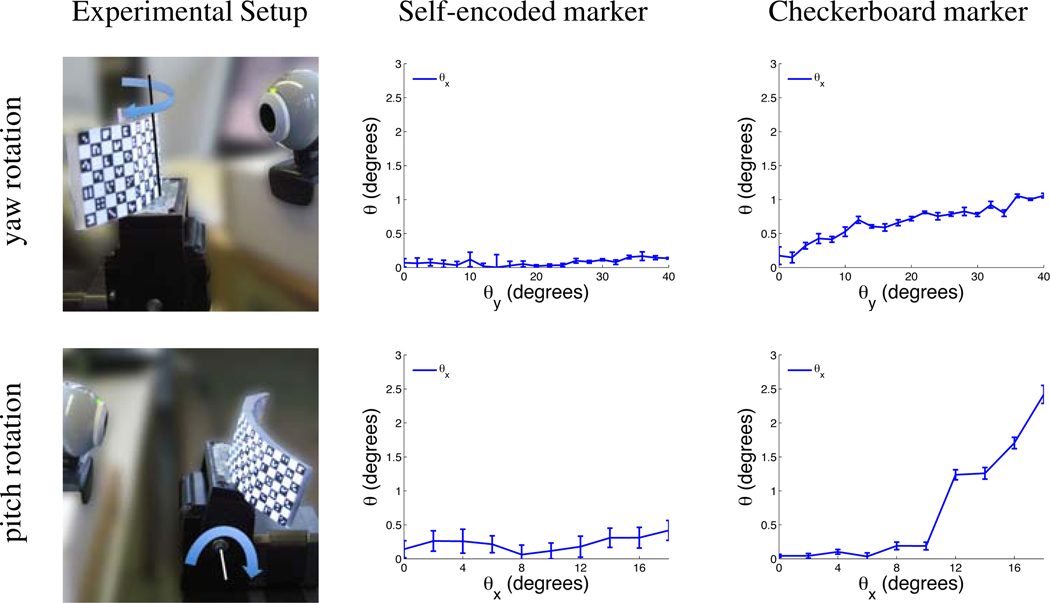
For the evaluation of rotational motion, both markers were attached to a pan-tilt unit (PTU-D46, Direct Perception, USA) as shown in Figure 5. This unit consisted of two stepper motors, which were able to perform programmable pitch and yaw motion with a resolution of 0.013°. Experiments with yaw and pitch rotation were carried out independently. In the first experiment, yaw motion was performed to simulate a patient head rotation around the superior-inferior (SI) axis. Using an initial camera marker distance of 8 cm, a rotation of 40° was conducted progressively with steps of 2°. In the second experiment, the accuracy of the optical system for pitch motion was evaluated. This motion simulates a patient nodding his/her head. The rotation was performed with 10 steps of each 2° at a camera marker distance of 8 cm.
Figure 5.
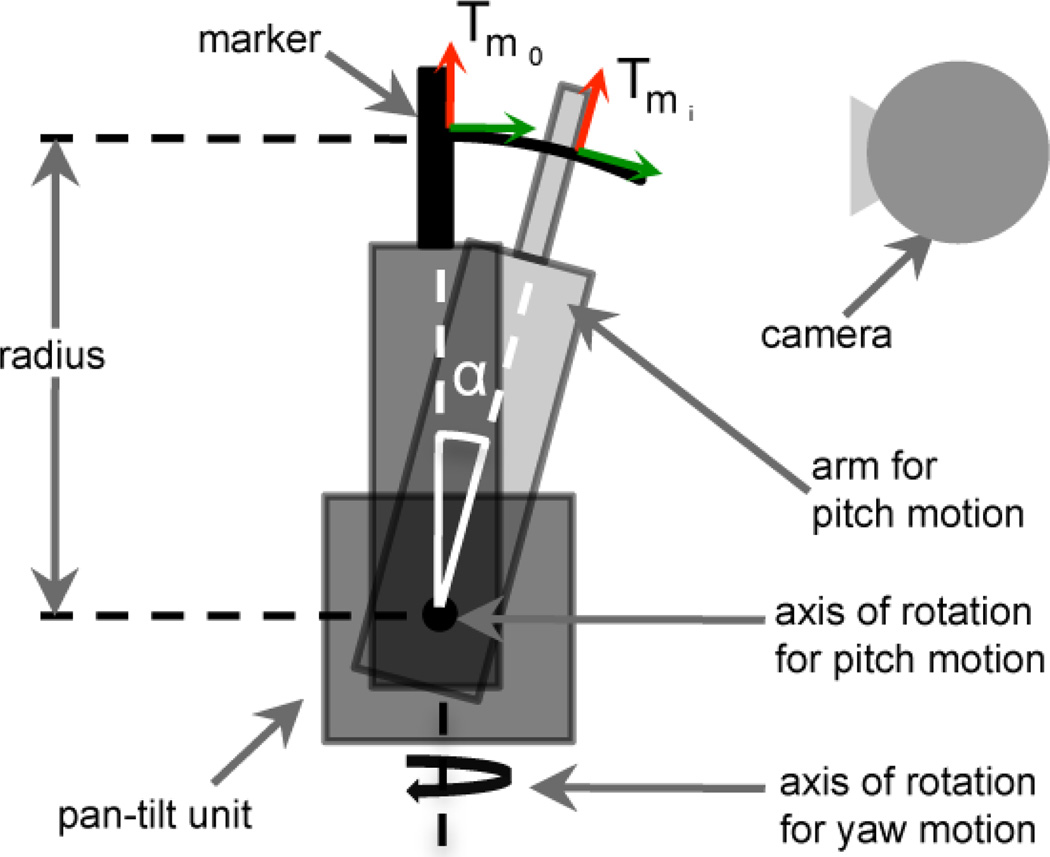
Setup of the pan-tilt experiment. The marker was rigidly mounted on top of the arm of the pan-tilt unit. In the experiments with pitch rotation the arm was rotated by α. The distance (radius) between marker and axis of rotation introduced an additional translation in the measured motion by the optical system. Similar translational effect was observed for yaw rotation, when both the origin of the marker and the axis of rotation were not aligned.
As shown in Figure 5, the markers were attached to the top of the arm for pitch rotation on the pan-tilt unit. In the experiment with yaw rotation the entire unit was rotating, while the arm for pitch rotation was kept in a static position. For the pitch experiment, motion was performed by rotating the arm for pitch rotation as illustrated in Figure 5. In the latter experiment, the position of the axis of rotation of the pan-tilt unit caused a rotation of the marker on a circular path with the arm of the pan-tilt unit as radius. During the experiment, the position of the marker was measured using the captured camera images and the motion of the marker was estimated as specified in Equation 1. Since the axis of rotation and the origin of the marker did not coincide, the measured translation Tm0→mi contained also an additional translational component, although only rotation was performed by the pan-tilt unit. However, neglecting any translation, this offset caused just a shifted axis of rotation, which had no impact on the measured rotation angle. The same error was observed for yaw rotation, when both the origin of the marker and the axis of rotation were not aligned. Thus, in both experiments accuracy was only measured for rotation and any translational component was disregarded for further analysis.
The measured error of the pose estimates using the self-encoded marker for yaw motion was below 0.1° after 40° yaw rotation and below 0.4° after 20° pitch rotation (Figure 6). For the checkerboard marker, this error was 1.0° and 2.4°, respectively.
Figure 6.
System setup and measured error of estimated rotation using self-encoded and checkerboard marker for experiments with yaw and pitch rotation.
3.2. MR 3D Imaging
In the first set of experiments, an axial 3D spoiled gradient recalled (SPGR) sequence with TR/TE = 9.5/4.1 ms, flip angle = 20°, slice thickness = 1.5 mm, FOV = 24 cm, and a resolution of 192 × 192 × 96 was used.
3.2.1. Phantom Experiment
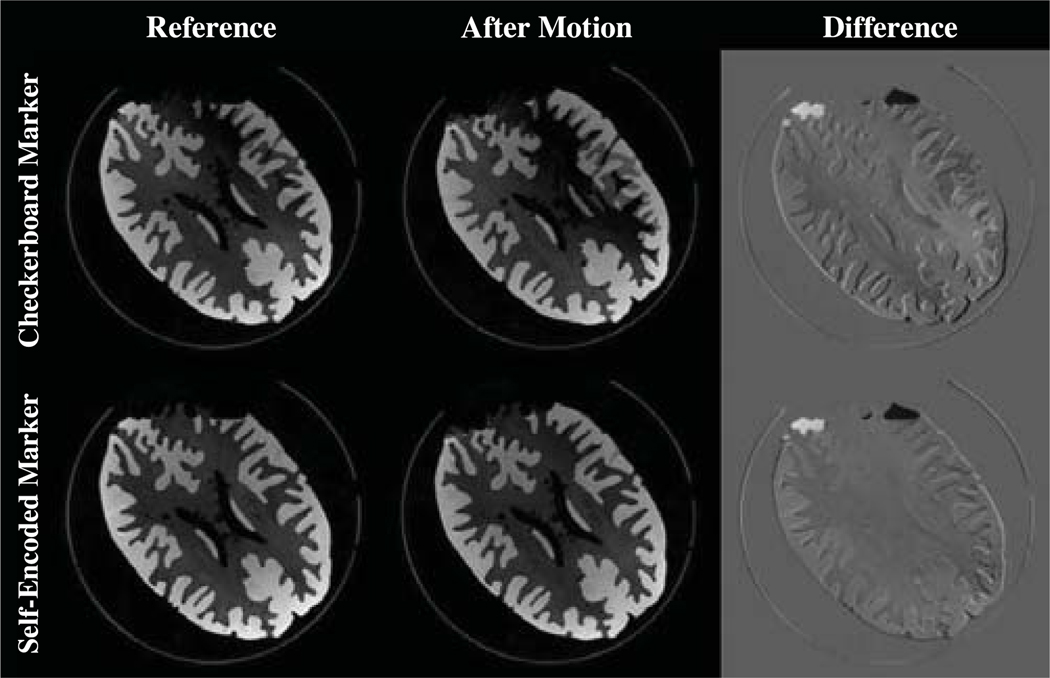
For the MR experiments the calibrated camera was rigidly mounted on the head coil. Scanner-camera cross-calibration was performed to achieve the transformation from camera to scanner frame of reference. Motivation for this experiment was to evaluate the accuracy of this calibration and of the optical motion correction system. Therefore, a cylindrical phantom was measured in two consecutive MR scans. In this experiment, no motion was allowed within the acquisition of each volume. The first scanned volume served as reference. After the first scan, the static phantom was manually rotated about its principal axis by 18°. Thus, in the second scan the tracking computer sent pose updates to the scanner to adjust the scanner geometry and compensate this motion. The same experiment was performed with the pose estimates of both checkerboard and self-encoded marker for motion compensation. Assuming an ideal motion correction system, we expected a perfect realignment of the two scanned volumes. Deviation from the reference volume was used to assess accuracy of the system.
The results of the phantom experiment are shown in Figure 7. Initial and final prospectively aligned volumes were retrospective rigidly registered by maximizing the correlation between the two volumes. This registration gave a remaining residual mismatch of:
The pose estimates of both markers were sufficient for effective motion correction. However, the self-encoded marker showed an increased accuracy by a maximal offset of 0.39 mm and 0.15° for translation and rotation, respectively. This experiment confirmed the improvements of the self-encoded marker, which were also observed in the previous experiments.
Figure 7.
The reference scan is compared to a scan with correction after 18° rotation. Both difference images are with a contrast enhancement by a scaling factor of 2.
For qualitative evaluation, difference images were also obtained between the initial scan of the phantom and the scan after the phantom was moved. These images indicated a discrepancy of the structure at the top of the phantom, which was caused by the phantom being not completely filled with water. While the structure of the phantom was rotated between both scans, the water remained at the same position. This appeared as error in the difference images.
3.2.2. In-Vivo Experiments
In-vivo experiments were performed on two healthy volunteers. Our internal review board approved the studies and informed written consent was obtained from the subject after the nature of the study was fully explained. For each scan, the obtained pose estimates were relative to the initial head position of the volunteer at the beginning of each scan. In each acquisition step, the measured translation and rotation was recorded in a log file by the motion correction system. In contrast to the phantom experiment where motion was only performed between the acquisitions of consecutive volumes, for the in-vivo experiments, the motion during acquisition of a volume was corrected. For the evaluation of the motion correction system, in each experiment, a motion-free scan was obtained for reference. In the ideal case, we expected the motion corrected image to be identical to the reference image. Noise and secondary artifacts caused by motion affected this similarity. For evaluation Pearson correlation coefficient (Edwards A. L., 1993) of the resulting image of reference and motion corrupted scan was compared with the correlation coefficient of reference and motion corrected scan.
In the first experiment, the performance of motion correction using pose updates of the checkerboard marker (Aksoy M., Newbould R., Straka M., Holdsworth S., Skare S., Santos J., and Bammer R., 2008) and the novel self-encoded marker were compared. Four scans were obtained for this experiment. In the first scan, the volunteer was instructed to maintain a stationary head position to create a motion-free reference image. For the following scans, the subject was asked to perform similar head motion every 30 seconds during the scan in order to assure a consistent motion pattern for all remaining scans. In the second scan, the motion correction system was turned off, but the position estimates of the checkerboard marker were still logged. For the third scan, motion correction was turned on and the pose estimates using the checkerboard marker were used to adapt the scanner for motion correction. In the fourth scan, the checkerboard marker was replaced with the self-encoded marker and motion correction was performed.
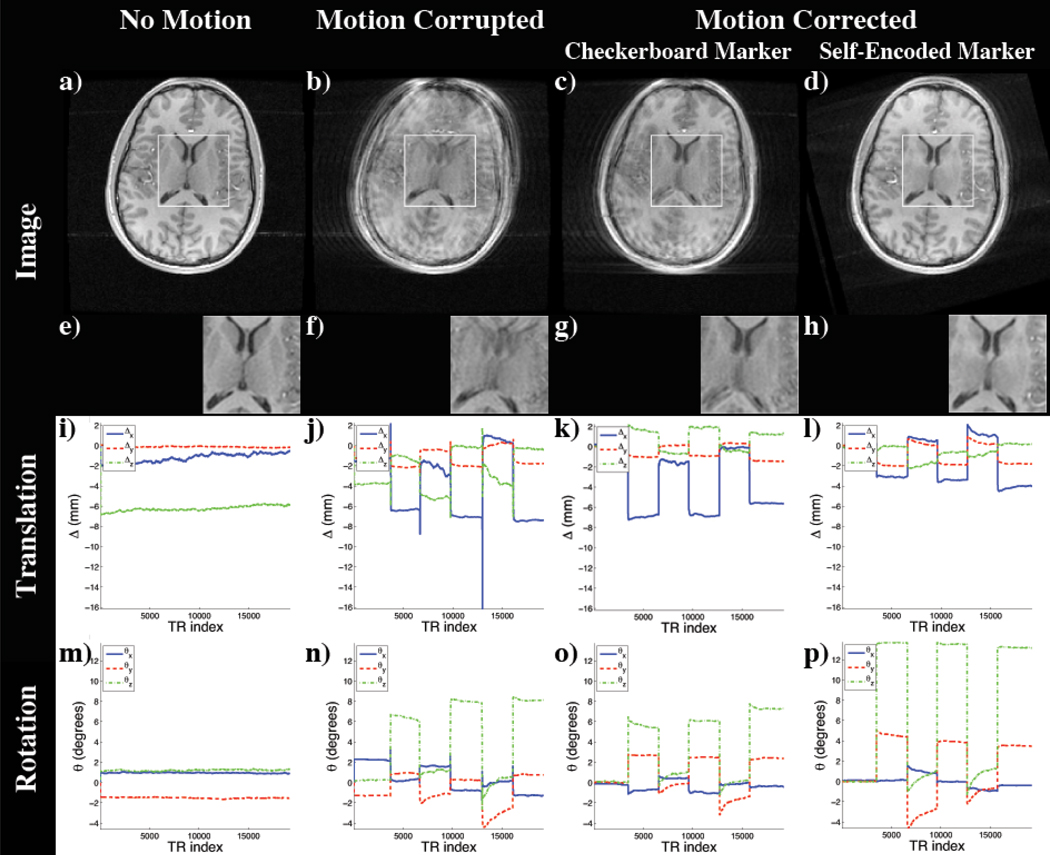
The resulting images of the experiment are shown in Figure 8. Since the motion was performed within the acquisition of each volume, without correction, the MR images exhibited motion artifacts (Figure 8b). Using the pose updates from the optical system and the checkerboard marker, these artifacts were reduced as seen in Figure 8c. However, the inaccuracies of the checkerboard marker mentioned in previous experiments became apparent. The scanned anatomical structure showed a residual mismatch in the ventricle. Furthermore, this comparison study revealed the limited range of motion that can be tracked by the checkerboard marker. In this experiment the camera-marker setup restricted the tracking range to 6° of rotation (Figure 8n,o). Using the identical setting and the pose updates of the self-encoded marker, we were able to extend the possible tracking range. While using the self-encoded marker, the only limiting factor for the range of detectable motion was the space inside the coil, which allowed a maximal rotation of 13° of the head without touching the coil (Figure 8p). Although compared to the checkerboard marker higher rotation was performed using the self-encoded marker, the resulting image quality was better. As seen in Figure 8d, the residual mismatch of the anatomy in the ventricle, which was observed in previous scan, was also corrected in this scan.
Figure 8.
Images of the scan comparing self-encoded and checkerboard marker: (a) Reference Scan; Scan with motion and (b) no correction, motion correction using the pose updates of the (c) checkerboard and the (d) self-encoded marker; (e–h) Magnification of window in (a–d); Detected translation (i–l) and rotation (m–p).
For quantitative evaluation, the improvement on the resulting image quality was measured using Person’s correlation coefficient. The correlation coefficient between reference and motion-corrupted image was 0.908. Using the optical tracking system and the pose updates of the checkerboard marker, this coefficient was improved to 0.936. The images of reference and motion corrected scan using the self-encoded marker showed a correlation of 0.971. This implies that the volume scanned using the self-encoded marker for motion correction had a higher degree of similarity to the reference volume compared to non-corrected volume or the motion-corrected volume using the checkerboard marker.
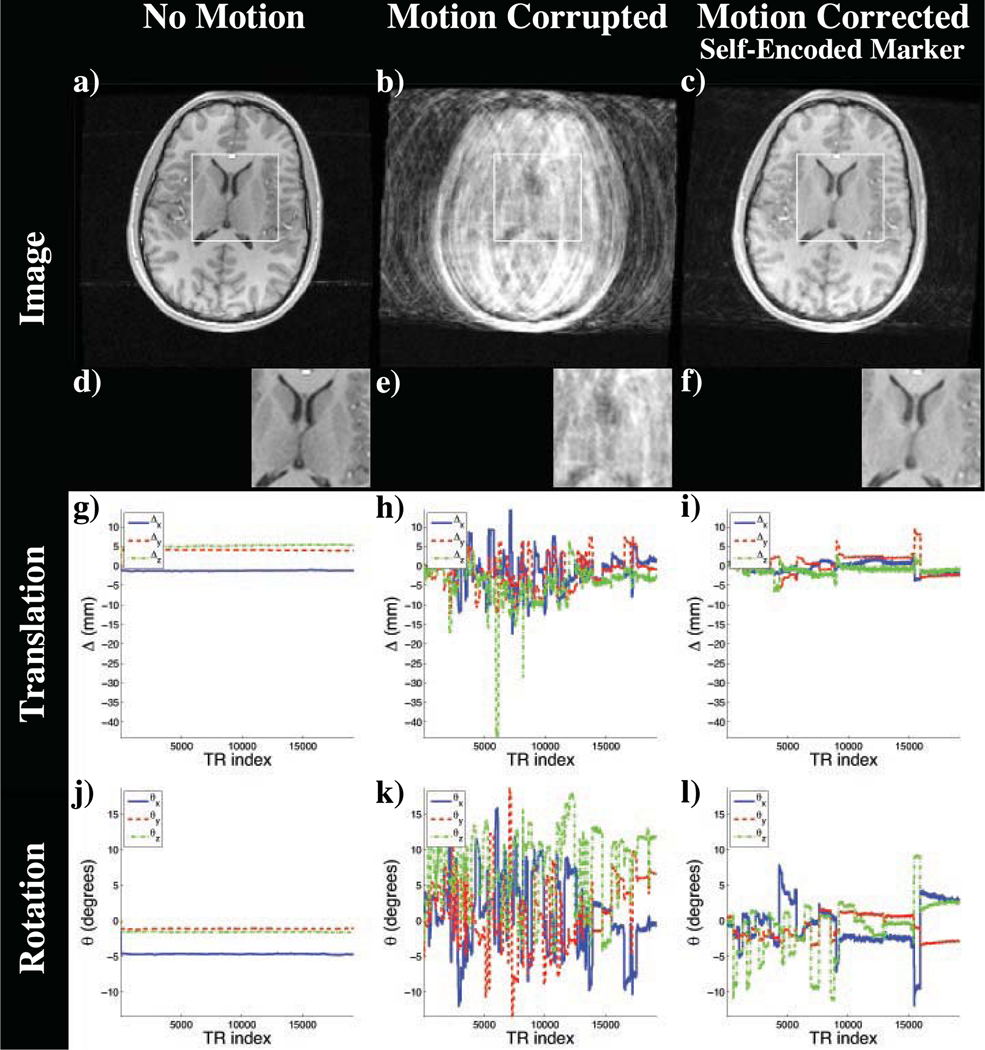
In the second experiment, the volunteer was asked to simulate an uncooperative behavior. First, a reference image was acquired, where the volunteer was asked to stay still. Then, in the following scans, the volunteer performed a chaotic motion throughout the entire scan. The head pose was estimated using the self-encoded marker throughout data acquisition. For the second scan, motion correction was turned off, whereas for the third scan, it was turned on. Due to the random characteristic of the motion pattern, it was not possible to repeat the experiment with the identical motion. However, the volunteer performed a similar behavior for all motion scans.
As seen in Figure 9 continuous motion performed in the second experiment had a strong impact on the resulting images. Motion-induced artifacts (Figure 9b) corrupted the entire anatomical structure of the brain. The performed trembling motion is visible in the recorded motion plots (Figure 9h,k). When the scanner geometry was adapted depending on the detected head pose (Figure 9c), the structure of the brain was recovered. In the quantitative evaluation the effects of motion resulted in a correlation coefficient of 0.858, while the pose updates of self-encoded marker were able to improve this factor to 0.982.
Figure 9.
Images of the scan simulating an uncooperative patient: (a) Reference Scan; Scan with random motion and (b) no correction and (c) prospective motion correction using the self-encoded marker; (d–f) Magnification of window in (a–c); Detected translation (g–i) and rotation (j–l).
This experiment showed that our prospective motion correction system had a sufficient performance to allow MR examinations of uncooperative patients. The peaks seen on the motion plots of the non motion corrected scan were due to the blurring of the camera image and related misidentification of some quads, leading to erroneous pose estimates. However, in our implementation for motion correction, a rescan was performed if large differences in rotation and translation were detected. Thereby peaks in the motion plots, which were observed in the motion-corrupted scan, were overwritten by the reacquired data. However, reacquisition of data in this study prolonged scan time. Thus, the motion corrected scan required approximately twice as long as the motion-free reference and leaves room for further improvements.
3.3. Diffusion Tensor Imaging
Diffusion tensor imaging (DTI) is an MR imaging scheme that is used to infer the diffusion of water protons within the myelin sheaths of the neurons (Basser, P. J. and Mattiello, J. and LeBihan, D., 1994). DTI has been used extensively to map the white matter connectivity in the brain (Basser, P. J. and Pajevic, S. and Pierpaoli, C. and Duda, J. and Aldroubi, A., 2000). DTI imaging scheme is particularly sensitive to motion during data acquisition (Anderson, A.W. and Gore, J. C., 1994). As seen in previous experiments, motion causes misregistration and blurring of the anatomical structures in the resulting images. Since diffusion is measured over time, these motion artifacts have direct impact of the estimation of the diffusion related quantities.
For the DTI experiment, scans with echo-planar readout were performed with TR/TE = 10.000/75 ms, slice thickness = 3 mm, FOV = 24 cm, 36 slices, acquisition matrix = 96×96, reconstruction matrix = 256 × 256, and 25 (+3b = 0 acquisitions) diffusion-encoding directions. Total scan time was 4:20 minutes.
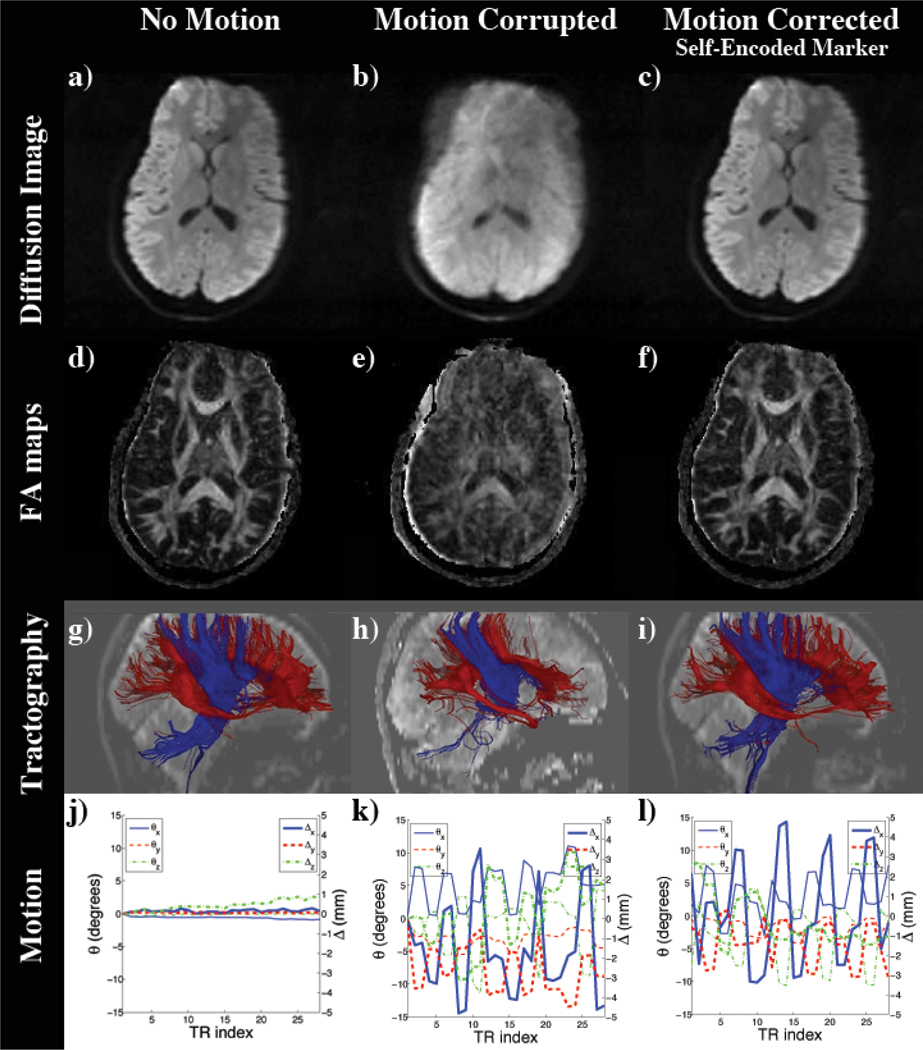
For this experiment the volunteer was asked to perform mixed nodding (i.e. through-plane) and shaking (i.e. in-plane) motion every 15 seconds. In order to get a similar motion pattern for all scans, the motion pattern was practiced before the experiment. First, a motion-free image was acquired as reference. Then, the trained motion pattern was performed in the second scan. Here, the prospective motion correction system was only logging the performed motion without correcting for it so that a motion-corrupted image was generated. In the third scan, the estimated pose updates were sent to the scanner to compensate for the detected motion.
Based on the measured diffusion tensors fractional anisotropy (FA) maps were computed. These are shown in Figure 10d–f. Using the principal direction of the diffusion tensor tractography was also performed to reconstruct fiber pathways (see Figure 10g–i). Motion recorded by the optical motion correction system was plotted in Figure 10j–l. The impact of motion can be seen in a spatial misregistration in the resulting mean diffusion images and computed FA maps (Figure 10b,e). This also led to a loss of fiber tracts as seen in Figure 10h. However, using the pose updates of the optical system and the self-encoded marker to compensate for motion, we were able to recover the scanned anatomical structure (see Figure 10c,f,i). Quantitative evaluation of the computed FA maps using the correlation of motion-free reference and the resulting image of the motion corrupted scan resulted in a correlation of 0.647. Using the pose estimates to adapt the scanner geometry for the performed motion, we were able to increase this correlation to 0.873.
Figure 10.
Diffusion images of the DTI experiment with mixed nodding and shaking motion: (a) Reference Scan; Scan with motion and (b) no correction and (c) prospective motion correction using the self-encoded marker; (d–f) Computed FA maps of (a–c); Tractography based on (d–f) (g–i); Measured rotation and translation (j–l).
3.4. Latency
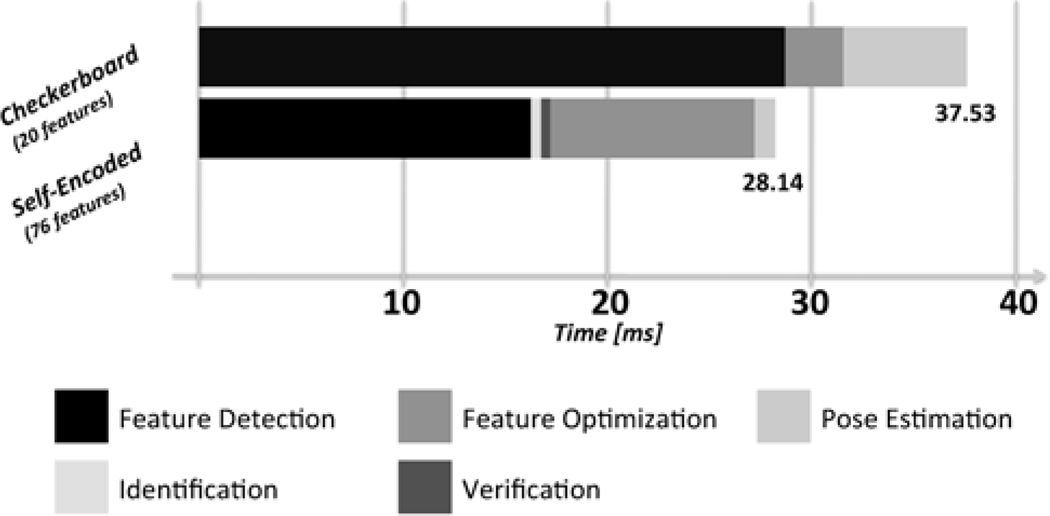
The most important aspect of prospective motion correction is its real-time applicability. Delayed pose estimation reduces the value of the entire motion correction system even if it provides very accurate estimates of the marker pose. To evaluate the latency of the tracking system, we measured and compared the performance of the tracking of the self-encoded marker that has 76 features to a checkerboard marker that includes 20 features. For a repeatable configuration we used one single captured camera image with a resolution of 640 × 480 pixels. The analysis of the computational time was performed on an Intel Core2Duo CPU (2.26 GHz).
The entire process form feature detection to the pose estimation took 37.5 ms for checkerboard marker and 28.1 ms for self-encoded marker, respectively. Our modifications in the detection algorithm for the self-encoded marker were made on feature detection, which required an identification and verification of the embedded codes. Figure 11 presents an analysis of processing time. The additional delay required for feature detection of the self-encoded marker was negligible. It can be seen that the feature detection, i.e. quad detection, had major impact on the latency of the entire system. This was caused by sequential detection of quadrangular contours with different threshold levels for binarization. In contrast to the checkerboard marker, the recognition of all quads was not necessary for the self-encoded marker for a robust generation of the point correspondences. Hence, the number of iterations for the contour detection was decreased. This provided a decrease of latency from 28.6 ms to 17.2 ms.
Figure 11.
Software performance analysis for the detection of the self-encoded marker (76 features) and checkerboard marker (20 features).
4. Discussion
External optical tracking systems for prospective motion correction provide the ability of motion compensation without additional MR data acquisitions, i.e. navigator data. However, a crucial limitation of existing in-bore tracking systems for prospective head motion correction in MRI was the narrow FOV of the camera due to the proximity of camera and marker. In the presented approach, we introduced a novel marker design, which improved the range and accuracy of the detected patient motion during MR data acquisition.
Our experiments with computer controlled motion showed an increased accuracy of the pose estimates when the self-encoded marker was used compared to a checkerboard pattern. The improvement of the self-encoded marker in accuracy could be attributed to two aspects. On one hand, the three dimensional structure of the self-encoded marker provided additional information to describe the position and orientation of the feature points. Planar markers, like the checkerboard marker, have a poor conditioning, when being parallel to the camera image plane (Uematsu, Y., and Saito, H., 2007). Since the self-encoded marker was also planar in the direction of motion of the pitch experiment, a worse accuracy was observed. On the other hand, in contrast to the checkerboard marker only a subset of features were required for the tracking of the self-encoded marker. Our experiments showed that the set of features chosen for pose estimation had no effect on the accuracy of our system. Thus, the optimal subset of features visible in the camera image could be used for estimation of the marker orientation. As an example, lens distortions increase with distance to the camera principle point. Thus, by choosing only the subset of points that are close to the principle point, the effect of lens distortions on pose estimation can be reduced. Moreover, since the self-encoded marker did not require all features present in the camera image, a large number of features were used. Thus, during all experiments more features of the self-encoded marker compared to the checkerboard marker were available for tracking. This also improved accuracy.
The enhanced accuracy of the self-encoded marker was also observed in an experiment with a physical phantom and the MR scanner. Using the pose updates, the optical motion correction was able to correct for motion of the phantom between two subsequent scans (Figure 7). Retrospective rigid registration of the resulting MR images showed a maximal residual offset of 0.39 mm and 0.15° using the self-encoded marker compared to 0.89 mm and 0.35° in translation and rotation using the checkerboard marker.
For the in-vivo experiments, the self-encoded marker was attached to the volunteers head using Velcro strip. The convex shape of the marker provided sufficient area for this rigid and non-invasive attachment to the forehead. Furthermore, this comfortable way of mounting of the marker would be applicable for daily clinical workflow. In the MR experiments, the inaccuracies in pose detection associated with the planar checkerboard marker resulted in residual mismatch and blurring of anatomical structures, as seen in Figure 8. With the pose updates obtained using the self-encoded marker, we were able to recover the entire anatomy in a separate scan with motion and identical setup. Beside this, the comparison study revealed the restricted tracking range of 6° with the checkerboard marker. In the same setup, we were able to extend this range using the self-encoded marker. Thus, maximal motion of the patients head without touching the coil was possible. In the next in-vivo study, the behavior of a highly uncooperative patient was simulated to observe the limits of the system. Similar to the previous in-vivo experiments, it was possible to recover the brain anatomy even in the presence of high degree of motion (Figure 9). However, to account for the latency of the entire system, rescans were required, and scan time was prolonged. Finally, the pose updates of the self-encoded marker were used to compensate for motion in a DTI study. Again, the prospective motion correction system and the self-encoded marker were able to recover the scanned anatomical structure in the presence of motion.
In order to assess the latency of the optical tracking, we also performed a software performance analysis. Compared to the detection of a common checkerboard pattern an acceleration factor of 1.7 was achieved. Certainly, the time consuming quad detection took still 17.2 ms for the self-encoded marker. Using multi-threading or a GPU implementation for this process would improve processing time significantly. However, the frame rate of the optical system (30 fps) is currently the limiting factor of the performance of the optical tracking. The achieved improvement of the tracking algorithm for the self-encoded marker provided already a faster software performance than the frame rate of the camera. Nevertheless, better hardware, i.e. camera with faster frame rate and better resolution, would improve accuracy and latency of the entire system.
5. Conclusion
In this study, we presented a novel marker design, which overcomes the limiting tracking range of existing optical prospective in-bore motion correction systems. This was achieved by embedding additional codes for an independent identification of the features on the marker. Now, not the camera FOV restricts the possible tracking range, but the size of the marker. Experiments inside and outside the MR scanner showed an improved accuracy of the pose estimates of the self-encoded marker compared to the established checkerboard marker.
► We introduce a novel marker design for optical prospective motion correction in MRI. ► Embedded codes on this marker allow an independent identification of features. ► Without the need of all features visible to the camera the tracking range is extended. ► The novel marker shows an improved accuracy compared to a checkerboard marker. ► These improvements result in enhanced image quality in performed in-vivo experiments.
Acknowledgements
This work was supported in part by the National Institutes of Health (Grant numbers: 1R01EB008706, 5R01EB002711, 1R01EB006526, 1R21EB006860, P41RR09784), Lucas Foundation, Oak Foundation, Bavarian California Technology Center (BaCaTeC), Erlangen Graduate School in Advanced Optical Technologies (SAOT), and GE Healthcare.
Footnotes
Publisher's Disclaimer: This is a PDF file of an unedited manuscript that has been accepted for publication. As a service to our customers we are providing this early version of the manuscript. The manuscript will undergo copyediting, typesetting, and review of the resulting proof before it is published in its final citable form. Please note that during the production process errors may be discovered which could affect the content, and all legal disclaimers that apply to the journal pertain.
References
- Aksoy M, Forman C, Straka M, Skare S, Holdsworth S, Hornegger J, Bammer R. Real-time optical motion correction for diffusion tensor imaging. Magn. Reson. Med. 2011 doi: 10.1002/mrm.22787. n/a–n/a. [DOI] [PMC free article] [PubMed] [Google Scholar]
- Aksoy M, Liu C, Moseley M, Bammer R. A Self-navigated Spiral In & Out Pulse Sequence Design for Retrospective Motion Correction. Seattle, Washington, USA: ISMRM; 2006. p. 3197. [Google Scholar]
- Aksoy M, Newbould R, Straka M, Holdsworth S, Skare S, Santos J, Bammer R. A Real Time Optical Motion Correction System Using a Single Camera and 2D Marker. Toronto, Canada: ISMRM; 2008. p. 3120. [Google Scholar]
- Anderson AW, Gore JC. Analysis and correction of motion artifacts in diffusion weighted imaging. Magn. Reson. Med. 1994;32:379–387. doi: 10.1002/mrm.1910320313. [DOI] [PubMed] [Google Scholar]
- Bammer R, Aksoy M, Liu C. Augmented generalized SENSE reconstruction to correct for rigid body motion. Magn. Reson. Med. 2007;57:90–102. doi: 10.1002/mrm.21106. [DOI] [PMC free article] [PubMed] [Google Scholar]
- Basser PJ, Mattiello J, LeBihan D. Mr diffusion tensor spectroscopy and imaging. Biophysical Journal. 1994;66:259–267. doi: 10.1016/S0006-3495(94)80775-1. [DOI] [PMC free article] [PubMed] [Google Scholar]
- Basser PJ, Pajevic S, Pierpaoli C, Duda J, Aldroubi A. Fiber tractography using dt-mri data. Magn. Reson. Med. 2000;44:625–632. doi: 10.1002/1522-2594(200010)44:4<625::aid-mrm17>3.0.co;2-o. [DOI] [PubMed] [Google Scholar]
- Bradski G. The OpenCV Library. Dr. Dobb’s Journal of Software Tools. 2000 [Google Scholar]
- Dold C, Zaitsev M, Speck O, Firle EA, Hennig J, Sakas G. Prospective Head Motion Compensation for MRI by Updating the Gradients and Radio Frequency During Data Acquisition. MICCAI; 2005. pp. 482–489. [DOI] [PubMed] [Google Scholar]
- Edwards AL. An Introduction to Linear Regression and Correlation. San Francisco: W. H. Freeman and Co; 1993. [Google Scholar]
- Fiala M. ARTag, a Fiducial Marker System Using Digital Techniques. CVPR; 2005. pp. 590–596. [Google Scholar]
- Forman C, Aksoy M, Hornegger J, Bammer R. Self-Encoded Marker for Optical Prospective Head Motion Correction in MRI. Springer: MICCAI; 2010. pp. 259–266. [DOI] [PubMed] [Google Scholar]
- Kim B, Boes JL, Bland TL, Meyer CR. Motion correction in fmri via registration of individual slices into an anatomical volume. Magn. Reson. Med. 1999;41:964–972. doi: 10.1002/(sici)1522-2594(199905)41:5<964::aid-mrm16>3.0.co;2-d. [DOI] [PubMed] [Google Scholar]
- Kochunov P, Lancaster JL, Glahn DC, Purdy D, Laird AR, Gao F, Fox P. Retrospective motion correction protocol for high-resolution anatomical mri. Human Brain Mapping. 2006;27:957–962. doi: 10.1002/hbm.20235. [DOI] [PMC free article] [PubMed] [Google Scholar]
- Ooi MB, Krueger S, Thomas WJ, Swaminathan SV, Brown TR. Prospective real-time correction for arbitrary head motion using active markers. Magn. Reson. Med. 2009;62:943–954. doi: 10.1002/mrm.22082. [DOI] [PMC free article] [PubMed] [Google Scholar]
- Pipe JG. Motion Correction With PROPELLER MRI: Application to Head Motion and Free-Breathing Cardiac Imaging. Magn. Reson. Med. 1999;42:963–969. doi: 10.1002/(sici)1522-2594(199911)42:5<963::aid-mrm17>3.0.co;2-l. [DOI] [PubMed] [Google Scholar]
- Thesen S, Heid O, Mueller E, Schad LR. Prospective Acquisition Correction for Head Motion With Image-Based Tracking for Real-Time fMRI. Magn. Reson. Med. 2000;44:457–465. doi: 10.1002/1522-2594(200009)44:3<457::aid-mrm17>3.0.co;2-r. [DOI] [PubMed] [Google Scholar]
- Tsai R. A versatile camera calibration technique for high-accuracy 3d machine vision metrology using off-the-shelf tv cameras and lenses. IEEE Journal on Robotics and Automation. 1987;3:323–344. [Google Scholar]
- Uematsu Y, Saito H. Improvement of accuracy for 2d marker-based tracking using particle filter; International Conference on Artificial Reality and Telexistence; 2007. pp. 183–189. [Google Scholar]
- White N, Roddey C, Shankaranarayanan A, Han E, Rettmann D, Santos J, Kuperman K, Dale AM. PROMO: Real-Time Prospective Motion Correction in MRI Using Image-Based Tracking. Magn. Reson. Med. 2010;63:91–105. doi: 10.1002/mrm.22176. [DOI] [PMC free article] [PubMed] [Google Scholar]
- Zaitsev M, Dold C, Sakas G, Hennig J, Speck O. Magnetic Resonance Imaging of Freely Moving Objects: Prospective Real-time Motion Correction Using an External Optical Motion Tracking System. NeuroImage. 2006;31:1038–1050. doi: 10.1016/j.neuroimage.2006.01.039. [DOI] [PubMed] [Google Scholar]


