

Abstract
Background. Chronic kidney disease (CKD) is associated with significant cardiovascular, neurological and metabolic complications. Thiamin and folate are essential for growth, development and normal cellular function, and their uptake is mediated by regulated transport systems. While plasma folate and thiamin levels are generally normal in patients with CKD, they commonly exhibit features resembling vitamin deficiency states. Earlier studies have documented impaired intestinal absorption of several B vitamins in experimental CKD. In this study, we explored the effect of CKD on expression of folate and thiamin transporters in the key organs and tissues.
Methods. Sprague-Dawley rats were randomized to undergo 5/6 nephrectomy or sham operation and observed for 12 weeks. Plasma folate and thiamin concentrations and gene expression of folate (RFC, PCFT) and thiamin transporters (THTR-1 and THTR-2) were determined in the liver, brain, heart and intestinal tissues using real-time PCR. Hepatic protein abundance of these transporters was determined using western blot analysis.
Results. Plasma folate and thiamin levels were similar between the CKD and the control groups. However, expressions of both folate (RFC and PCFT) and thiamin (THTR-1, THTR-2) transporters were markedly reduced in the small intestine, heart, liver and brain of the CKD animals. Liver protein abundance of folate and thiamin transporters was significantly reduced in the CKD animals when compared with the sham-operated controls. Furthermore, we found a significant reduction in mitochondrial folate and thiamin transporters in the CKD animals.
Conclusions. CKD results in marked down-regulation in the expression of folate and thiamin transporters in the intestine, heart, liver and brain. These events can lead to reduced intestinal absorption and impaired cellular homeostasis of these essential micronutrients despite their normal plasma levels.
Keywords: anemia, cardiovascular disease, malnutrition, neuropathy, uremia
Introduction
Chronic kidney disease (CKD) has emerged as a major public health problem worldwide [1]. CKD is associated with an increased risk of cardiovascular disease, neurologic disorders, malnutrition and progression to end-stage renal disease. Vascular and neurologic complications in particular remain an important source of morbidity and mortality in this population [2,3].
The water-soluble vitamins are a group of structurally and functionally unrelated compounds that share the common feature of being essential for normal cellular function, growth and development. Folate and thiamin (vitamin B1) are two members of this family of micronutrients. Folate is required for the synthesis of pyrimidine and purine nucleotides (precursors of DNA and RNA, respectively) and for the metabolism of several amino acids including homocysteine [4,5]. Folate deficiency leads to disruption of folate-dependent metabolic pathways, effects that lead to the development of clinical abnormalities ranging from anemia to growth retardation [3–5]. Thiamin serves as a cofactor for multiple enzymes involved in critical metabolic reactions which relate to energy metabolism [6]. Because it bridges the glycolytic and the pentose phosphate metabolic pathway, thiamin is also critical for creating chemical reducing power in cells [7]. Therefore, thiamin is thought to play an important role in reducing cellular oxidative stress [7–11]. Thus, low intracellular levels of thiamin lead to impairment in energy metabolism and a propensity for oxidative stress, which are a common finding in CKD. At the clinical level, thiamin deficiency leads to a variety of abnormalities that include neurologic (neuropathy, Wernicke-Korsakoff syndrome) and cardiovascular (e.g. peripheral vasodilatation, biventricular myocardial failure, edema and potentially acute fulminant cardiovascular collapse) disorders [7–11].
Human and other mammals cannot synthesize folate and thiamin, and thus, they depend on the intestinal absorption of these micronutrients from exogenous sources. Once absorbed, folate and thiamin are distributed throughout the body via the circulation. Intestinal absorption of folate and thiamin and their uptake into different cell types have been the subject of intense investigations over the past three decades. It is well known now that the reduced folate carrier (RFC) and the proton-coupled folate transporter (PCFT) are major folate transporters in intestinal and other mammalian cell types [12–14]. For thiamin, the thiamin transporters 1 and 2 (THTR-1 and THTR-2) were shown to be the main transporters in intestinal epithelial cells and in other cell types [15–18]. Furthermore, studies have shown that the expression of these vitamin transport systems in different tissues is highly regulated and influenced by extracellular and intracellular conditions [15–18].
In view of the association of CKD with oxidative stress, neurological disorders, myocardial dysfunction and hyperhomocysteinemia which can also be caused by folate and thiamin deficiencies, information on the effect of CKD on expression of their transporters in relevant tissues would be of interest. The available data on possible effects of uremia on expression of folate and thiamin transporters are limited. The present study was designed to explore the effect of CKD on the expression of folate and thiamin transporters in key tissues using an experimental animal model of CKD. We focused on these tissues since they are important for homeostasis (intestine), storage (liver) and utilization of these vitamins.
Materials and methods
Animals and basic experiment design
The experimental protocol was approved by the Institutional Animal Care and Use Committee of the University of California (Irvine, CA). Male Sprague-Dawley rats were housed in a climate-controlled, light-regulated facility with 12:12-h light–dark cycles and fed regular rat chow (Purina Mills, Brentwood, MO, containing 49% carbohydrates, 24% protein, 5% fat, 7% minerals, 6% fiber and various vitamins including 7.9 mg/kg folic acid and 20 mg/kg thiamin) and water ad libitum. The animals were randomly assigned to the CKD and control groups. Five animals were used in each group. The animals assigned to the CKD group underwent 5/6 nephrectomy by surgical resection of the upper and lower thirds of the left kidney followed by right nephrectomy 4 days later. The animals assigned to the control group were subjected to sham operation. Daily intake of food was measured and recorded for each group, and by the end of the study, it was determined that the intake of food was equal in both experimental groups (14.6 ± 1.6 g/day in control group versus 15.8 ± 2.9 g/day in the CKD animals). Daily intake of folate and thiamin was calculated in each group based on the vitamin content of the diet and the daily intake of food.
At the conclusion of the 12-week observation period, animals were placed in individual metabolic cages for a 24-h urine collection and measurement of food and water intake. The animals were then anesthetized (50 mg/kg ip pentobarbital sodium injection) and euthanized by exsanguinations using cardiac puncture. The left cardiac ventricle, liver, left frontal cortex of brain and small intestine (jejunum) were immediately harvested and cleaned with PBS, snap-frozen in liquid nitrogen and stored at − 70°C until processed.
Measurement of arterial pressure
Blood pressure was non-invasively measured by a volume pressure recording sensor and an occlusion tail-cuff (CODA System, Kent Scientific, Torrington, CT). In brief, the conscious animal was placed in a restrainer and permitted to rest for 10 to 15 min. The cuff was then placed on the tail and was inflated and released several times to condition the animal to the procedure. After stabilization, blood pressure was measured three times, and the average of the recorded values was used.
Blood and urine chemistry
Urine and plasma creatinine were measured with a Quantichrom creatinine assay kit (Bioassay Systems, Hayward, CA). Blood urea nitrogen (Bioassay Systems) was measured using kits purchased from the specified manufacturers. Urine protein was measured with the rat urinary protein assay kit (Chondrex, Redmond, WA). Creatinine clearance was determined using the standard formula. Plasma concentrations of thiamin and folate were measured by the University of California Irvine Medical Center Clinical Laboratory using HPLC.
Quantitative real-time PCR
Quantitative PCR (qPCR) was performed using the Bio-Rad iCycler and a Qiagen Quantitect SYBR green PCR kit (Valencia, CA). RNA from 100 μm of (five controls–five CKD) rat tissues was isolated using Trizol (Invitrogen, Carlsbad, CA) following the manufacturer’s procedure. The RNA was DNase treated and first-strand complementary DNA was made from 5 μg of the isolated total RNA primed with oligo dT using an Invitrogen Superscript synthesis system. Primers used in the qPCR were specific for the following: rat THTR-1 (forward-5′-GATGCTCCTACGTACTGCCC, reverse-5′-GCAGGTAGGGAGTGAGGAAC), rat THTR-2 (forward-5′-TGATACTCTGCTTGTCGG, reverse-5′-GTAAGAGTACGTCCAAACAG), rat RFC (forward-5′-GACCTGGGGAGAGClTCATC, reverse-5′-CCAGGACTGGC7TGTATCGT) and rat PCFT (forward-5′-CAGGGTACGGATTACTCTTC, reverse-5′-GGCCAAGCTATTCACACAG). Folate and thiamin have specific transporters in the mitochondria. Mitochondrial thiamin pyrophosphate (MTPP) transporter is encoded by the solute carrier family 25 (MTPP carrier), member 19 gene (SLC25A19, geneID 303676), and mitochondrial folate transporter (MFT) is encoded by the solute carrier family 25 (MTPP carrier), member 32 gene (SLC25A32, geneID 315023). Expression of these genes was measured using the following primers: rat MFT (forward-5′-AGTAACCCCGAATGTGTG, reverse-5′-TTCAGCAGCTGAGATGAG) and rat MTPP transporter (forward-5′-GGCCATACGCACCATG, reverse-5′-GGGTCTTGCTGATGACTC).
Gene-specific primers corresponding to the PCR targets were designed by using the specifications given by the vendors (Bio-Rad). The lengths of amplicons were as follows: rat RFC (162 bp long), PCFT (160 bp long), THTR-1 (191 bp long), THTR-2 (122 bp long), MFT (200 bp long), MTPP transporter (200 bp long) and β-actin (116 bp long). The amplicons chosen were specifically located inside the open reading frame of the specific rat genes to allow use of plasmid DNA to generate standard curves. Each SYBR green reaction (20 μL total volume) contained 2 μL of diluted cDNA as a template. The amplification program consisted of 1 cycle of 95°C with a 60-s hold (‘hot start’) followed by 40 cycles of 95°C for 1 min, specified annealing temperature with 30-s hold, 72°C with 1-min hold for extension and data acquisition. Amplification was followed by melting curve analysis program run for 1 cycle at 95°C with 0-s hold, 65°C with 10-s hold and 95°C with 0-s hold at the step-acquisition mode. A negative control without cDNA template was run with every assay to assess the overall specificity. The final quantification was achieved by a relative standard curve.
Western blot analysis
Frozen liver tissue was processed for determination of RFC, PCFT, THTR-1 and THTR-2 protein abundance. Briefly, liver was homogenized in 1 mL of 20 mM Tris–HCl (pH 7.5) buffer containing 2 mM MgCl2, 0.2 M sucrose and protease inhibitor cocktail (Sigma). The crude extract was centrifuged at 2000 g at 4°C for 15 min to remove tissue debris. The supernatant was used for western blot analyses. Protein concentration was measured prior to each western blot analysis using a BCA Protein Assay Kit purchased from Pierce Biotechnology (Rockford, IL, USA) following the manufacturer’s protocol. Aliquots containing 20–100 μg of protein were fractionated on 4–20% and Tris-gly gels (Invitrogen, Calif., USA) at 120 V for 2 h. After electrophoresis, proteins were transferred to Hybond enhanced chemiluminescence (ECL) membrane (Amersham Life Science, Arlington Heights, IL, USA). The membrane was incubated for 1 h in blocking buffer (1 × Tris-buffered saline, TBS, 0.1%; Tween 20, 5%; non-fat dry milk) and then overnight in the same buffer containing the primary antibody. Membrane was then washed four times for 5 min in 1 × TBS, 0.1% and Tween 20 before a 2-h incubation in blocking buffer (1 × TBS, 0.1%; Tween 20, 5%; non-fat dry milk) plus diluted horseradish peroxidase-linked anti-mouse or rabbit IgG (Amersham Life Science). The washing procedures were repeated before the membranes were developed with chemiluminescent agents (ECL; Amersham Life Science) and subjected to autoluminography for 10 s to 5 min. Folate transporter protein abundance was measured using a polyclonal rabbit IgG antibody raised by us against a synthetic peptide of rat RFC and PCFT in rabbits using a commercial vendor (Alpha Diagnostic, San Antonio, TX) at a 1/1000 dilution. Horseradish peroxidase-linked anti-rabbit IgG secondary antibody (Amersham Life Science) was used at 1/3000 dilution. Thiamin transporter protein abundance was measured using a polyclonal rabbit IgG antibody raised by us against a synthetic peptide of rat THTR-1 and THTR-2 in rabbits using a commercial vendor (Alpha Diagnostic, San Antonio, TX) at a 1/1000 dilution. Horseradish peroxidase-linked anti-rabbit IgG secondary antibody (Amersham Life Science) was used at 1/3000 dilution.
Data analysis
Data are expressed as means ± SEM. Student’s t-test was used in statistical evaluation of the data using SPSS software version 12.0 (SPSS, Chicago, IL). P-values < 0.05 were considered significant.
Results
General data
As expected, the CKD group showed a significant increase in arterial pressure, serum creatinine and urea nitrogen concentration and urinary protein excretion as compared with the corresponding values found in the sham-operated control rats. There was no difference in daily intake of folate and thiamin between control and CKD animals (folate daily intake control 0.115 ± 0.013 mg/day vs CKD 0.125 ± 0.023 mg/day and thiamin daily intake control 0.292 ± 0.0333 mg/day vs CKD 0.316 ± 0.057 mg/day). No significant difference was found in plasma thiamin and serum folate concentration between the CKD and the sham-operated control groups (Table 1).
Table 1.
General data in control and chronic kidney disease groups
| Groups (at 12 weeks) | CTL | CKD |
|---|---|---|
| Cr (mg/dL) | 0.55 ± 0.03 | 1.56 ± 0.23* |
| Urea (mg/dL) | 54.3 ± 1.8 | 114.7 ± 4.8* |
| Ccr (mL/min/kg) | 5.62 ± 0.53 | 1.74 ± 0.19* |
| Urine protein (mg/24 h) | 8.81 ± 2.18 | 80.29 ± 3.66* |
| SBP (mm Hg) | 123.52 ± 5.98 | 165.15 ± 3.19* |
| Plasma thiamin (nmol/L) | 543 ± 110.2 | 454.5 ± 39.5 |
| Serum folate (ng/mL) | 48.4 ± 2.4 | 47.3 ± 1.5 |
Values are given as mean ± SEM.
*P < 0.05 vs CTL groups.
Folate transporters RFC and PCFT expressions in the small intestine, brain, heart and liver
The CKD group exhibited marked reductions in the mRNA abundance of both folate transporters in the small intestine, heart, liver and brain. Intestinal RFC and PCFT mRNA levels were reduced to 53 and 26% of the corresponding values found in the control group (Figure 1A). Likewise, a significant decrease (44 and 62%) in the mRNA expression of these transporters was observed in the liver of the CKD animals compared with the sham-operated controls (Figure 1B). In the heart, the expression of RFC and PCFT was significantly reduced (to 67 and 58%, respectively) (Figure 1C). In the brain, expression of RFC was significantly decreased (to 26%) in the CKD rats compared with the sham-operated controls (Figure 1D). Although the mean value for brain PCFT expression was lower in the CKD than in the control group, the difference was not statistically significant (Figure 1D).
Fig. 1.
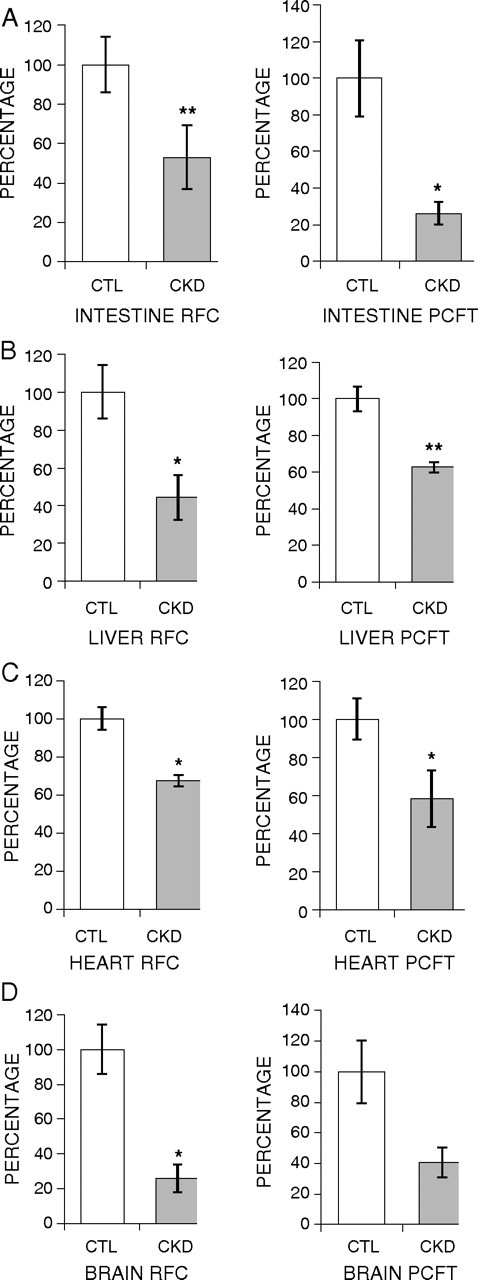
Effect of CKD on expression of folate transporters (RFC and PCFT) in the intestine, liver, heart and brain. Gene expression for RFC and PCFT was measured using real-time PCR. Tissues from CKD animals were compared with sham-operated controls, and the results are expressed as percentage of change relative to control animals. Intestine (A), liver (B), heart (C) and brain (D) are shown. Data are shown as mean ± SEM. *P < 0.05, **P < 0.01.
Thiamin transporters: THTR-1 and THTR-2 expressions in the small intestine, brain, heart and liver
The CKD animals showed a significant reduction in the expressions of THTR-1 and THTR-2 in the small intestine, heart, liver and brain. Intestinal THTR-1 and THTR-2 mRNA levels were decreased to 53 and 36% in the CKD animals when compared with the controls (Figure 2A). Likewise, hepatic expression of both thiamin transporters was significantly decreased to 46 and 32%, respectively, in the CKD rats when compared with the sham-operated controls (Figure 2B). In the heart, expressions of THTR-1 and THTR-2 were significantly reduced to 36 and 26%, when compared with the controls (Figure 2C). There was also a reduction in the mRNA expression of these transporters (to 69 and 70%, respectively) in the brain of the CKD animals compared with the sham-operated controls; however, the difference did not reach statistical significance (Figure 2C).
Fig. 2.
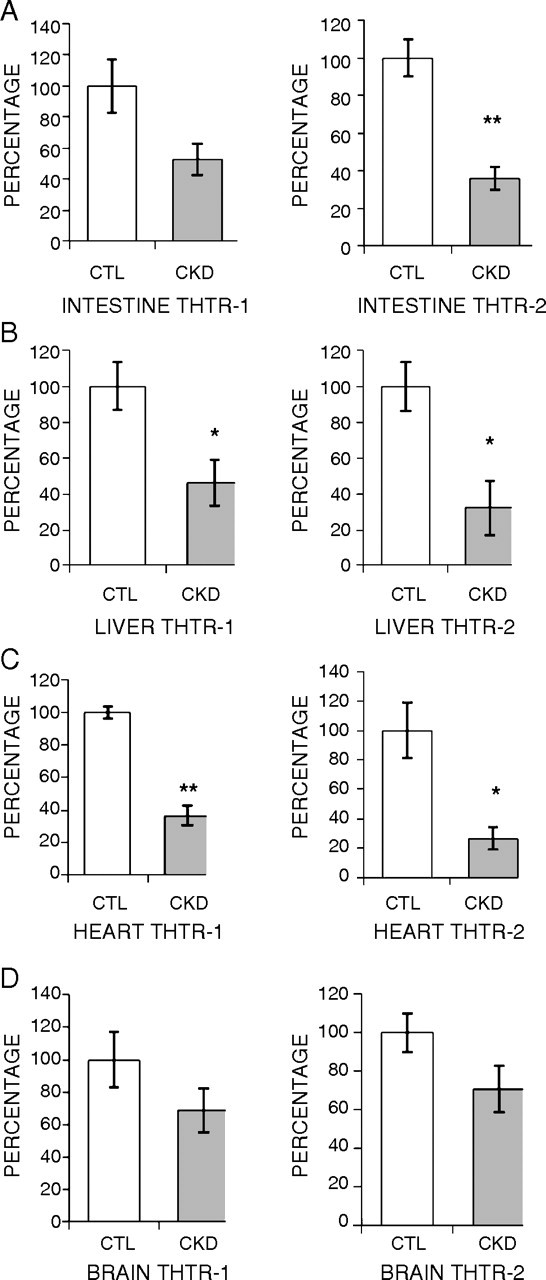
Effect of CKD on expression of thiamin transporters (THTR-1 and THTR-2) in the intestine, liver, heart and brain. Gene expression for THTR-1 and THTR-2 was measured using real-time PCR. Tissues from CKD animals were compared with sham-operated controls, and the results are expressed as percentage of change relative to control animals. Intestine (A), liver (B), heart (C) and brain (D) are shown. Data are shown as mean ± SEM. *P < 0.05, **P < 0.01.
MFT and MTPP transporter expressions in the liver
Expression of hepatic MFT and MTPP transporter was significantly reduced (to 57 and 45%, respectively) in the CKD animals when compared with the control group (Figure 3).
Fig. 3.

Effect of CKD on expression of mitochondrial folate transporter (MFT) and mitochondrial thiamin pyrophosphate (MTPP) transporter in the liver. Gene expression for liver MFT (A) and MTPP (B) was measured using real-time PCR. Tissues from CKD animals were compared with sham-operated controls, and the results are expressed as percentage of change relative to control animals. Data are shown as mean ± SEM. *P < 0.05, **P < 0.01.
Hepatic folate transporter RFC and PCFT and thiamin transporter THTR-1 and THTR-2 protein abundance
There was a significant decrease in protein abundance of RFC and PCFT in the liver of CKD animals when compared with sham-operated controls (Figure 4A–B). Furthermore, hepatic THTR-1 protein abundance was significantly decreased in CKD animals. Hepatic THTR-2 protein abundance was also markedly decreased in CKD animals; however, the difference did not reach statistical significance (Figure 4C–D).
Fig. 4.

Effect of CKD on protein abundance of RFC, PCFT, THTR-1, THTR-2 and β-actin in the liver. Representative western blots and group data illustrating protein abundance of RFC (A), PCFT (B), THTR-1 (C) and THTR-2 (D) in the liver of CKD and sham-operated control groups. Data are expressed as function of the corresponding values found in the control animals. Data are shown as mean ± SEM. *P < 0.05, **P < 0.01.
Discussion and Conclusion
Some of the clinical features of CKD such as hyperhomocysteinemia, uremic neuropathy, easy fatigability and oxidative stress resemble those found in the vitamin deficiency states. While plasma folate and thiamin levels are reportedly normal in CKD patients, the latter observation raises the possibility that CKD may be associated with localized (functional) deficiency of these and other vitamins [19–23]. In this context, earlier studies by our group have demonstrated significant reductions in the intestinal absorption/uptake of several water-soluble vitamins including folate, biotin, riboflavin and pyridoxine in the rat model of CKD [24–27]. In addition to affecting intestinal transport of these nutrients, uremia is known to impair uptake and transport of certain drugs and down-regulate organic anion transporters in the liver, intestine and brain in rat model of CKD [28–30]. In light of these findings, we sought to assess the effect of CKD on folate and thiamin transporters in selected organs. The study revealed a significant down-regulation of the folate transporters RFC and PCFT in the small intestine of CKD animals compared with sham-operated controls. Down-regulation of intestinal folate transporters found in the present study provides the mechanism for the reduction of intestinal uptake of folate in the uremic rats shown in our previous studies [24]. Down-regulation of intestinal folate and thiamin transporters shown here and reduced intestinal folate absorption shown previously were paradoxically associated with no significant change in the plasma thiamin or folate levels in the CKD animals compared with the sham-operated control rats. The observed normality of plasma folate and thiamin levels in the CKD animals is consistent with the results of the published studies in humans [19,20]. This phenomenon cannot be attributed to dietary factors since the amount and composition of food consumed by the CKD and control animals were similar. Likewise, a possible reduction in the volume of distribution of these products is an unlikely candidate since the opposite would be expected due to volume expansion in humans and animals with advanced renal insufficiency. However, diminished uptake and utilization of these vitamins by peripheral organs and tissues can potentially account for their normal plasma concentrations despite reduced intestinal absorption. This supposition is supported by the observed down-regulation of folate and thiamin transporters in the liver, brain, left ventricle and hepatic MFT in the CKD animals.
Folate plays a critical role in the purine and pyrimidine biosynthesis (precursors of nucleic acids), in the metabolism of several amino acids (including homocysteine) and in the initiation of protein synthesis in mitochondria [4–6]. Folate deficiency leads to both chromosomal DNA injury and mitochondrial DNA mutations [4–6,31], which have been collectively associated with mitochondrial dysfunction, membrane depolarization, increased reactive oxygen species (ROS) production and premature cell death [31,32]. It is well established that CKD is associated with up-regulation of ROS-generating machinery, increased generation of ROS, oxidative stress and inflammation [23]. Therefore, a potential decrease in cellular uptake of folate in such tissues as liver, heart and brain and a potential decrease in folate uptake by the mitochondria may contribute to the prevailing oxidative stress in CKD. It has been shown that mitochondrial folate deprivation can induce oxidative stress by promoting cytochrome C oxygenase dysfunction, membrane depolarization and super-oxide overproduction. In this context, folate serves as an antioxidant at the mitochondria level and helps to ameliorate the mitochondrial oxidative decay elicited by pro-oxidants [31,32]. Given the important role of liver in storage and metabolism of folate, a potential defect in mitochondrial folate transport in this organ may lead to mitochondrial dysfunction, heightened ROS production and oxidative stress in CKD [31,33,34].
The findings of the present study may help explain the failure of clinical trials of folate supplementation to improve mortality and cardiovascular outcomes in hyperhomocysteinemic patients with CKD. The rationale leading to the expectation that folate should have been beneficial arises from the fact that folate is also involved in the methionine metabolism pathway by serving as a substrate for the methionine synthase [35]. Reduced folate availability can result in hyperhomocysteinemia that has been associated with increased risk of atherosclerotic cardiovascular disease as well as neurological complications [36–39]. Patients with CKD frequently exhibit significant hyperhomocysteinemia [39,40]. While some have suggested that strategies aimed at reducing homocysteine level in CKD may reduce the burden of atherosclerosis and improve mortality, a randomized clinical trial of folate supplementation failed to change overall mortality and cardiovascular outcomes in this population [41]. Furthermore, folate supplementation failed to normalize homocysteine level in most patients with CKD in this trial [41]. The down-regulation of folate transporters and their decreased protein abundance in the liver shown here may, in part, account for the failure of folate supplementation in normalizing plasma homocysteine levels in CKD population.
Thiamin plays a fundamental role in cellular metabolism and energy production, principally via thiamin pyrophosphate, which serves as a coenzyme required for normal cellular function, growth and development [9–11]. Furthermore, thiamin plays a role in blunting ROS generation via its capacity to bridge the glycolytic and the pentose phosphate metabolic pathways [9–11]. Insufficient amounts of dietary thiamin can lead to a variety of clinical consequences that include neurologic and cardiovascular dysfunctions [42–44]. In this study, we found significant down-regulations of the thiamin transporters THTR-1 and THTR-2 in all tested tissues and decreased protein abundance in the liver of CKD animals when compared with sham-operated controls. We speculate that down-regulation of thiamin transporters will result in diminished intracellular thiamin levels and will contribute to the CKD-associated oxidative stress.
CKD results in reduced exercise capacity which has been attributed, at least, in part, to the associated anemia of CKD. The advent and widespread availability of erythropoiesis-stimulating agents (ESAs) has revolutionized the treatment of CKD-induced anemia. Contrary to expectation, correction of anemia with ESAs has had minimal impact in restoring CKD patients’ exercise capacity [45]. Because thiamin is an important factor for glucose metabolism and energy production, possible limitation in cellular thiamin availability can adversely affect energy metabolism [43,46]. In addition, thiamin deficiency has been reported to cause cognitive impairment and findings similar to Alzheimer’s disease [47]. It is of note that thiamin serves as a cofactor for transketolase (a key enzyme in the non-oxidative branch of pentose phosphate shunt pathway) whose deficiency is known to cause peripheral neuropathy [42,46,48]. Peripheral neuropathy is a common complication of uremia, and uremic peripheral neuropathy has been linked to dysregulation of transketolase [49]. Given the critical role of thiamin in regulation of transketolase activity, we speculate that the observed down-regulation of thiamin transporters in the neuronal tissue shown in the animal model of kidney disease contributes to the pathogenesis of uremic neuropathy.
It is also interesting to note that CKD results in a significant reduction in the expression of mitochondrial thiamin transporter (SLC25A19). In light of the fact that thiamin is an essential cofactor for three enzymatic complexes within the mitochondria (the pyruvate dehydrogenase complex, the branched chain keto acid dehydrogenase complex and the alpha-ketoglutarate dehydrogenase complex) and the fact that mutations in this transporter are believed to cause progressive polyneuropathy and bilateral striatal necrosis, our findings may have significant clinical relevance in regard to the peripheral neuropathy observed in CKD patients [50].
In conclusion, the present study demonstrated the association of CKD with down-regulation of folate and thiamin transporters, which can potentially contribute to various complications of uremia by limiting bio-availability of these essential micronutrients at the tissue, cellular and organelle level.
Acknowledgments
This study was in part supported by grants from the Department of Veterans Affairs and the National Institute of Health (DK56061 and AA18071) (H.M.S.) and NIH-NRSA award DK082130 (H.M.).
Conflict of interest statement. None declared.
References
- 1.Coresh J, Astor BC, Greene T, et al. Prevalence of chronic kidney disease and decreased kidney function in the adult US population: Third National Health and Nutrition Examination Survey. Am J Kidney Dis. 2003;41:1–12. doi: 10.1053/ajkd.2003.50007. [DOI] [PubMed] [Google Scholar]
- 2.Schiffrin EL, Lipman ML, Mann JF. Chronic kidney disease: effects on the cardiovascular system. Circulation. 2007;116:85–97. doi: 10.1161/CIRCULATIONAHA.106.678342. [DOI] [PubMed] [Google Scholar]
- 3.Krishnan AV, Kiernan MC. Neurological complications of chronic kidney disease. Nat Rev Neurol. 2009;5:542–551. doi: 10.1038/nrneurol.2009.138. [DOI] [PubMed] [Google Scholar]
- 4.Blakley RL, Benkovic SJ. Chemistry and Biochemistry of Folate. Vol. 3. New York: Wiley and Sons; 1985. Folates and Peterines. [Google Scholar]
- 5.Lucock M. Folic acid: nutritional biochemistry, molecular biology, and role in disease processes. Mol Genet Metab. 2000;71:121–138. doi: 10.1006/mgme.2000.3027. [DOI] [PubMed] [Google Scholar]
- 6.Stanger O. Physiology of folic acid in health and disease. Curr Drug Metab. 2002;3:211–223. doi: 10.2174/1389200024605163. [DOI] [PubMed] [Google Scholar]
- 7.Hazell AS, Butterworth RF. Update of cell damage mechanisms in thiamine deficiency: focus on oxidative stress, excitotoxicity and inflammation. Alcohol Alcohol. 2009;44:141–147. doi: 10.1093/alcalc/agn120. [DOI] [PubMed] [Google Scholar]
- 8.Gioda CR, de Oliveira Barreto T, Primola-Gomes TN, et al. Cardiac oxidative stress is involved in heart failure induced by thiamine deprivation in rats. Am J Physiol Heart Circ Physiol. 2010;298:H2039–H2045. doi: 10.1152/ajpheart.00820.2009. [DOI] [PubMed] [Google Scholar]
- 9.Calingasan NY, Chun WJ, Park LC, et al. Oxidative stress is associated with region-specific neuronal death during thiamine deficiency. J Neuropathol Exp Neurol. 1999;58:946–958. doi: 10.1097/00005072-199909000-00005. [DOI] [PubMed] [Google Scholar]
- 10.Langlais PJ, Anderson G, Guo SX, et al. Increased cerebral free radical production during thiamine deficiency. Metab Brain Dis. 1997;12:137–143. [PubMed] [Google Scholar]
- 11.Boros LG, Lee PW, Brandes JL, et al. Nonoxidative pentose phosphate pathways and their direct role in ribose synthesis in tumors: is cancer a disease of cellular glucose metabolism? Med Hypotheses. 1998;50:55–59. doi: 10.1016/s0306-9877(98)90178-5. [DOI] [PubMed] [Google Scholar]
- 12.Nguyen TT, Dyer DL, Dunning DD, et al. Human intestinal folate transport: cloning, expression, and distribution of complementary RNA. Gastroenterology. 1997;1112:783–791. doi: 10.1053/gast.1997.v112.pm9041240. [DOI] [PubMed] [Google Scholar]
- 13.Said HM, Mohammed ZM. Intestinal absorption of water-soluble vitamins: an update. Curr Opin Gastroenterol. 2006;22:140–146. doi: 10.1097/01.mog.0000203870.22706.52. [DOI] [PubMed] [Google Scholar]
- 14.Qiu A, Min SH, Jansen M, et al. Identification of an intestinal folate transporter and the molecular basis for hereditary folate malabsorption. Cell. 2006;127:917–928. doi: 10.1016/j.cell.2006.09.041. [DOI] [PubMed] [Google Scholar]
- 15.Reidling JC, Nabokina SM, Balamurugan K, et al. Developmental maturation of intestinal and renal thiamin uptake: studies in wild-type and transgenic mice carrying human THTR-1 and 2 promoters. J Cell Physiol. 2006;206:371–377. doi: 10.1002/jcp.20492. [DOI] [PubMed] [Google Scholar]
- 16.Said HM, Balamurugan K, Subramanian VS, et al. Expression and functional contribution of hTHTR-2 in thiamin absorption in human intestine. Am J Physiol Gastrointest Liver Physiol. 2004;286:G491–G498. doi: 10.1152/ajpgi.00361.2003. [DOI] [PubMed] [Google Scholar]
- 17.Reidling JC, Said HM. In vitro and in vivo characterization of the minimal promoter region of the human thiamin transporter SLC19A2. Am J Physiol Cell Physiol. 2003;285:C633–C641. doi: 10.1152/ajpcell.00076.2003. [DOI] [PubMed] [Google Scholar]
- 18.Reidling JC, Said HM. Adaptive regulation of intestinal thiamin uptake: molecular mechanism using wild-type and transgenic mice carrying hTHTR-1 and -2 promoters. Am J Physiol Gastrointest Liver Physiol. 2005;288:G1127–G1134. doi: 10.1152/ajpgi.00539.2004. [DOI] [PubMed] [Google Scholar]
- 19.Descombes E, Boulat O, Perriard F, et al. Water-soluble vitamin levels in patients undergoing high-flux hemodialysis and receiving long-term oral postdialysis vitamin supplementation. Artif Organs. 2000;24:773–778. doi: 10.1046/j.1525-1594.2000.06553.x. [DOI] [PubMed] [Google Scholar]
- 20.Niwa T, Ito T, Matsui E, et al. Plasma level and transfer capacity of thiamin in patients undergoing long-term hemodialysis. Am J Clin Nutr. 1975;28:1105–1109. doi: 10.1093/ajcn/28.10.1105. [DOI] [PubMed] [Google Scholar]
- 21.Hung SC, Hung SH, Tarng DC, et al. Thiamine deficiency and unexplained encephalopathy in hemodialysis and peritoneal dialysis patients. Am J Kidney Dis. 2001;38:941–947. doi: 10.1053/ajkd.2001.28578. [DOI] [PubMed] [Google Scholar]
- 22.Levin A, Singer J, Thompson CR, et al. Prevalent left ventricular hypertrophy in the predialysis population: identifying opportunities for intervention. Am J Kidney Dis. 1996;27:347–354. doi: 10.1016/s0272-6386(96)90357-1. [DOI] [PubMed] [Google Scholar]
- 23.Vaziri ND. Oxidative stress in uremia: nature, mechanisms, and potential consequences. Semin Nephrol. 2004;24:469–473. doi: 10.1016/j.semnephrol.2004.06.026. [DOI] [PubMed] [Google Scholar]
- 24.Said HM, Vaziri ND, Kariger RK, et al. Intestinal absorption of 5-methyltetrahydrofolate in experimental uremia. Acta Vitaminol Enzymol. 1984;6:339–346. [PubMed] [Google Scholar]
- 25.Said HM, Vaziri ND, Oveisi F, et al. Effect of chronic renal failure on intestinal transport of biotin in the rat. J Lab Clin Med. 1992;120:471–475. [PubMed] [Google Scholar]
- 26.Vaziri ND, Said HM, Hollander D, et al. Impaired intestinal absorption of riboflavin in experimental uremia. Nephron. 1985;41:26–29. doi: 10.1159/000183541. [DOI] [PubMed] [Google Scholar]
- 27.Barbari A, Vaziri ND, Benavides I, et al. Intestinal transport of pyridoxine in experimental renal failure. Life Sci. 1989;45:663–669. doi: 10.1016/0024-3205(89)90053-2. [DOI] [PubMed] [Google Scholar]
- 28.Naud J, Michaud J, Leblond FA, et al. Effects of chronic renal failure on liver drug transporters. Drug Metab Dispos. 2008;36:124–128. doi: 10.1124/dmd.107.018192. [DOI] [PubMed] [Google Scholar]
- 29.Naud J, Michaud J, Boisvert C, et al. Down-regulation of intestinal drug transporters in chronic renal failure in rats. J Pharmacol Exp Ther. 2007;320:978–985. doi: 10.1124/jpet.106.112631. [DOI] [PubMed] [Google Scholar]
- 30.Deguchi T, Isozaki K, Yousuke K, et al. Involvement of organic anion transporters in the efflux of uremic toxins across the blood-brain barrier. J Neurochem. 2006;96:1051–1059. doi: 10.1111/j.1471-4159.2005.03550.x. [DOI] [PubMed] [Google Scholar]
- 31.Chang CM, Yu CC, Lu HT, et al. Folate deprivation promotes mitochondrial oxidative decay: DNA large deletions, cytochrome c oxidase dysfunction, membrane depolarization and superoxide overproduction in rat liver. Br J Nutr. 2007;97:855–863. doi: 10.1017/S0007114507666410. [DOI] [PubMed] [Google Scholar]
- 32.Chou YF, Yu CC, Huang RF. Changes in mitochondrial DNA deletion, content, and biogenesis in folate-deficient tissues of young rats depend on mitochondrial folate and oxidative DNA injuries. J Nutr. 2007;137:2036–2042. doi: 10.1093/jn/137.9.2036. [DOI] [PubMed] [Google Scholar]
- 33.Yeo EJ, Wagner C. Tissue distribution of glycine N-methyltransferase, a major folate-binding protein of liver. Proc Natl Acad Sci USA. 1994;91:210–214. doi: 10.1073/pnas.91.1.210. [DOI] [PMC free article] [PubMed] [Google Scholar]
- 34.Chanson A, Sayd T, Rock E, et al. Proteomic analysis reveals changes in the liver protein pattern of rats exposed to dietary folate deficiency. J Nutr. 2005;135:2524–2529. doi: 10.1093/jn/135.11.2524. [DOI] [PubMed] [Google Scholar]
- 35.Scott JM, Weir DG. Folic acid, homocysteine and one-carbon metabolism: a review of the essential biochemistry. J Cardiovasc Risk. 1998;5:223–227. [PubMed] [Google Scholar]
- 36.Kronenberg G, Colla M, Endres M. Folic acid, neurodegenerative and neuropsychiatric disease. Curr Mol Med. 2009;9:315–323. doi: 10.2174/156652409787847146. [DOI] [PubMed] [Google Scholar]
- 37.Zhou J, Austin RC. Contributions of hyperhomocysteinemia to atherosclerosis: causal relationship and potential mechanisms. Biofactors. 2009;35:120–129. doi: 10.1002/biof.17. [DOI] [PubMed] [Google Scholar]
- 38.Lawrence de Koning AB, Werstuck GH, Zhou J, et al. Hyperhomocysteinemia and its role in the development of atherosclerosis. Clin Biochem. 2003;36:431–441. doi: 10.1016/s0009-9120(03)00062-6. [DOI] [PubMed] [Google Scholar]
- 39.Ferechide D, Radulescu D. Hyperhomocysteinemia in renal diseases. J Med Life. 2009;2:53–59. [PMC free article] [PubMed] [Google Scholar]
- 40.Nerbass FB, Draibe SA, Feiten SF, et al. Homocysteine and its determinants in nondialyzed chronic kidney disease patients. J Am Diet Assoc. 2006;106:267–270. doi: 10.1016/j.jada.2005.10.035. [DOI] [PubMed] [Google Scholar]
- 41.Jamison RL, Hartigan P, Kaufman JS, et al. Effect of homocysteine lowering on mortality and vascular disease in advanced chronic kidney disease and end-stage renal disease: a randomized controlled trial. JAMA. 2007;298:1163–1170. doi: 10.1001/jama.298.10.1163. [DOI] [PubMed] [Google Scholar]
- 42.Kumar N. Neurologic presentations of nutritional deficiencies. Neurol Clin. 2010;28:107–170. doi: 10.1016/j.ncl.2009.09.006. [DOI] [PubMed] [Google Scholar]
- 43.Thornalley PJ. The potential role of thiamine (vitamin B1) in diabetic complications. Curr Diabetes Rev. 2005;1:287–298. doi: 10.2174/157339905774574383. [DOI] [PubMed] [Google Scholar]
- 44.Soukoulis V, Dihu JB, Sole M, et al. Micronutrient deficiencies an unmet need in heart failure. J Am Coll Cardiol. 2009;54:1660–1673. doi: 10.1016/j.jacc.2009.08.012. [DOI] [PubMed] [Google Scholar]
- 45.Suzuki M, Tsutsui M, Yokoyama A, et al. Normalization of hematocrit with recombinant human erythropoietin in chronic hemodialysis patients does not fully improve their exercise tolerance abilities. Artif Organs. 1995;19:1258–1261. doi: 10.1111/j.1525-1594.1995.tb02296.x. [DOI] [PubMed] [Google Scholar]
- 46.Nozaki S, Mizuma H, Tanaka M, et al. Thiamine tetrahydrofurfuryl disulfide improves energy metabolism and physical performance during physical-fatigue loading in rats. Nutr Res. 2009;29:867–872. doi: 10.1016/j.nutres.2009.10.007. [DOI] [PubMed] [Google Scholar]
- 47.Gibson GE, Blass JP. Thiamine-dependent processes and treatment strategies in neurodegeneration. Antioxid Redox Signal. 2007;9:1605–1619. doi: 10.1089/ars.2007.1766. [DOI] [PubMed] [Google Scholar]
- 48.Alexander-Kaufman K, Harper C. Transketolase: observations in alcohol-related brain damage research. Int J Biochem Cell Biol. 2009;41:717–720. doi: 10.1016/j.biocel.2008.04.005. [DOI] [PubMed] [Google Scholar]
- 49.Sterzel RB, Semar M, Lonergan ET, et al. Relationship of nervous tissue transketolase to the neuropathy in chronic uremia. J Clin Invest. 1971;50:2295–2304. doi: 10.1172/JCI106727. [DOI] [PMC free article] [PubMed] [Google Scholar]
- 50.Spiegel R, Shaag A, Edvardson S, et al. SLC25A19 mutation as a cause of neuropathy and bilateral striatal necrosis. Ann Neurol. 2009;66:419–424. doi: 10.1002/ana.21752. [DOI] [PubMed] [Google Scholar]