In the cell nucleus, the 1,25-(OH)2 vitamin D3 (1,25-(OH)2D3) receptor (VDR) is localized in specialized microdomains enriched in sphingomyelin and cholesterol. The integrity of these microdomains is necessary for 1,25-(OH)2D3–induced differentiation of embryonic hippocampal cells. Serum deprivation alters nuclear microdomains, which lose the VDR.
Abstract
Despite recent advances in the understanding of the role of 1,25-dihydroxyvitamin D3 (1,25-(OH)2D3) in the CNS, the mechanism of action remains obscure. We demonstrate that some 1,25-(OH)2D3 receptor (VDR) is localized in the cell nucleus in specialized microdomains enriched in sphingomyelin and cholesterol; the integrity of these microdomains is necessary for embryonic hippocampal cell differentiation. Sphingomyelinase (SMase) treatment reduces both VDR and labeled 1,25-(OH)2D3 content in nuclear microdomains. We have previously shown that HN9.10e embryonic hippocampal cells differentiate when incubated with 100 nM 1,25-(OH)2D3 in the presence of 10% fetal calf serum, while serum deprivation induces cell death. In this study, we have investigated whether conditions that alter lipid content of nuclear microdomains modify 1,25-(OH)2D3–induced differentiation. Serum deprivation activates SMase and modifies the composition of nuclear microdomains, which lose the 1,25-(OH)2 vitamin D3 receptor. The incubation of serum-deprived cells with 100 nM 1,25-(OH)2D3 prevents differentiation. However, treatment with 400 nM 1,25-(OH)2D3 during serum withdrawal increases the lipid content of the nuclear microdomains, allows the interaction of 1,25-(OH)2D3 with its receptor, and results in differentiation. These results suggest the presence of VDR in nuclear microdomains is necessary for 1,25-(OH)2D3–induced differentiation in embryonic hippocampal cells.
INTRODUCTION
The most active metabolite of vitamin D3, 1,25-dihydroxyvitamin D3 (1,25-(OH)2D3), is known for its critical role in regulating calcium and phosphorous homeostasis and skeletal mineralization. Recent research, however, has suggested that an optimal concentration of 1,25-(OH)2D3 is required for the proper functioning of the cardiac and immune systems, blood pressure regulation, insulin secretion, fetal and brain development (Norman, 2008), and delay in aging phenomena (Tuohimaa, 2009). Evidence of the involvement of 1,25-(OH)2D3 in CNS functioning is accumulating (Lin et al., 2005; Obradovic et al., 2006; Taniura et al., 2006). The first observations concerned the presence of the enzymes involved in 1,25-(OH)2D3 metabolism, as well as the 1,25-(OH)2D3 receptor (VDR), in nervous tissue (reviewed in Garcion et al., 2002); these studies were followed by the finding that 1,25-(OH)2D3 was able to stimulate nerve growth factor (NGF) expression (Neveu et al., 1994). In vivo experiments have demonstrated that transient early life 1,25-(OH)2D3 hypovitaminosis impairs brain development and leads to persistent changes in the adult brain (Féron et al., 2005). More recently, 1,25-(OH)2D3 has acquired relevance in the field of neurodegeneration, since 1,25-(OH)2D3 hypovitaminosis has been associated with neurodegenerative diseases (Fernandes et al., 2009). 1,25-(OH)2D3 appears to have a neuroprotective role, inducing remyelination by endogenous progenitor cells (Goudarzvand et al., 2010) and stimulation of amyloid-β clearance by macrophages of patients with Alzheimer's disease (Masoumi et al., 2009).
The action of 1,25-(OH)2D3 is mediated by VDR, a ligand-activated transcription factor (Pike and Meyer, 2010). VDR is considered a nuclear receptor that is expressed in a wide variety of tissues, including muscle, adipose tissue, bone (Freeman et al., 2007), and embryonic hippocampal cells (Marini et al., 2010). Nevertheless, a fraction of classical VDR has been found in the plasma membrane of target cells, and it is concentrated in lipid microdomains containing caveolin (Huhtakangas et al., 2004). Membrane lipid microdomains are thought to act as platforms for specific proteins (Edidin, 2003; Kenworthy et al., 2004), and to have different functions in protein and lipid sorting (Ikonen, 2001) and in the regulation of cell signaling (Simons and Toomre, 2000). It is known that the ligand-induced receptor clustering is influenced by lipid composition, and it has been suggested that lipid microdomains might have a function in tuning the activity of many transmembrane receptors (Bethani et al., 2010).
We previously reported that 1,25-(OH)2D3 is rapidly incorporated in embryonic hippocampal cells, moves into the nucleus, and then returns to the cytoplasm (Marini et al., 2010). These events delay cell proliferation and induce cell differentiation characterized by expression of differentiation markers, modification of soma lengthening, and increase in neurite length and branching (Marini et al., 2010). We demonstrated the existence in hepatocytes of nuclear lipid microdomains (NLM) that exhibit the characteristic composition of lipid rafts, as they are enriched in sphingomyelin (SM) and cholesterol (CHO); NLM are a specific part of the inner nuclear membrane and may represent a platform for the transcription process (Cascianelli et al., 2008; Albi and Villani, 2009).
In this study, we have investigated the presence of NLM and the localization of VDR in HN9.10e embryonic hippocampal cells. Moreover, in order to study whether NLM are involved in 1,25-(OH)2D3 -dependent differentiation in HN9.10e cells, we have induced alterations in the lipid content of NLM and have analyzed the modifications of 1,25-(OH)2D3 and VDR in the NLM and the expression of the differentiation markers Bcl2 and NGF.
RESULTS
NLM of HN9.10e embryonic hippocampal neurons
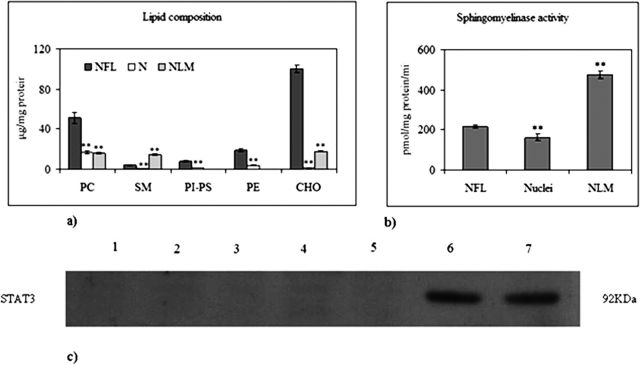
We first investigated the presence of NLM in HN9.10e embryonic hippocampal cells by centrifugation in a sucrose gradient of nuclear extracts obtained with 1% Triton X-100. The floating fractions contained NLM. The lipid composition of NLM was analyzed and compared with that of nuclei-free lysates (NFL) and purified nuclei. The lipid fraction of NFL and nuclei was composed of phosphatidylcholine (PC), SM, phosphatidylinositol (PI), phosphatidylserine (PS), phosphatidylethanolamine (PE), and CHO (Figure 1A), similar to various cell types (Albi and Viola Magni, 2004). The protein content in NFL and purified nuclei was 480.55 ± 39.07 μg/106 cells and 103.70 ± 5.59 μg/106 cells, respectively. In contrast, the NLM lipid fraction had a specific ratio among CHO, PC, and SM equal to ∼1:1:1 (Figure 1A), as previously described for NLM purified from rat liver (Cascianelli et al., 2008), while protein content was 1.4 ± 0.08 μg/106 cells.
FIGURE 1:
NLM in embryonic hippocampal cells. (A) Lipid composition compared with that of NFL and nuclei (N). The data are expressed as μg/mg protein and represent the average ± SD of three experiments performed in duplicate. The values of each lipid in nuclei and in the NLM are different with respect to those of NFL (significance, **p < 0.001). (B) SMase activity compared with that of NFL and nuclei (N). The data are expressed as pmol/mg protein/min and represent the average ± SD of three experiments performed in duplicate. The values for nuclei and NLM are different with respect to those of NFL (significance, **p < 0.001). (C) Immunoblot of STAT3 as purification marker of NML. Seven fractions (1–5 density gradient fractions) plus two floating fractions (6–7) were obtained, and immunoblotting for STAT3 was performed as described in Materials and Methods. The position of the 92-kDa protein was indicated in relation to the position of molecular size standards.
The activity of sphingomyelinase (SMase) was 115.42 ± 8.34, 1962.00 ± 17.15, and 4375.93 ± 180.90 cpm/mg protein/min in NFL, nuclei, and NLM, respectively (Figure 1B). As signal transducer and activator of transcription-3 (STAT3) content is considered a specific marker of NLM (Cascianelli et al., 2008), the expression of this marker was quantified and Figure 1 shows the high degree of NLM purification achieved (Figure 1C).
NLM as platform for 1,25-(OH)2D3–VDR interaction
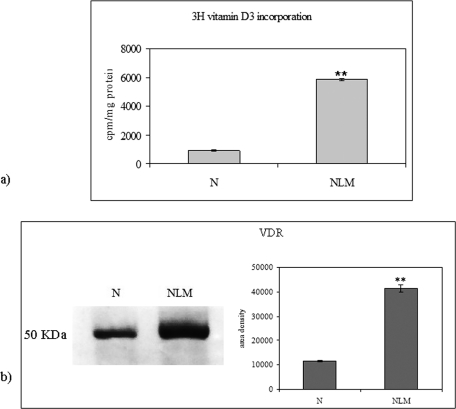
To analyze whether NLM could be a platform for the 1,25-(OH)2D3–VDR interaction, we studied the incorporation of labeled 1,25-(OH)2D3 and the presence of VDR in purified NLM from HN9.10e isolated nuclei after 10 h of incubation. We have previously shown that the labeled vitamin D3 is rapidly incorporated in the HN9.10e, translocated into the nucleus after 10 h of incubation, and then returned to the cytoplasm (Marini et al., 2010). In this study, we showed that the labeled vitamin associated with nuclei and NLM after 10 h of incubation was 902.27 ± 62.79 and 5858.31 ± 79.35 cpm/mg protein, respectively (Figure 2A). At the same time, immunoblotting for VDR detection showed that the receptor band, corresponding to 50-kDa apparent molecular weight, was more intense in NLM than in nuclei (Figure 2B). The analysis of band density indicated that the value increased 3.6-fold in NLM, with respect to the nuclei (Figure 2B).
FIGURE 2:
Vitamin D3 and VDR content in nuclei and NLM of embryonic hippocampal cells. NLM were purified after 10 h (Marini et al., 2010). (A) Comparison of 100 nM [3H]vitamin D3 incorporation in NLM and nuclei (N). The data are expressed as cpm/mg protein and represent the average ± SD of three experiments performed in duplicate (significance, **p < 0.001 vs. nuclei sample). (B) VDR immunoblotting analysis in nuclei and NLM. The position of the 50-kDa protein was indicated in relation to the position of molecular size standards. On the right, area density evaluated by densitometry scanning and analyzed with Scion Image. The data represent the average ± SD of three experiments performed in duplicate (significance, ** p < 0.001 vs. nuclei sample).
Considering the protein concentration of nuclei and NLM, only 1/10 of total nuclear 1,25-(OH)2D3 and 1/20 of total nuclear VDR were associated with NLM. These results demonstrate that 1,25-(OH)2D3 and VDR can be detected in NLM, although they represent only a small fraction of the 1,25-(OH)2D3 and VDR present in the nucleus.
Decrease of SM reduces VDR and 1,25-(OH)2D3 content in NLM
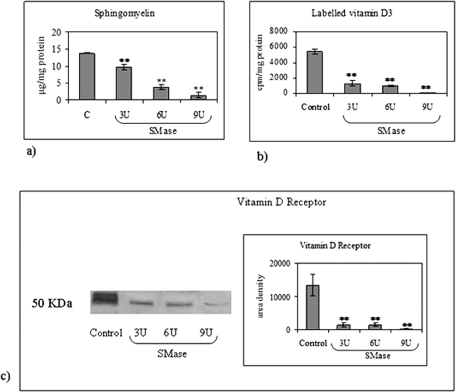
To study whether SM was necessary for the presence of VDR–1,25-(OH)2D3, NLM were treated with increasing concentrations of exogenous SMase (from 3 to 9 U) after 10 h of incubation with labeled 1,25-(OH)2D3. In these conditions, SM content decreased 1.44-, 3.61-, and 9.86-fold with 3, 6, and 9 U, respectively (Figure 3A). Labeled 1,25-(OH)2D3 and VDR decreased: 4.14- and 9.23-fold with 3 U; 5.41- and 8.93-fold with 6 U; and 46.69- and 48.71-fold with 9 U, respectively (Figure 3, B and C). The small differences in the modification of 1,25-(OH)2D3 and VDR content induced by SMase in NLM might be due to the different resolution of the two methods used (radioactivity counting and quantification of Western blotting intensity). The results indicated that a small amount of SM present in NLM was used specifically for ligand–receptor interaction.
FIGURE 3:
Effect of SMase treatment of NLM on SM content, [3H]vitamin D3 incorporation and VDR content. The NLM were purified after 10 h (Marini et al., 2010) and were treated with increasing concentrations of SMase from 3 to 9 U. Untreated sample was used as control (C). (A) SM content. The data are expressed as μg/mg protein and represent the average ± SD of three experiments performed in duplicate (significance, **p < 0.001 vs. control sample). (B) [3H]vitamin D3 incorporation. The data are expressed as cpm/mg protein and represent the average ± SD of three experiments performed in duplicate (significance, **p < 0.001 vs. control sample). (B) VDR immunoblotting analysis. The position of the 50-kDa protein was indicated in relation to the position of molecular size standards. On the right, area density evaluated by densitometry scanning and analyzed with Scion Image. The data represent the average ± SD of three experiments performed in duplicate (significance, ** p < 0.001 vs. control sample).
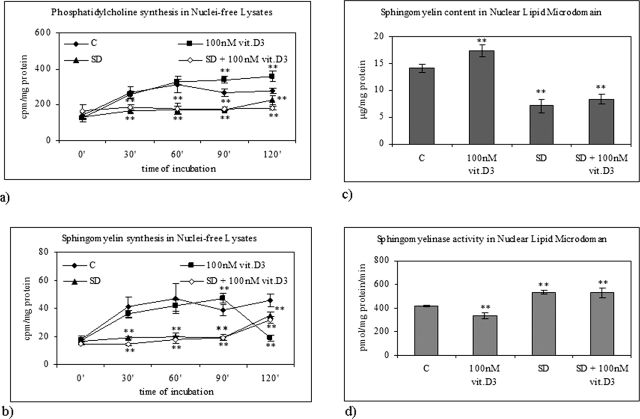
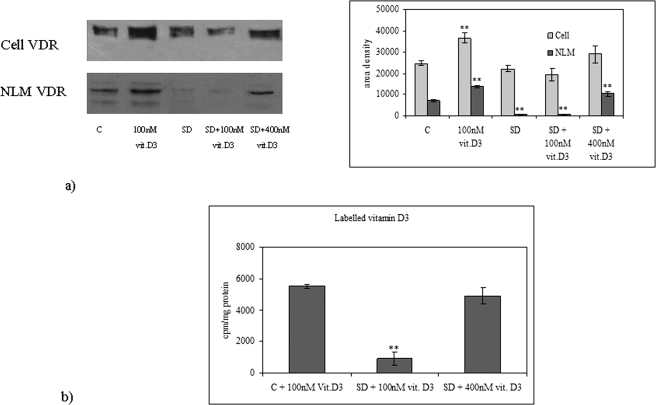
We have previously demonstrated that serum deprivation in HN9.10e cells induces apoptosis and increases SMase activity (Colombaioni et al., 2002; Albi et al., 2006), whereas 100 nM 1,25-(OH)2D3 (physiological concentration) induces cell differentiation (Marini et al., 2010). In a group of experiments, we have studied whether serum deprivation could modify lipid composition in NLM and NFL and 1,25-(OH)2D3–induced differentiation. When cells were cultured in media containing 10% fetal bovine serum (FBS) and 100 nM 1,25-(OH)2D3, PC synthesis increased in NFL during the whole period investigated (Figure 4A), whereas SM synthesis increased for 90 min and decreased afterward (Figure 4B). The presence of 100 nM 1,25-(OH)2D3 during serum deprivation did not modify lipid content compared with serum-deprived cultures (Figure 4, A and B). Figure 4C shows that SM content in NLM increased 1.23-fold in the presence of 100 nM 1,25-(OH)2D3 and decreased 1.99- and 1.68-fold after 10 h of serum deprivation without or with 100 nM 1,25-(OH)2D3, respectively. The reduction of SM content was accompanied by an increase of SMase activity (Figure 4D). The comparison of data obtained following serum deprivation with data obtained with exogenous SMase treatment (Figure 3) shows that the level of SM was lower than that obtained with 3 U SMase and higher than that obtained with 6 U SMase. Moreover, VDR expression increased both in whole cells and in NLM after 10 h of culture in the presence 100 nM 1,25-(OH)2D3, suggesting an increase of VDR synthesis (Figure 5A). Serum deprivation did not change the level of VDR in whole cells but induced a loss of VDR localized in NLM, similar to that induced by 3 and 6 U of SMase. This loss was not prevented by 100 nM 1,25-(OH)2D3 (Figure 5A). The incorporation of labeled 1,25-(OH)2D3 in NLM presented the same pattern (Figure 5B).
FIGURE 4:
Effect of physiological concentration of vitamin D3 in normal and serum-deprivation condition. (A) PC synthesis and (B) SM synthesis in NFL after 2 h. The data indicating [3H]palmitic acid incorporation in PC and SM are expressed as cpm/mg protein and represent the average ± SD of three experiments performed in duplicate (significance, **p < 0.001 vs. control sample). (C) SM content in NLM after 10 h of culture. The data are expressed as μg/mg protein and represent the average ± SD of three experiments performed in duplicate (significance, **p < 0.001 vs. control sample). (D) SMase activity in NLM after 10 h of culture. The data are expressed as cpm/mg protein/min and represent the average ± SD of three experiments performed in duplicate (significance, **p < 0.001 vs. control sample). C, control; SD, serum deprivation.
FIGURE 5:
Vitamin D3 and VDR in NLM in normal and serum-deprivation condition. (A) VDR immunoblotting analysis was performed in whole cells and in NLM after 10 h of culture with 10% FBS (C, control) without or with 100 nM vitamin D3 or in serum-deprivation condition (SD) or in serum deprivation in the presence of physiological concentration of vitamin D3 (SD + 100 nM vit. D3) or in serum deprivation in the presence of high concentration of vitamin D3 (SD + 400 nM vit D3). The position of the 50-kDa protein was indicated in relation to the position of molecular size standards. Area density evaluated by densitometry scanning and analyzed with Scion Image are shown on the right. The data represent the average ± SD of three experiments performed in duplicate (significance, ** p < 0.001 vs. control sample). (B) Comparison of 100 nM [3H]vitamin D3 incorporation in NLM purified from the cells cultured for 10 h with 10% FBS (C, control) or in serum-deprivation condition (SD), and of 400 nM [3H]vitamin D3 incorporation in NLM purified from the cells cultured for 10 h in serum-deprivation condition. The data are expressed as cpm/mg protein and represent the average ± SD of three experiments performed in duplicate (significance, **p < 0.001 vs. control sample).
Reduction of SM in NLM and insensibility to vitamin D3–induced differentiation
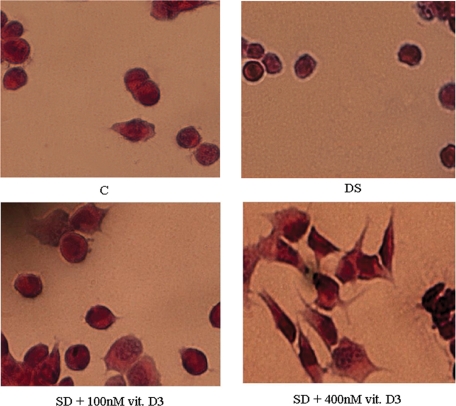
We tested the possibility that the reduction of 1,25-(OH)2D3 and VDR in NLM could modify the effects of 1,25-(OH)2D3 on differentiation. Figure 6 shows the morphology of the cells following these treatments, while Figure 7 shows differentiation markers. Serum deprivation induced rounding of cells and volume shrinkage. Treatment with 100 nM 1,25-(OH)2D3 during serum deprivation reduced cell shrinkage but prevented elongation and/or branching of processes.
FIGURE 6:
Morphology of HN9.10e embryonic hippocampal cells. The cells were cultured for 4 d with 10% FBS (C, control sample) or in serum-deprivation condition (DS) or in serum deprivation in the presence of 100 nM vitamin D3 or in serum-deprivation condition in the presence of 400 nM vitamin D3. Magnification: 40×.
FIGURE 7:
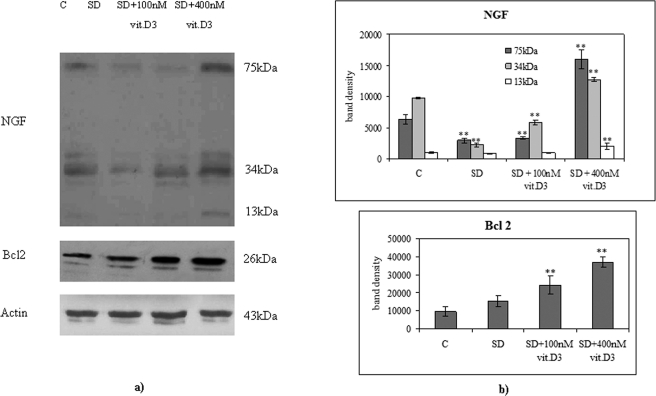
NGF and Bcl2 content in embryonic hippocampal cells. (A) Immunoblot analysis in cells cultured for 15 h with 10% FBS (C, control) or in serum-deprivation condition (SD) or in SD in the presence of 100 nM vitamin D3 or in serum-deprivation condition in the presence of 400 nM vitamin D3. The position of the 75-, 34-, and 13-kDa proteins for NGF; 26-kDa protein for Bcl2; and 43-kDa protein for actin used as control were indicated in relation to the position of molecular size standards. (B) The area density was evaluated by densitometry scanning and analysis with Scion Image. The data represent the average ± SD of three experiments performed in duplicate (significance, ** p < 0.001 vs. control sample).
Bcl2 and NGF expression were analyzed by immunoblotting with specific antibodies after 15 h of treatment. Control cells showed immunoreactivity in correspondence to bands with apparent molecular weights corresponding to 13 kDa (mature NGF), 34 kDa (proNGF), and 75 kDa (high-molecular-weight NGF; Figure 7A). Serum deprivation induced a decrease in the intensity of the 34-kDa and 75-kDa bands of 77 and 54%, respectively, while the reduction after treatment with 100 nM 1,25-(OH)2D3 of serum-deprived cells was 41 and 48%, respectively (Figure 7). No significant variations were reported for the 13-kDa band (Figure 7). The Bcl2 immunopositivity corresponding to bands with 26-kDa apparent molecular weight did not change in serum-deprivation condition, but increased 2.55- and 3.87-fold with 100 and 400 nM 1,25-(OH)2D3, respectively (Figure 7).
High doses of 1,25-(OH)2D3 in serum-deprived cells restore lipid composition, vitamin D3–VDR interaction in NLM, and differentiation
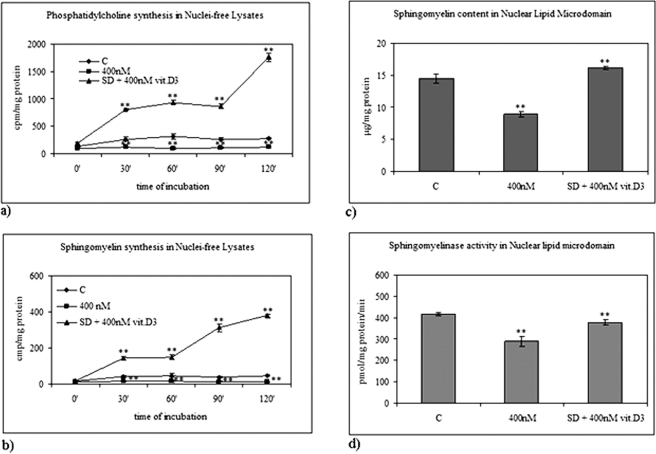
We next asked whether increasing vitamin D3 could modify the effect of serum deprivation on lipid composition, VDR content in NLM, and cell differentiation. The incorporation of [3H]palmitic acid measured in PC and SM in cells grown in 10% FBS in the absence (control) or in the presence of 400 nM 1,25-(OH)2D3 and that measured in serum-deprived cells cultured with the same concentration of the vitamin is shown in Figure 8, A and B. After 2 h of culture, 400 nM 1,25-(OH)2D3 induced a decrease in radioactivity associated to PC and SM in cells grown in 10% FBS and a strong increase in serum-deprived cells (Figure 8, A and B) in NFL. Similar results were obtained in NLM after 10 h, when 1,25-(OH)2D3 reached the NLM, as reported above. The SM content (Figure 8C) and the SMase activity (Figure 8D) were lower than in the control when the vitamin was added in 10% FBS. These results suggest a possible toxic effect with the high concentration of vitamin D3 in these experimental conditions. In addition, the radioactivity incorporated into SM increased 1.12-fold compared with the control when 1,25-(OH)2D3 was added to serum-deprived cells (Figure 8C). SMase activity in serum-deprived cells treated with 400 nM 1,25-(OH)2D3 was higher than that of cells incubated with 1,25-(OH)2D3 in 10% FBS, but did not reach the values of control cells (Figure 8D). Therefore 400 nM 1,25-(OH)2D3 strongly reduced the changes of SM content and SMase activity induced by serum-deprivation conditions (Figure 4). These results induced us to check whether there was a change in VDR content of NLM in those experimental conditions that modify their lipid composition. The content of VDR in NLM obtained from serum-deprived cells treated with 400 nM 1,25-(OH)2D3 was 1.44-fold higher than in the control, and it was slightly lower than that of cells treated with 100 nM 1,25-(OH)2D3 in 10% FBS (Figure 5A). The uptake of labeled 1,25-(OH)2D3 in cells treated with 100 nM 1,25-(OH)2D3 in 10% FBS (Figure 5B) was similar to that in serum-deprived cells treated with 400 nM 1,25-(OH)2D3. The high dose of 1,25-(OH)2D3 in serum deprivation stimulated cell differentiation characterized by modification of soma lengthening and formation of axons and dendrites (Figure 6) and the expression of differentiation markers NGF and Bcl2 (Marini et al., 2010; Lasorella et al., 1995; Figure 7). In fact, the intensity of the three NGF bands increased after 15 h of treatment, compared with the control. The 13-kDa band area analysis (corresponding to the mature NGF) demonstrated an increase of 2.15-fold, whereas an increase of 1.30- and 2.54-fold was obtained in the 34- and 75-kDa bands, respectively (Figure 7). Blc2 immunopositivity at the same time increased 3.87-fold compared with the control (Figure 7).
FIGURE 8:
Effect of high concentration of vitamin D3 in 10% FBS and serum-deprivation condition. (A) PC synthesis and (B) SM synthesis in NFL by 2 h. The data indicating [3H]palmitic acid incorporation in PC and SM are expressed as cpm/mg protein and represent the average ± SD of three experiments performed in duplicate (significance, **p < 0.001 vs. control sample). (C) SM content in NLM after 10 h of culture. The data are expressed as μg/mg protein and represent the average ± SD of three experiments performed in duplicate (significance, **p < 0.001 vs. control sample). (D) SMase activity in NLM after 10 h of culture. The data are expressed as cpm/mg protein/min and represent the average ± SD of three experiments performed in duplicate (significance, **p < 0.001 vs. control sample). C, control; SD, serum deprivation.
DISCUSSION
It is known that VDR functions as a nuclear receptor, but its possible association with NLM has not been explored. We recently demonstrated that lipid microdomains are not only present in the plasma membrane but are also associated with the inner nuclear membrane, where they may act as a platform for the transcription process (Cascianelli et al., 2008). In this article, we report that both VDR and 1,25-(OH)2D3 are found in NLM in HN9.10e embryonic hippocampal cells, suggesting a possible ligand–receptor interaction. Taking into account the content of proteins present in whole nuclei and NLM, the labeled vitamin present in NLM after 10 h of incubation was found to be 1/10 of that present in whole nuclei, indicating that the vitamin might be transferred inside the nucleus after its interaction with VDR in NLM. Even if the amount of VDR present in NLM is small relative to the nuclear content, it could be important for VDR interaction with 1,25-(OH)2D3 and functioning of 1,25-(OH)2D3. In this paper, we also show evidence that conditions that alter lipid content of NLM also modify vitamin D3 and VDR association with NLM and 1,25-(OH)2D3–induced differentiation. Therefore it could be hypothesized that vitamin D3 binding of VDR in NLM may modulate the transcription of genes necessary for differentiation of HN9.10e cells. The VDR-responding elements are involved in transcriptional regulation via ligand-dependent, dynamic chromatin looping; the mechanism of transcriptional regulation cyclically brings the distal elements together either individually or simultaneously next to the transcription start site (Matilainen et al., 2010). One possibility is that the 1,25-(OH)2D3–VDR interaction in NLM could help in this dynamic chromatin looping. However, we cannot exclude the possibility that sequestration of VDR–1,25-(OH)2D3 in NLM could have a role in the modulation of differentiation.
When SM content decreases in NLM, as occurs in serum deprivation known to activate nuclear SMase (Albi et al., 2006) or after treatment with SMase, no VDR and 1,25-(OH)2D3 is found in the NLM. Incubation with 100 nM vitamin D3, which induces differentiation in 10% FBS (Marini et al., 2010), is not able to induce differentiation in serum-deprived cells, but it is able to protect the cells from the volume shrinkage associated with serum deprivation. This is correlated with an increase of Bcl2 expression, which is known to have prosurvival effects. The neuroprotective effect of 1,25-(OH)2D3 is independent of its presence in NLM. It is of worth to note that the contribution of the presence of 1,25-(OH)2D3 in 10% bovine serum (3 nM) is negligible compared with the concentration added (100–400 nM) in the experiments, and it is unlikely that it could contribute to the differences found between cells cultured in the presence or absence of serum plus 1,25-(OH)2D3 (Cho et al., 2006).
Increasing lipid content in NLM, such as in the case of 400 nM 1,25-(OH)2D3 during serum deprivation, correlates with association of 1,25-(OH)2D3 and receptor to NLM and expression of differentiation markers (Bcl2, NGF) followed by morphological differentiation hallmarks, such as neurite growth.
The sprouting of neurites, the growth of an axon, and the extension of neurite trees are key morphological features characterizing neuronal differentiation. These processes are dependent on membrane biosynthesis. Therefore, the production of PC and SM, the major membrane phospholipid and sphingolipid, respectively, are stimulated during neuronal differentiation and the increase of SM in plasma membrane microdomains has been reported (Prinetti et al., 2001). The new and unexpected finding of the present paper is that these lipids also increase in NLM during differentiation. When differentiation is induced with 400 nM 1,25-(OH)2D3 in the absence of serum, SM and PC increase in NFL, as expected, but also in NLM. The mechanism underlying increase of PC synthesis is unknown at the moment, but it could include activation of biosynthetic enzymes or increase of transcription of genes involved in PC and SM synthesis or in inhibition of its degradation. During retinoic acid–induced differentiation of Neuro-2a mouse neuroblastoma cells (Marcucci et al., 2010), PC synthesis was promoted by an early activation of choline kinase α, followed by increase of transcription of the genes coding choline kinase α and choline cytidylyltransferase α. Enforced expression of these enzymes was sufficient to induce PC biosynthesis and a persistent ERK activation, and to trigger neuroblastoma cell differentiation.
In conclusion, our results indicate that physiological doses of 1,25-(OH)2D3 have a protective effect against serum deprivation–induced apoptosis in HN9.10e cells but are not able to induce cell differentiation. We propose that this could be due to the change of lipid composition and reduction of VDR content in NLM. High doses of 1,25-(OH)2D3 have different effects on the activation of lipid metabolism, thus influencing NLM composition through increased VDR, allowing ligand–receptor interaction, and increasing NGF levels that stimulate cell differentiation. So, the differentiative action of 1,25-(OH)2D3, but not the protective action, appears to require the presence of 1,25-(OH)2D3 on NLM.
MATERIALS AND METHODS
Materials
DMEM, bovine serum albumin (BSA), dithiothreitol (DTT), FBS; PC, PE, PS, PI, SM, phenylmethylsulfonylfluoride, 1,25-(OH)2D3, anti-NGF, anti-Bcl2, and anti-STAT3 were obtained from Sigma-Aldrich (St. Louis, MO); TLC plates (silica Gel G60) were from Merck (Darmstadt, Germany); polyclonal anti-VDR was from Abcam (Cambridge, UK); the radioactive SM (choline-methyl 14C; 54 Ci/mol), [3H]vitamin D3, and [3H]palmitic acid were from Amersham Pharmacia Biotech (Rainham, Essex, UK); Ecoscint A was from National Diagnostic (Atlanta, GA).
Cell culture and treatments
Immortalized hippocampal neurons HN9.10e (kind gift of Kieran Breen, Ninewells Hospital, Dundee, UK) were grown in DMEM supplemented with 10% FBS, 2 mM l-glutamine, 100 IU/ml penicillin, 100 μg/ml streptomycin, and 2.5 μg/ml amphotericin B (Fungizone).
Cells were maintained at 37°C in a saturating humidity atmosphere containing 95% air and 5% CO2.
In the serum-deprivation experiments, 4 × 10⁶ HN9.10e cells were plated in 10-cm Petri dishes; after 24 h, the cells were washed with serum-free DMEM and cultured with DMEM containing 0.2% FBS (Albi et al., 2006) in the absence or presence of 100 nM or 400 nM vitamin D3 suspended in absolute ethanol.
Morphological analysis of HN9.10e
The cells were cultured for 4 d in serum-deprivation conditions in the presence of 100 nM or 400 nM vitamin D3. Cells cultured in normal culture medium were used as control samples. The cells were fixed with 95% ethanol for 5 min and stained with hematoxylin-eosin (Chroma-Gesellschaft, Baden-Württemberg, Germany). The preparations were examined on an Olympus (Hamburg, Germany) IX 51 light microscope equipped with an Olympus DP 50 camera system, and analyzed at 40× magnification.
NFL preparation
The cells were washed twice with phosphate-buffered saline (PBS) and centrifuged at 800 × g for 10 min. The resulting pellet was suspended in hypotonic buffer (1.5 M sucrose, 3 mM CaCl2, 2 mM magnesium acetate, 0.5 mM DTT, 1 mM phenylmethylsulfonylfluoride [PMSF], 3 mM Tris-HCl, pH 8.0 [1 ml/106cells]) and gently homogenized using a tight-fitting Teflon-glass homogenizer. Part of the homogenate was used for nuclei isolation and part was centrifuged at 500 × g for 30 min at 4°C for NFL preparation (Jaffrezou et al., 2001).
Purification of cell nuclei
The nuclei were isolated as previously reported (Albi et al., 2005). Briefly, the homogenized cells were treated with 1% Triton X-100 in hypotonic buffer (0.5:1 vol/vol), the cellular suspension was stirred on a vortex mixer for 30 s, and the buffer containing 1.5 M sucrose was then added (0.25:1 vol/vol). After centrifugation at 2000 × g for 10 min, the resulting pellet containing nuclei was washed twice with 0.085 M KCl, 0.0085 M NaCl, 0.0025 M MgCl2, trichloroacetic acid (TCA)-HCl 0.005 M (pH 7.2), as previously reported (Barnes et al., 1957; Albi et al., 2005). This treatment prevents contamination of the pellet by mitochondria and microsomes, which require a higher gravity value for sedimentation. The nuclei were then quickly treated in 10 mM Tris (pH 7.5) containing 2.5 mM MgCl2, 0.5 mM PMSF, and 1% Triton X-100, in order to remove the external nuclear membranes while preserving the inner nuclear membranes. The nuclei were then centrifuged at 1000 × g for 15 min. The nuclei were also checked for possible cytoplasmic contamination by evaluating the glucose-6-phosphatase activity and NADH-cytochrome C-reductase activity (Albi et al., 2006).
NLM isolation
NLM were prepared according to Cascianelli et al. (2008). The extraction was carried out with Triton X-100 dissolved in distilled water (10% vol/vol) on ice. This solution was added to the purified nuclei to a final detergent concentration of 1% (vol/vol). The extract was placed in a cushion of 80% sucrose with a gradient of 15–40% sucrose on top. After overnight centrifugation, the gradients were collected in five 2-ml fractions plus two 1-ml floating fractions for STAT3 analysis by SDS–PAGE and Western blotting. In other experiments, floating fractions were carefully collected with a pipette, diluted five times with 25 mM HEPES-HCl, 150 mM NaCl (pH 7.1), and centrifuged at 100,000 × g for 2 h to obtain a pellet of microdomains for biochemical determinations.
Biochemical determinations
Protein content was determined according to Lowry et al. (1951). The nucleic acids were extracted and analyzed according to Cascianelli et al. (2008).
Lipid analysis
Lipid analysis was carried out in NFL, nuclei, and NLM as previously described (Rossi et al., 2007). Lipids were extracted with 20 volumes of chloroform/methanol (2:1 vol/vol). The organic phase was washed with 0.2 volumes of 0.5% NaCl. After separation, the aqueous phase was extracted again, twice with chloroform and methanol and once with solvent containing NaCl, since lipids were present also in the second and third extractions. The total amount of phospholipids (PLs) was determined by measuring inorganic phosphorus. Each PL was separated by TLC in a mono-dimensional system by using chloroform/methanol/ammonia (65:25:4 by volume) as the solvent. PC, PE, PS, PI, and SM were localized with iodine vapor on the basis of standards migration. To evaluate the content of each PL, the spots were then scraped, and the amount was quantified by measuring the inorganic phosphorous.
To evaluate the [3H]SM or [3H]PC synthesis, we incubated the cells with 1 μCi/ml of 3[H]palmitic acid and diluted them with cold palmitic acid to a final concentration of 20 nM in culture medium containing 10% FBS for different times. At 0, 30, 60, 90, and 120 min the cells from four to six plates were pooled and the NFL were isolated. The lipids were extracted and separated as previously described. The SM and PC spots were scraped and suspended in counting vials with 10 ml Ecoscint A and 1 ml water, and the radioactivity was measured with a Packard (Meriden, CT) liquid scintillation analyzer.
SMase activity
The SMase activity was measured as previously reported (Albi et al., 2006). In the reactions, 1.6 nmol of [14C]SM was diluted by adding 78.4 nmol cold SM (final specific activity: 1.08 Ci/mol). The reaction mixture contained 0.1 M Tris-HCl (pH 7.2 for NFL, pH 7.6 for nuclei, and pH 8.2 for NLM), 0.1 mM [14C]SM, 6 mM MgCl2, 0.1% Triton X-100, and 100 μg protein to a final volume of 0.1 ml. Incubation was performed at 37°C for 45 min. The reaction was stopped by adding 2 ml chloroform/methanol (2:1 vol/vol); 0.4 ml of 0.5% NaCl was added to the tubes under agitation. The next day, the upper phase was removed and diluted in counting vials with 10 ml Ecoscint A and 1 ml water, and the radioactivity was measured with a Packard liquid scintillation analyzer.
Labeled 1,25-(OH)2D3 incorporation in NLM
[3H]vitamin D3 was diluted to final concentration of 10 or 40 μM. Cells were cultured with medium containing 10% FBS in the absence or presence of 100 [3H]vitamin D3 or in serum-deprivation condition in the absence or presence of 100 or 400 nM [3H]vitamin D3.
After 10 h, which represents the optimum time for vitamin D3 to reach the nucleus (Marini et al., 2010), the medium was removed, and cells were collected and centrifuged at 300 × g for 6 min. After two washes with PBS, the NFL, nuclei, and NLM were prepared. The radioactivity was evaluated in counting vials by diluting the samples with 10 ml of Ecoscint A and 1 ml of water and was measured with a Packard liquid scintillation analyzer.
SMase treatment
Purified NLM were incubated with 0.1 M Tris-HCl (pH 8.4), 6 mM MgCl2, 0.1% Triton X-100 in the presence of 3, 6, and 9 U (100 U/mg protein) SMase at 37°C to a final volume of 0.5 ml. After 60 min, the sample was centrifuged at 15,000 × g for 20 min. The resulting pellet was recovered, and SM content, labeled vitamin D3, or VDR were analyzed as previously described.
Electrophoresis and Western blot analysis
The analysis was performed in the cells cultured with 10% FBS or 0.2% FBS in absence or presence of 100 or 400 nM 1,25-(OH)2D3. The presence of VDR was evaluated in nuclei and NLM, whereas STAT3 was evaluated only in NLM after 10 h of culture, which is considered the optimal time to test for the presence of 1,25-(OH)2D3 in the nucleus (Marini et al., 2010). The presence of NGF and Bcl2 was evaluated in cell lysates after 15 h of culture, which is considered the optimal time for the increase of NGF and Bcl2 following to cell stimulation with 100 nM 1,25-(OH)2D3 (Marini et al., 2010).
Proteins (∼30 μg) underwent SDS–PAGE electrophoresis in 12% polyacrylamide slab gel according to Laemmli (1970). The transfer of protein was carried out into nitrocellulose in 90 min according to Towbin et al. (1979). The membranes were blocked for 30 min with 5% nonfat dry milk in PBS (pH 7.5), and incubated overnight at 4°C with antibody anti-VDR, anti-STAT 3, anti-NGF, anti-actin, and anti-Bcl2.
The blots were treated with horseradish-conjugated secondary antibodies for 90 min. Visualization was performed with the Enhanced Chemiluminescence (ECL) kit from Amersham. The position of the protein was indicated in relation to the position of molecular size standards. The area density was evaluated by densitometry scanning and analysis with Scion Image software (http://scion-image-software.fyxm.net).
Statistical analysis
Data are expressed as average ± SD, and Student's t test was used for statistical analysis.
Acknowledgments
We acknowledge support from Agenzia Spaziale Italiana.
Abbreviations used:
- BSA
bovine serum albumin
- CHO
cholesterol
- DTT
dithiothreitol
- 1,25-(OH)2D3,
1,25-dihydroxyvitamin D3
- FBS
fetal bovine serum
- NFL
nuclei-free lysates
- NGF
nerve growth factor
- NLM
nuclear lipid microdomains
- PBS
phosphate-buffered saline
- PC
phosphatidylcholine
- PE
phosphatidylethanolamine
- PI
phosphatidylinositol
- PL
phospholipid
- PMSF
phenylmethylsulfonylfluoride
- PS
phosphatidylserine
- SM
sphingomyelin
- STAT3
signal transducer and activator of transcription-3
- TCA
trichloroacetic acid
- VDR
1,25-(OH)2D3 receptor
Footnotes
This article was published online ahead of print in MBoC in Press (http://www.molbiolcell.org/cgi/doi/10.1091/mbc.E11-03-0196) on July 7, 2011.
REFERENCES
- Albi E, Cataldi S, Bartoccini E, Magni MV, Marini F, Mazzoni F, Rainaldi G, Evangelista M, Garcia-Gil M. Nuclear sphingomyelin pathway in serum deprivation-induced apoptosis of embryonic hippocampal cells. J Cell Physiol. 2006;206:189–195. doi: 10.1002/jcp.20448. [DOI] [PubMed] [Google Scholar]
- Albi E, La Porta CA, Cataldi S, Magni MV. Nuclear sphingomyelin-synthase and protein kinase C δ in melanoma cells. Arch Biochem Biophys. 2005;438:156–161. doi: 10.1016/j.abb.2005.04.004. [DOI] [PubMed] [Google Scholar]
- Albi E, Villani M. Nuclear lipid microdomains regulate cell function. Commun Integr Biol. 2009;2:23–24. doi: 10.4161/cib.2.1.7376. [DOI] [PMC free article] [PubMed] [Google Scholar]
- Albi E, Viola Magni MP. The role of intranuclear lipids. Biol Cell. 2004;96:657–667. doi: 10.1016/j.biolcel.2004.05.004. [DOI] [PubMed] [Google Scholar]
- Barnes DWH, Esnouf MP, Stocken LA. Some experiments in favour of the cellular hypothesis for the spleen curative factor. In: Forssberg AG, Abbatt JD JD, editors. Advances in Radiobiology. Edinburgh, UK: Oliver and Body; 19571957. pp. 211–213. [Google Scholar]
- Bethani I, Skånland SS, Dikic I, Acker-Palmer A. Spatial organization of transmembrane receptor signalling. EMBO J. 2010;29:2677–2688. doi: 10.1038/emboj.2010.175. [DOI] [PMC free article] [PubMed] [Google Scholar]
- Cascianelli G, Villani M, Tosti M, Marini F, Bartoccini E, Magni MV, Albi E. Lipid microdomains in cell nucleus. Mol Biol Cell. 2008;19:5289–5295. doi: 10.1091/mbc.E08-05-0517. [DOI] [PMC free article] [PubMed] [Google Scholar]
- Cho YM, Choi H, Hwang IH, Kim YK, Myung KH. Effects of 25-hydroxyvitamin D3 and manipulated dietary cation-anion difference on the tenderness of beef from cull native Korean cows. J Anim Sci. 2006;84:1481–1488. doi: 10.2527/2006.8461481x. [DOI] [PubMed] [Google Scholar]
- Colombaioni L, Frago LM, Varela-Nieto I, Pesi R, Garcia-Gil M. Serum deprivation increases ceramide levels and induces apoptosis in undifferentiated HN9.10e cells. Neurochem Int. 2002;40:327–336. doi: 10.1016/s0197-0186(01)00090-0. [DOI] [PubMed] [Google Scholar]
- Edidin M. The state of lipid rafts: from model membrane to cells. Annu Rev Biophys Biomol Struct. 2003;32:257–283. doi: 10.1146/annurev.biophys.32.110601.142439. [DOI] [PubMed] [Google Scholar]
- Fernandes de Abreu DA, Eyles D, Féron F. Vitamin D, a neuro-immunomodulator: implications for neurodegenerative and autoimmune diseases. Psychoneuroendocrinology. 2009;34(1):S265–S277. doi: 10.1016/j.psyneuen.2009.05.023. [DOI] [PubMed] [Google Scholar]
- Féron F, Burne TH, Brown J, Smith E, McGrath JJ, Mackay-Sim A, Eyles DW. Developmental vitamin D3 deficiency alters the adult rat brain. Brain Res Bull. 2005;65:141–148. doi: 10.1016/j.brainresbull.2004.12.007. [DOI] [PubMed] [Google Scholar]
- Freeman MR, Cinar B, Kim J, Mukhopadhyay NK, Di Vizio D, Adam RM, Solomon KR. Transit of hormonal and EGF receptor-dependent signals through cholesterol-rich membranes. Steroids. 2007;72:210–217. doi: 10.1016/j.steroids.2006.11.012. [DOI] [PMC free article] [PubMed] [Google Scholar]
- Garcion E, Wion-Barbot N, Montero-Menei CN, Berger F, Wion D. New clues about vitamin D functions in the nervous system. Trends Endocrinol Metab. 2002;13:100–105. doi: 10.1016/s1043-2760(01)00547-1. [DOI] [PubMed] [Google Scholar]
- Goudarzvand M, Javan M, Mirnajafi-Zadeh J, Mozafari S, Tiraihi T. Vitamins E and D3 attenuate demyelination and potentiate remyelination processes of hippocampal formation of rats following local injection of ethidium bromide. Cell Mol Neurobiol. 2010;30:289–299. doi: 10.1007/s10571-009-9451-x. [DOI] [PMC free article] [PubMed] [Google Scholar]
- Huhtakangas JA, Olivera CJ, Bishop JE, Zanello LP, Norman AW. The vitamin D receptor is present in caveolae-enriched plasma membranes and binds 1 alpha,25(OH)2-vitamin D3 in vivo and in vitro. Mol Endocrinol. 2004;18:2660–2671. doi: 10.1210/me.2004-0116. [DOI] [PubMed] [Google Scholar]
- Ikonen E. Roles of lipid rafts in membrane transport. Curr Opin Cell Biol. 2001;13:470–477. doi: 10.1016/s0955-0674(00)00238-6. [DOI] [PubMed] [Google Scholar]
- Jaffrezou JP, Bruno AP, Moisand A, Levade T, Laurent G. Activation of a nuclear sphingomyelinase in radiation-induced apoptosis. FASEB J. 2001;15:123–133. doi: 10.1096/fj.00-0305com. [DOI] [PubMed] [Google Scholar]
- Kenworthy AK, Nichols BJ, Remmert CL, Hendrix GM, Kumar M, Zimmerberg J, Lippincott-Schwartz J. Dynamics of putative raft-associated proteins at the cell surface. J Cell Biol. 2004;165:735–746. doi: 10.1083/jcb.200312170. [DOI] [PMC free article] [PubMed] [Google Scholar]
- Laemmli UK. Cleavage of structure proteins during the assembly of bacteriophage T4. Nature. 1970;227:680–683. doi: 10.1038/227680a0. [DOI] [PubMed] [Google Scholar]
- Lasorella A, Iavarone A, Israel MA. Differentiation of neuroblastoma enhances Bcl-2 expression and induces alterations of apoptosis and drug resistance. Cancer Res. 1995;55:4711–4716. [PubMed] [Google Scholar]
- Lin AM, Chen KB, Chao PL. Antioxidative effect of vitamin D3 on zinc-induced oxidative stress in CNS. Ann NY Acad Sci. 2005;1053:319–329. doi: 10.1196/annals.1344.028. [DOI] [PubMed] [Google Scholar]
- Lowry OH, Rosebrough NJ, Farr AL, Randall RJ. Protein measurement with folin phenol reagent. J Biol Chem. 1951;193:265–275. [PubMed] [Google Scholar]
- Marcucci H, Paoletti L, Jackowski S, Banchio C. Phosphatidylcholine biosynthesis during neuronal differentiation and its role in cell fate determination. J Biol Chem. 2010;285:25382–25393. doi: 10.1074/jbc.M110.139477. [DOI] [PMC free article] [PubMed] [Google Scholar]
- Marini F, Bartoccini E, Cascianelli G, Voccoli V, Baviglia MG, Magni MV, Garcia-Gil M, Albi E. Effect of 1alpha,25-dihydroxyvitamin D3 in embryonic hippocampal cells. Hippocampus. 2010;20:696–705. doi: 10.1002/hipo.20670. [DOI] [PubMed] [Google Scholar]
- Masoumi A, et al. 1alpha,25-dihydroxyvitamin D3 interacts with curcuminoids to stimulate amyloid-beta clearance by macrophages of Alzheimer's disease patients. J Alzheimer's Dis. 2009;17:703–717. doi: 10.3233/JAD-2009-1080. [DOI] [PubMed] [Google Scholar]
- Matilainen JM, Malinen M, Turunen MM, Carlberg C, Väisänen S. The number of vitamin D receptor binding sites defines the different vitamin D responsiveness of the CYP24 gene in malignant and normal mammary cells. J Biol Chem. 2010;285:24174–24183. doi: 10.1074/jbc.M110.124073. [DOI] [PMC free article] [PubMed] [Google Scholar]
- Neveu I, Naveilhan P, Jehan F, Baudet C, Wion D, De Luca HF, Brachet P. 1,25-dihydroxyvitamin D3 regulates the synthesis of nerve growth factor in primary cultures of glial cells. Brain Res Mol Brain Res. 1994;24:70–76. doi: 10.1016/0169-328x(94)90119-8. [DOI] [PubMed] [Google Scholar]
- Norman AW. From vitamin D to hormone D: fundamentals of the vitamin D endocrine system essential for good health. Am J Clin Nutr. 2008;88:491S–499S. doi: 10.1093/ajcn/88.2.491S. [DOI] [PubMed] [Google Scholar]
- Obradovic D, Gronemeyer H, Lutz B, Rein T. Cross-talk of vitamin D and glucocorticoids in hippocampal cells. J Neurochem. 2006;96:500–509. doi: 10.1111/j.1471-4159.2005.03579.x. [DOI] [PubMed] [Google Scholar]
- Pike JW, Meyer MB. The vitamin D receptor: new paradigms for the regulation of gene expression by 1,25-dihydroxyvitamin D(3) Endocrinol Metab Clin North Am. 2010;39:255–269. doi: 10.1016/j.ecl.2010.02.007. [DOI] [PMC free article] [PubMed] [Google Scholar]
- Prinetti A, Chigorno V, Prioni S, Loberto N, Marano N, Tettamanti G, Sonnino S. Changes in the lipid turnover, composition, and organization, as sphingolipid-enriched membrane domains, in rat cerebellar granule cells developing in vitro. J Biol Chem. 2001;276:21136–21145. doi: 10.1074/jbc.M010666200. [DOI] [PubMed] [Google Scholar]
- Rossi G, Magni MV, Albi E. Sphingomyelin-cholesterol and double stranded RNA relationship in the intranuclear complex. Arch Biochem Biophys. 2007;459:27–32. doi: 10.1016/j.abb.2006.11.020. [DOI] [PubMed] [Google Scholar]
- Simons K, Toomre D. Lipid rafts and signal transduction. Nat Rev Mol Cell Biol. 2000;1:31–39. doi: 10.1038/35036052. [DOI] [PubMed] [Google Scholar]
- Taniura H, Ito M, Sanada N, Kuramoto N, Ohno Y, Nakamichi N, Yoneda Y. Chronic vitamin D3 treatment protects against neurotoxicity by glutamate in association with upregulation of vitamin D receptor mRNA expression in cultured rat cortical neurons. J Neurosci Res. 2006;83:1179–1189. doi: 10.1002/jnr.20824. [DOI] [PubMed] [Google Scholar]
- Towbin H, Staehelin T, Gordon J. Electrophoretic transfer of proteins from polyacrylamide gels to nitrocellulose sheets: procedure and some applications. Proc Natl Acad Sci USA. 1979;76:4350–4354. doi: 10.1073/pnas.76.9.4350. [DOI] [PMC free article] [PubMed] [Google Scholar]
- Tuohimaa P. Vitamin D and aging. J Steroid Biochem Mol Biol. 2009;114:78–84. doi: 10.1016/j.jsbmb.2008.12.020. [DOI] [PubMed] [Google Scholar]


