

Abstract
To assess the in vivo effects of therapeutic interventions for the treatment of muscle disease 1,2,3, quantitative methods are needed that measure force generation and fatigability in treated muscle. We describe a detailed approach to evaluating myo-mechanical properties in freshly explanted hindlimb muscle from the mouse. We describe the atraumatic harvest of mouse extensor digitorum longus muscle, mounting the muscle in a muscle strip myograph (Model 820MS; Danish Myo Technology), and the measurement of maximal twitch and tetanic tension, contraction time, and half-relaxation time, using a square pulse stimulator (Model S48; Grass Technologies). Using these measurements, we demonstrate the calculation of specific twitch and tetanic tension normalized to muscle cross-sectional area, the twitch-to-tetanic tension ratio, the force-frequency relationship curve and the low frequency fatigue curve 4. This analysis provides a method for quantitative comparison between therapeutic interventions in mouse models of muscle disease 1,2,3,5, as well as comparison of the effects of genetic modification on muscle function 6,7,8,9.
Keywords: Medicine, Issue 48, muscle, twitch, tetanus, force-frequency, fatigue
Protocol
The protocol is performed with the approval of the UCSF Institutional Animal Care and Use Committee (IACUC).
1. Dissection of the Mouse Extensor Digitorum Longus (EDL) Muscle
Perform all animal procedures in accordance with institutional guidelines.
Euthanize animal with 200 mg/kg intraperitoneal pentobarbital/cervical dislocation just prior to muscle harvest 10. The dissection should be well practiced so that the muscle can be harvested and mounted in the tension transducer within 15 minutes of euthanasia.
Arrange carcass supine on dissection tray and pin leg to tray.
Under dissection microscope, open skin, carefully open fascia (Fig.1A), and peel tibialis from the ankle upwards to expose EDL (Fig.1B). Use drops of lactated Ringer's solution to keep the muscle moist and buffered during the harvest.
Remove EDL, preserving as much tendon as possible on each end, and put into a Petri dish containing lactated Ringer's solution. Tie suture to each of the muscle tendons (Fig.1C). It is essential that the muscle fibers not be touched or disturbed during the dissection.
2. Mounting of the Mouse EDL in the Muscle Strip Myograph
For these studies, a tissue bath is needed that secures the muscle while allowing it to bathe in physiological solution at constant temperature with continuous oxygenation. The bath is coupled with a force transducer for the measurement of muscle tension. We employ an integrated muscle strip myograph bath from Danish Myo Technology (DMT Model 820MS) for this purpose. In addition, a square pulse electrical stimulator (Grass Model S48) and data acquisition platform (ADInstruments PowerLab Data Acquisition System and LabChart software) are needed to elicit, record and analyze myo-mechanical responses, respectively. The DMT 820MS has platinum electrodes integrated into the chamber cover that are positioned on either side of the muscle, in the mid-portion of the muscle strip. Other myographs may require specific attention to electrode placement.
Fill myograph bath with 5 mL Krebs Henseleit solution 11. Warm to 25°C. Bubble O2/CO2 (95%/5%) through bath for 15 minutes prior to use.
Use sutures to extend EDL between clamps of myograph and secure the tendons of the EDL muscle (Fig.1D,E) between the clamps. Be careful not to clamp the muscle itself.
Maintain myograph bath at 25°C.
3. Myo-mechanical Analysis
A. Twitch tension
Set initial length in the bath so that there is no muscle laxity.
Determine maximal stimulus (duration 0.5 ms) by adjusting voltage in order to obtain maximal twitch tension, then set stimulus at 20% above maximal (to achieve supramaximal stimulus). In our studies, the supramaximal stimulus is usually achieved at an output of 40 volts.
Verify output from the stimulator using an oscilloscope.
Determine optimal length by gradually stretching the muscle until there is no further increase in twitch tension.
Allow muscle to equilibrate for 3 min.
Deliver supramaximal square stimulus (0.5 ms) at optimal length using Grass S44 electronic stimulator, and record output.
Record: twitch tension curve (Pt vs time; Fig.2A).
B. Tetanus tension
Allow muscle to rest for 3 minutes.
Apply a train of supramaximal stimuli for 300msec at 150 Hz at optimal length using Grass S44 electronic stimulator, and record output.
Record: tetanus tension curve (Po vs time; Fig.2B).
C. Force-frequency
Allow muscle to rest for 3 minutes.
Force-frequency: apply trains of supramaximal stimuli at 30, 60, 100, 140, and 160 Hz with 3 minutes rest between each stimulus (Fig.3). Alternatively, trains may be applied 15, 25, 35, 45, 55, 65, 75, 100, 140 and 160 Hz for better resolution at lower frequencies, where force changes substantially.
Plot: force-frequency relationship (% maximal force vs stimulation frequency).
D. Fatigue
Apply train of short tetani: 60 Hz for 300 ms (or frequency adjusted to produce 50% of peak force), every 3 seconds for 10 minutes. By 10 minutes, the tetanic force should decline to a plateau level of ~15% of the initial value (Fig.4).
Plot: low frequency fatigue (% maximal force vs time).
E. Additional data collection at end of protocol
Before unmounting the muscle from the myograph, set the muscle at optimal length as determined in step III.A.4 and measure its diameter using either an ocular on the microscope or with calipers. Calculate cross-sectional area (μm2).
Measure muscle mass (mg) by removing sutures and weighing muscle.
Weigh mouse to assess body mass (gm).
4. Calculations
Muscle:body mass ratio = muscle mass/body mass
Twitch tension, Pt (mN) = maximum tension generated during twitch
Specific twitch tension (N/cm2) = twitch tension (mN)/cross-sectional area (μm2) x 105 N/mN•μm2/cm2
Time to peak tension (ms) = time from onset of contraction to maximum tension
Half-relaxation time (ms) = time from peak tension to 50% of peak tension
Tetanic tension, PO (mN) = maximum tension generated during tetanus
Specific tetanic tension (N/cm2) = tetanic tension (mN)/cross-sectional area (μm2) x 105 N/mN•μm2/cm2
Maximal rate of rise of tetanus (N/s) = maximum rate of increase in tension during the tension rise in tetanus, i.e., the maximum slope of the tetanic tension curve (or, dPO/dt)
Half-relaxation tetanic tension (ms) = time from cessation of stimulation to 50% of the tension at termination of stimulation
Twitch tension-to-tetanic tension ratio, Pt/PO = maximum twitch tension/maximum tetanic tension
Fatigue index= ratio of tension after two minutes of low frequency fatigue to maximal isometric tension
5. Representative Results
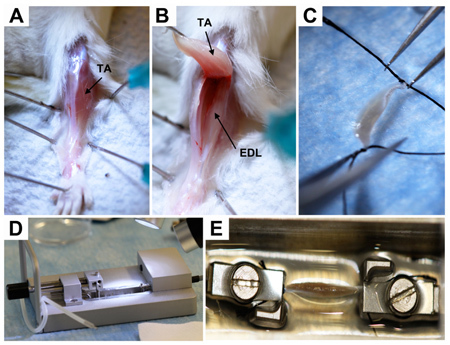 Figure 1. Dissection of EDL muscle. A, Exposure of hindlimb muscles.TA, tibialis anterior. B, Exposure of EDL (extensor digitorum longus) muscle.C, Attachment of sutures to EDL tendons.D, Tension transducer bath (view from side). E, EDL mounted in bath (view from above). The muscle in incompletely immersed in the buffer for illustrative purposes; in practice, the muscle should be completely immersed to prevent from drying out.
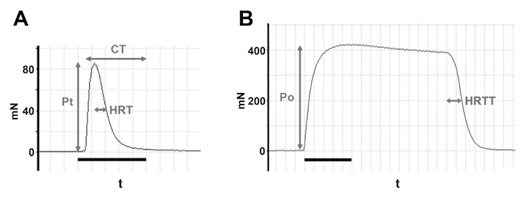 Figure 2. Example of tension curves. A, Example of twitch tension curve illustrating maximal twitch tension (Pt), contraction time (CT) and half-relaxation time (HRT).Bar, 1s. B, Example of tetanic tension curve showing maximal tetanic tension (Po) and half-relaxation tetanic tension (HRTT). Bar, 1s.
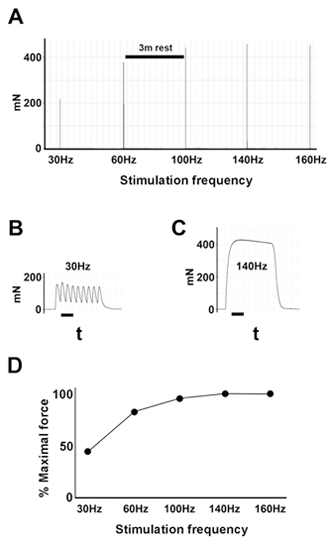 Figure 3. Example of force-frequency relationship analysis. A, Tensions generated by incremental stimulation frequencies.B, Example of pulse train at 30MHz. Bar, 80ms. C, Example of pulse train at 140MHz. Bar, 80ms. D, Example of force-frequency curve derived from data shown in A. The shape of the force-frequency curve is characteristic of muscle strength, and can be compared between muscles from different animals.
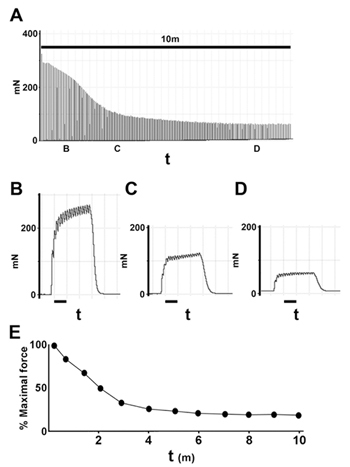 Figure 4. Example of low frequency fatigue analysis. A, Decremental tensions generated over period of low frequency stimulation.Examples of pulse trains at indicated time points (B,C,D) are shown below. E, Example of low frequency fatigue curve derived from data shown in A. The shape of the low frequency fatigue curve is characteristic of muscle strength, and can be compared between muscles from different animals.
Discussion
We describe a detailed approach to evaluating myo-mechanical properties in explanted hindlimb muscle from the mouse. The EDL, while more difficult to dissect because of its posterior position behind the tibialis anterior muscle, is easier to evaluate than the tibialis anterior because of its prominent tendinous attachments to the ankle and knee joints. These tendons facilitate mounting in the muscle strip myograph. In contrast, the more easily accessed tibialis anterior has a broad, almost atendinous attachment at the knee joint, making it exceptionally difficult to both dissect without compromising the muscle, and mount securely in the myograph. We also point out that rapidly mounting the muscle in an oxygenated bath in physiological buffer and temperature is essential to preserving the muscle's mechanical properties. We have found that we can repeat this analysis for up to 30 minutes without significant changes in muscle response under these conditions. Finally, it is essential that the muscle fibers not be touched during the dissection and mounting procedures, as this can have adverse effects on muscle function, and result in underestimation of myo-mechanical force. By following these procedures, this analysis provides a robust quantitative approach to evaluating the effects of genetic modification on muscle function 6,7,8,9, as well as comparison between therapeutic interventions in mouse models of muscle disease 1,2,3,5.
Disclosures
No conflicts of interest declared.
Acknowledgments
This work was supported by a Public Health Service Grant (HL086513) from NHLBI to P.E.O, and a Comprehensive Research Grant from the California Institute for Regenerative Medicine (RC1-00104), a Public Health Service Grant (HL085377) from NHLBI, and a gift from the Pollin Foundation to H.S.B.
S.C. was supported by a California Institute for Regenerative Medicine Bridges to Stem Cell Research Award (TB1-01194) to San Francisco State University.
References
- Harcourt LJ, Schertzer JD, Ryall JG, Lynch GS. Low dose formoterol administration improves muscle function in dystrophic mdx mice without increasing fatigue. Neuromuscul Disord. 2007;17:47–55. doi: 10.1016/j.nmd.2006.08.012. [DOI] [PubMed] [Google Scholar]
- Messina S. VEGF overexpression via adeno-associated virus gene transfer promotes skeletal muscle regeneration and enhances muscle function in mdx mice. FASEB J. 2007;21:3737–3746. doi: 10.1096/fj.07-8459com. [DOI] [PubMed] [Google Scholar]
- Danieli-Betto D. Sphingosine 1-phosphate protects mouse extensor digitorum longus skeletal muscle during fatigue. Am J Physiol Cell Physiol. 2005;288:C1367–C1373. doi: 10.1152/ajpcell.00246.2004. [DOI] [PubMed] [Google Scholar]
- MacIntosh BR, Willis JC. Force-frequency relationship and potentiation in mammalian skeletal muscle. J Appl Physiol. 2000;88:2088–2096. doi: 10.1152/jappl.2000.88.6.2088. [DOI] [PubMed] [Google Scholar]
- Hayes A, Williams DA. Contractile properties of clenbuterol-treated mdx muscle are enhanced by low-intensity swimming. J Appl Physiol. 1997;82:435–439. doi: 10.1152/jappl.1997.82.2.435. [DOI] [PubMed] [Google Scholar]
- Coulton GR, Curtin NA, Morgan JE, Partridge TA. The mdx mouse skeletal muscle myopathy: II. Contractile properties. Neuropathol Appl Neurobiol. 1988;14:299–314. doi: 10.1111/j.1365-2990.1988.tb00890.x. [DOI] [PubMed] [Google Scholar]
- Danieli-Betto D. Deficiency of alpha-sarcoglycan differently affects fast- and slow-twitch skeletal muscles. Am J Physiol Regul Integr Comp Physiol. 2005;289:R1328–R1337. doi: 10.1152/ajpregu.00673.2004. [DOI] [PubMed] [Google Scholar]
- Chan S. A gene for speed: contractile properties of isolated whole EDL muscle from an alpha-actinin-3 knockout mouse. Am J Physiol Cell Physiol. 2008;295:C897–C904. doi: 10.1152/ajpcell.00179.2008. [DOI] [PubMed] [Google Scholar]
- Personius KE. Grip force, EDL contractile properties, and voluntary wheel running after postdevelopmental myostatin depletion in mice. J Appl. 2010. Forthcoming. [DOI] [PMC free article] [PubMed]
- Donovan J, Brown P. Euthanasia. Curr Protoc Immunol. 2006;Chap 1 doi: 10.1002/0471142735.im0108s73. [DOI] [PubMed] [Google Scholar]
- Beekley MD, Wetzel P, Kubis P, Gros G. Contractile properties of skeletal muscle fibre bundles from mice deficient in carbonic anhydrase II. Pflugers Arch. 2006;452:453–463. doi: 10.1007/s00424-006-0048-7. [DOI] [PubMed] [Google Scholar]