Abstract
External beam radiotherapy (EBRT) has become the preferred options for non-surgical treatment of prostate cancer and cervix cancer. In order to deliver higher doses to cancerous regions within these pelvic structures (i.e. prostate or cervix) while maintaining or lowering the doses to surrounding non-cancerous regions, it is critical to account for setup variation, organ motion, anatomical changes due to treatment and intra-fraction motion. In previous work, manual segmentation of the soft tissues is performed and then images are registered based on the manual segmentation. In this paper, we present an integrated automatic approach to multiple organ segmentation and nonrigid constrained registration, which can achieve these two aims simultaneously. The segmentation and registration steps are both formulated using a Bayesian framework, and they constrain each other using an iterative conditional model strategy. We also propose a new strategy to assess cumulative actual dose for this novel integrated algorithm, in order to both determine whether the intended treatment is being delivered and, potentially, whether or not a plan should be adjusted for future treatment fractions. Quantitative results show that the automatic segmentation produced results that have an accuracy comparable to manual segmentation, while the registration part significantly outperforms both rigid and non-rigid registration. Clinical application and evaluation of dose delivery show the superiority of proposed method to the procedure currently used in clinical practice, i.e. manual segmentation followed by rigid registration.
Keywords: Image segmentation, Non-rigid registration, Image guided radiotherapy, Prostate cancer, Cervical cancer, Dose delivery
1. Introduction
Each year in the United States about 217,000 men are diagnosed with prostate cancer (American Cancer Society, Atlanta, GA (2010b)), and about 12,200 women are diagnosed with invasive cervical cancer (American Cancer Society, Atlanta, GA (2010a)). The traditional treatment for these carcinomas has been by surgery or external beam radiation therapy(EBRT), however, when the disease is on an advanced stage, EBRT is the primary modality of treatment. Radiotherapy is feasible, effective, and is used to treat over 80% of such patients (Potosky et al. (2000); Nag et al. (2002)).
Recent advances in prostate EBRT have led to three-dimensional conformal radiotherapy (3DCRT) and intensity modulated radiotherapy(IMRT). Prostate 3DCRT requires a precise delineation of the target volume and the adjacent critical organs in order to deliver an optimal dose to the prostate with minimal side effect on nearby normal tissues. The latest advancement of Image-guided radiotherapy (IGRT) integrates an in-room cone-beam CT (CBCT) with radio-therapy linear accelerators for treatment day imaging. With both imaging and radiotherapy available on the same platform, daily CBCTs can now be acquired and used by the radiotherapist to rigidly adjust the position of the patient to best align the patient to the position used during planning. Treatment-day images allow changes in tumor position, size, and shape that take place over the course of radiotherapy to be measured and accounted for in order to boost geometric accuracy and precision of radiation delivery. Fig. 1 presents an example of the same slice acquired using two different CT modalities, fan-beam CT on the left and cone-beam CT on the right. The anatomical structures in the fan-beam CT are sharp and clearly delineated, where as the same anatomical structures in the cone-beam CT are not as distinguishable as a result of poor contrast and blurring due to X-ray scatter (Letourneau et al. (2005); Siewerdsen and Jaffray (2001)).
Figure 1.
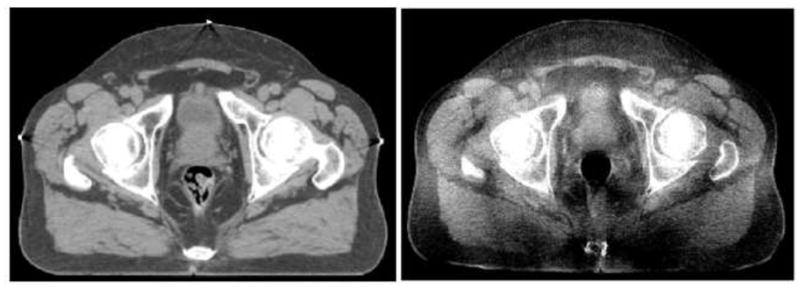
An example of the same CT slice acquired using fan-beam CT (left) and cone-beam CT (right).
For cervical cancer, T2-weighted MR provides superior visualization and differentiation of normal soft tissue and tumor-infiltrated soft tissue (van de Bunt et al. (2006)). In addition, advanced MR imaging with modalities such as diffusion, perfusion and spectroscopic imaging has the potential to better localize and understand the disease and its response to treatment. MR integrated with the radiotherapy system while not currently available is now on the horizon (Kirkby et al. (2008)). In the work by our collaborators (Jaffray et al. (2010)) for cervical cancer, magnetic resonance guided radiation therapy (MRgRT) systems with integrated MR imaging in the treatment room are now being developed as an advanced system in radiation therapy (Jaffray et al. (2010)).
However, when higher doses are to be delivered, precise and accurate targeting is essential because of unpredictable inter- and intra-fractional organ motion over the process of the daily treatments that often last more than one month. Patient setup errors, internal organ and tumor motions must be taken into account in the treatment plan before dose-escalation trials are implemented. Therefore, a non-rigid registration problem must be solved in order to map the planning setup information into each treatment day image (Dawson and Sharpe (2006)). Meanwhile, accurate segmentation of the soft tissue structure over the course of EBRT is essential but challenging due to structure adjacency and deformation over treatment. CBCT image quality makes these goals more challenging. Increased precision and accuracy are expected to augment tumor control, reduce incidence and severity of unintentional toxicity, and facilitate development of more efficient treatment methods than currently available (Dawson and Sharpe (2006)).
Very little work has been done to develop an on-line method to non-rigidly update dose plans. Foskey et al. (2005) developed a non-rigid registration (NRR) technique which first shrinks bowel gas prior to registration, allowing for a dif-feomorphism between the domain of the two images. Here, the authors used the resulting non-rigid transformation to segment the organs from the treatment-day CT, in order to determine the dosimetric effect of a given plan in the presence of non-rigid tissue motion, not to update the dose plan to account for such motion. Greene et al. (2009) performed manual segmentation and then performed a softly-constrained registration based on the organ mapping. Lu et al. (2010b) proposed a similar registration algorithm using the method of Lagrange multipliers to incorporate hard constraints. Some initial work has been performed in simultaneously integrating registration and segmentation. Chelikani et al. (2006) integrated rigid 2D portal to 3D CT registration and pixel classification in an entropy-based formulation. Yezzi et al. (2003) integrated segmentation using level sets with rigid and affine registration. A similar method is proposed by Song et al. (2006), which could only correct rigid rotation and translation motion. Chen et al. (2004) incorporated a Markov Random Field model into the framework which could improve the segmentation performance. Unal and Slabaugh (2005) proposed a PDE-based method without shape priors. Pohl et al. (2005) performed voxel-wise classification and registration which could align an atlas to MRI. Chen et al. (2009) used a 3D meshless segmentation framework to retrieve clinically critical objects in CT and CBCT data , but no registration result was given.
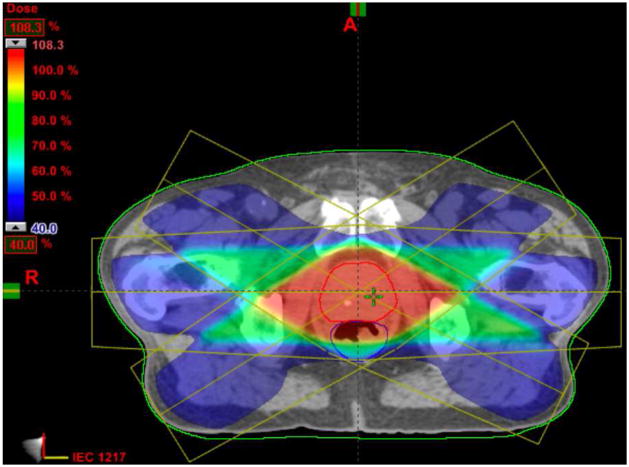
Fig. 2 shows an example of a 3DCRT dose plan created for a patient undergoing EBRT for prostate cancer at Yale-New Haven Hospital. The dose plan is overlaid on the planning-day CT image, with the prostate outlined in red and the rectum outlined in blue. EBRT evaluation can be performed by overlaying the planned dose distribution profiles on the acquired reference image data using a treatment planning platform. This analysis typically includes the calculation of dose-volume histograms, which plot the percentage of a previously-segmented volume in the image data receiving a certain dose from the treatment beams. One could define dose-guided radiotherapy (Chen et al. (2006)) as an extension of adaptive radiotherapy where dosimetric considerations are the basis for decisions about whether future treatment fractions should be reoptimized, readjusted or re-planned to compensate for dosimetric errors.
Figure 2.
An example of a 3DCRT dose plan created for a patient undergoing EBRT for prostate cancer with the prostate outlined in red and the rectum in blue.The dose plan was created using the Varian Eclipse Treatment Planning System (Varian Medical Systems, Palo Alto, CA. (2010)).
In this paper, we present an integrated constrained nonrigid registration and automatic segmentation algorithm designed to meet the demands of IGRT. Our model is based on a Maximum A Posterior (MAP) framework while the automatic segmentation part extends a previous level set deformable model with shape prior information, and the constrained nonrigid registration part is based on a multi-resolution cubic B-spline Free Form Deformation (FFD) transformation to capture the internal organ deformation. These two issues are intimately related: by combining segmentation and registration, we can recover the treatment fraction image region that corresponds to the organs of interest by incorporating transformed planning day image to guide and constrain the segmentation process; and conversely, accurate knowledge of important soft tissue structures will enable us to achieve more precise nonrigid registration which allows the clinician to set tighter planning margins around the target volume in the treatment plan.
This paper is an extended version of our previous conference paper (Lu et al. (2010a)). This paper presents the application to CBCT based prostate cancer radiotherapy as well as MR based cervical cancer treatment. Furthermore, in Section 3.4.1, we propose a new strategy to assess cumulative actual dose for this novel integrated algorithm. Escalated dosages can then be administered while maintaining or lowering normal tissue irradiation, compared to the procedure currently used in clinical practice (Ghilezan et al. (2004)), i.e. manual segmentation followed by rigid registration.
2. Description of the Model
The integrated segmentation/registration algorithm was developed using Bayesian analysis to calculate the most likely segmentation in treatment day fractions Sd and the mapping field between the planning day data and treatment day data T0d. This algorithm requires: (1) a planning day 3DCT/MR image I0, (2) a treatment day 3DCBCT/MR image Id, and (3) the segmented planning day organs S0, (i.e. prostate, bladder, rectum or bladder, uterus).
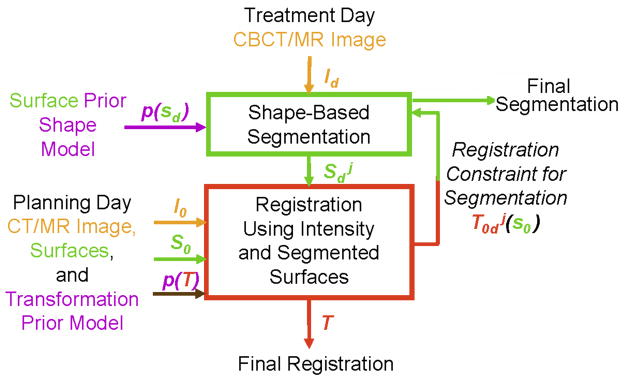
Fig. 3 illustrates the workflow of the image-guided integrated algorithm. First, a pre-procedural (planning day) pelvic CT/MR image is captured before the treatment. Then, the prostate, bladder, rectum/bladder, uterus and bones can be segmented for therapy planning. During the treatment prodedure, the weekly intra-procedural CBCT/MR image is first obtained, and our proposed method is then performed. These 3D registration and segmentation precedures can be performed iteratively, and the algorithm converges when the difference between two consequent iterations is smaller than a prescribed threshold.
Figure 3.
Flowchart of the integrated segmentation and registration algorithm
2.1. MAP Framework
The appearance of an object is always dependent on the gray level variation in an image. Segmentation can be made easier if suitable models containing such relationship priors and likelihoods are available. Meanwhile, registration can be achieved more precisely by incorporating both intensity matching and segmented organ matching constraints. A probabilistic formulation is a powerful approach to realize these two aims. Deformable models can be fit to the image data by finding the model shape parameters that maximize the posterior probability. Follow a Bayesian line of thinking, assuming Sd is independent from I0, S0, we have:
| (1) |
This multiparameter MAP estimation problem in general is difficult to solve, however, we reformulate this problem such that it can be solved in two basic iterative computational stages using an iterative conditional mode (ICM) strategy (Besag (1986)). This reformulation then reduces to a framework where we simultaneously maximize over a range of possible segmentations (using a trial registration to pass initialization information) in one stage, and perform a nonrigid registration in a second stage (using a fixed segmentation in the reference image and the current segmentation estimate in the second image as key constraints). With k indexing each iterative step, we have:
| (2) |
| (3) |
These two equations represent the key problems we are addressing: i.) in Equation 2, the estimation of the segmentation of the important day d structure ( ) and ii.) in Equation 3, the estimation at the next iterative step of the mapping between the day 0 and day d spaces (Lu et al. (2010a)).
2.2. Segmentation Module
We first apply Bayes rule to Eq.(2) to get:
| (4) |
The three terms in (4) corresponds to the first, second and third term in Eq.(1), which are described in details as follows.
2.2.1. Prior Model
Here we assume that the priors are stationary over the iterations, so we can drop the k index for that term only, i.e. . Instead of using a point model to represent the object as was done in (Cootes et al. (1999)), we choose level sets (Osher and Sethian (1988)) as the representation of the object to build a model for the shape prior (Yang and Duncan (2004)), and then define the joint probability density function in Eq.(4).
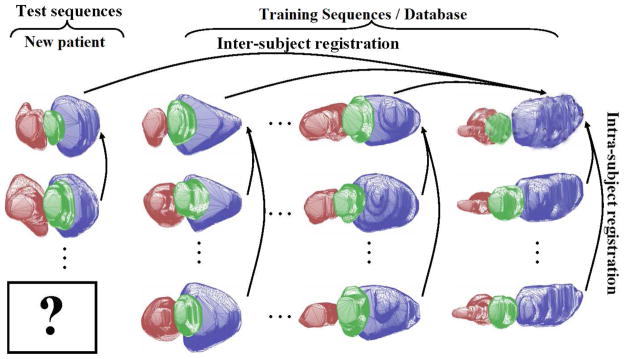
Statistical models for images based on a sample or database can be powerful tools to directly capture the variability for structures being modeled. It is our goal to construct a model based on a database of dynamic pelvic structures from radiotherapy subjects that will provide us with a dynamic shape model (characterized by a probability density function, pdf) for use in integrated segmentation/registration and dose evaluation. First, we assemble a training database of images over many or all treatment fractions from a collection of subjects intended to represent a range of patients. For all images and all fractions, the images are carefully manually segmented by a medical physicist. The segmented structures are then assembled and rigidly aligned. This becomes the statistical shape database to be used for all further analysis, as shown in Figure 4.
Figure 4.
Training database and global shape alignment.
Consider a database of N subjects, each with a sequence of F = dmax temporal frames (or fractions), with each fraction consisting of a set S of several segmented object surfaces: S1, S2, etc. In the current project, the 3D segmentations (S) of the bladder, prostate, rectum or bladder, uterus are determined from a sequence of images (F) acquired on each treatment day for N patients, as shown in Figure 4. In the prostate case, we have N = 4 patients and F = 8 temporal fractions per patient, we develop the initial prostate radiotherapy object database using 24 aligned images from 3 patients, and the fourth patient is used to test our method. Similarly, the initial cervix radiotherapy object database is also constructed using 24 aligned images (4 patients and 6 fractions each). The shape prior p(Sd) is constructed using the database, so our approach is a non-patient-specific statistical model, i.e. the general database is assembled offline once and is stored; it does not change for each new test patient/subject. In future clinical practice, users of our approach could use a database that we have assembled or could create their own local database.
Consider a training set of n aligned images, with M objects or structures in each image. Each object in the training set is embedded as the zero level set of a higher dimensional level set Ψ . Our goal is to build the shape model over these distributions of the level set functions. Using the technique developed by Leventon et al. (2000), the mean and variance of the boundary of each object can be computed using principal component analysis (PCA). The mean level set, is subtracted from each Ψ to create the deviation from the mean. Each such deviation is placed as a column vector in a Nd×n-dimensional matrix Q where d is the number of spatial dimensions and Nd is the number of samples of each level set function. Using Singular Value Decomposition (SVD), Q = UΣV T. U is a matrix whose column vectors represent the set of orthogonal modes of shape variation and Σ is a diagonal matrix of corresponding singular values. An estimate of the object shape Ψi can be represented by k principal components and a k-dimensional vector of coefficients (where k < n) αi
| (5) |
where Uk is a Nd × k matrix consisting of the first k columns of matrix U.
Under the assumption of a Gaussian distribution of object represented by αi, we can compute the probability of a certain shape
| (6) |
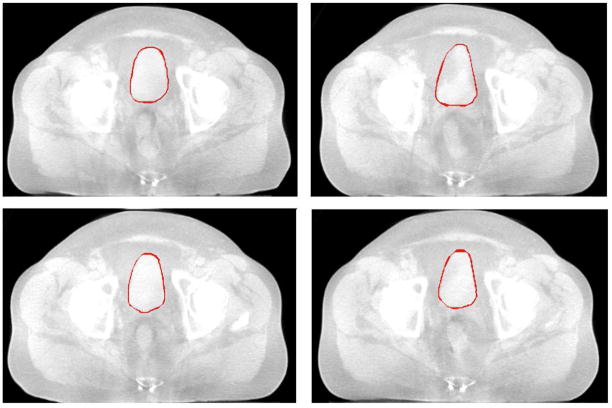
The use of principal component analysis to model level set based shape distributions has some limitations, but researchers have found the PCA representation to work fairly well in practical applications (Tsai et al. (2003); Yang and Duncan (2004); Cremers et al. (2007); Heimann and Meinzer (2009)). Fig. 5 shows a training set of bladder in 4 CBCT pelvic images. By using PCA, we can build a model of the shape profile of the bladder, prostate, rectum, respectively.
Figure 5.
Training set: outlines of bladder in 4 3DCBCT pelvic images. Axial view.
Fig. 6 illustrates the zero level sets corresponding to the mean and three primary modes of variance of the distribution of the level set of bladder.
Figure 6.
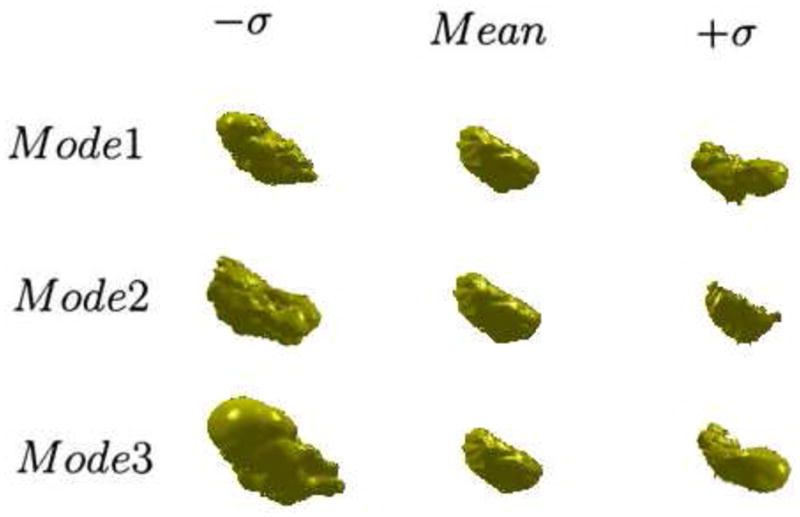
The three primary modes of variance of the 3D bladder, showing the mean, ±SD(σ).
In our deformable model, we also add some regularizing terms (Yang and Duncan (2004)): a general boundary smoothness prior, pB(Sd) = e−μi∮Sids, and a prior for the size of the region, , where Ai is the size of the region of shape i, c is a constant and μi and νi are scalar factors. Here we assume the boundary smoothness and the region size of all the objects are independent. Thus, the prior probability p(Sd) in Eq.(4) can be approximated by a product of the following probabilities:
| (7) |
2.2.2. Segmentation Likelihood Model
Here we have imposed a key assumption (Lu et al. (2010a)): the likelihood term is separable into two independent data-related likelihoods, requiring that the estimate of the structure at day d be close to: i.) the same structure segmented at day 0, but mapped to a new estimated position at day d by the current iterative mapping estimate and ii.) the intensity-based feature information derived from the day d image.
In Equation (4), is the Day 0 segmentation likelihood term, which constrains the organ segmentation in day d to be adherent to the transformed day 0 organs by current mapping estimate . The segmented object is still embedded as the zero level set of a higher dimensional level set Ψ . Thus, we made the assumption about the probability density of day 0 segmentation likelihood term:
| (8) |
where Z is a normalizing constant that can be removed once the logarithm is taken.
In equation (4), is the intensity – based image feature likelihood, which indicates the probability of producing an image Id given . In three-dimensions, assuming gray level homogeneity within each object, we use the imaging model defined by Chan and Vese (2001) in Eq.(9), where c1 and σ1 are the average and standard deviation of Id inside , c2 and σ2 are the average and standard deviation of Id outside .
| (9) |
In practice, gas bubbles are a significant content of the rectum. In our work, the clinicians use a clinical protocol to eliminate the bowel gas prior to the imaging. Furthermore, the image quality of CBCT makes this assumption also applicable to the rectal tissue.
2.2.3. Energy Function of the Segmentation Module
Combining(4),(7),(8),(9), we introduce the segmentation energy function Eseg defined by
| (10) |
Notice that the MAP estimation of the objects in Eq.(4), , is also the minimizer of the above energy functional Eseg. This minimization problem can be formulated and solved using the level set surface evolving method, which is described in Section 2.4.1.
2.3. Registration Module
The goal here is to register the planning day (0) data to the treatment day (d) data and carry the planning information forward, as well as to carry forward segmentation constraints. To do this, the second stage of the ICM strategy described above in equation (3) can be further developed using Bayes rule as follows:
| (11) |
The first two terms on the right hand side of this expression represent conditional likelihoods related to first registering the three segmented soft tissue structures at days 0 and d, and second registering the intensities of the image between days 0 and d. The third term represents prior assumptions on the overall nonrigid mapping, which is captured with smoothness model and is assumed to be stationary over the iterations. Each of the three logarithm components in the above equation will be further simplified into computational equivalents as follows.
2.3.1. Segmented Organ Matching
To begin breaking down the organ matching term, , it must be assumed that the different organs can be registered respectively, which is reasonable.
| (12) |
with M represents the number of objects in each image.
As described in the segmentation section, each object is represented by the zero level set of a higher dimensional level set Ψ . Assuming the objects vary during the treatment process according to a Gaussian distribution, further simplifies the problem as follows:
| (13) |
where ωobj are used to weight different organs, and . Therefore, choosing a specific ωobj also means choosing a σobj. When minimized, the organ matching term ensures the transformed day 0 organs and the segmented day d organs align over the regions.
2.3.2. Image Intensity Matching
To determine the relationship between a planning day image and a treatment day image, a similarity criterion which determines the amount of overlap between the two images must be defined. For prostate cancer, given that we are trying to perform an inter-modality registration between CT and CBCT, we can not use a direct comparison of image intensities, i.e., sum of squared differences, as a similarity measure. Although the image intensities for both imaging modalities are in CT numbers, their intensities differ by a linear transformation and Gaussian noise due to X-ray scatter during CBCT acquisition. An alternative voxel-based similarity measure is normalized cross-correlation (NCC) which has been shown to accurately and robustly align inter-modality images (Hill et al. (2001); Holden et al. (2000)). Since NCC has successfully been tested in prostate IGRT (Greene et al. (2009); Lu et al. (2010a)),it is used to address such intensity matching objective in this paper. Furthermore, NCC has been recommended over Mutual Information (MI) for registering CT to CBCT because it is computationally more efficient (Thilmann et al. (2006)).
| (14) |
where Ī0 and Īd are the mean intensities. Similarly, and σId represent the standard deviation of the image intensities.
For the cervical cancer, since we are registering MR to MR in the problem, sum of squared differences, which directly compares image intensities, is used. Different from the prostate problem which only use a single NCC similarity metric, we take into consideration the intensity matching both inside and outside the organs, because complex and large deformations are often seen in the uterus.
| (15) |
When minimized, this term ensures the intensities of two images match within all the organs and outside.
2.3.3. Transformation Smoothing Prior
To constrain a transformation to be smooth, a penalty term which regularizes the transformation is introduced. The penalty term will disfavor impossible or unlikely transformation, promoting a smooth transformation field and local volume conservation. In 3D, the penalty term is written as
| (16) |
where V denotes the volume of the image domain. This regularization measure is based on the 2D bending energy of a thin-plate of metal. The regularization term is zero for any affine transformations and, therefore, penalizes only non-affine transformations (Rueckert et al. (1999b)). In addition, we enforce a hard constraint to each control point of the tensor B-Spline FFD to move within a local sphere of radius r < R where R ≈ 0.4033 of the control point spacing. This condition guarantees T0d to be locally injective (Choi and Lee (1999); Greene et al. (2009); Lu et al. (2010b)).
2.3.4. Transformation Model
The registration module is implemented using a hierarchical multi-resolution FFD transformation model based on cubic B-splines. A FFD based transform was chosen because a FFD is locally controllable due to the underlying mesh of control points which are used to manipulate the image (Rogers (2001)). B-splines are locally controlled, which makes them computationally efficient, even for a large number of control points. Local control means that cubic B-splines have limited support, such that changing one control point only affects the transformation in the local neighborhood of the manipulated control point (Rueckert et al. (1999a); Rogers (2001); Greene et al. (2009); Lu et al. (2010a)).
The degree of non-rigid motion captured depends on the spacing of the control points in the mesh Ω. In order to create an algorithm with an adequate degree of non-rigid deformation, a hierarchical multi-resolution approach is implemented in which the control point resolution is increased in a coarse to fine fashion at each iteration, as was done in the previous work in our laboratory (Greene et al. (2009, 2008); Lu et al. (2010a,b)).
2.3.5. Energy Function of Registration Module
Combining the above equations, we introduce the registration energy function Ereg defined by the following Eq.(17). Notice that the MAP estimation of the mapping, , is also the minimizer of the following energy functional Ereg.
| (17) |
where can be replaced by Eq.(14) or Eq.(15) accordingly. In this expression, a new transformation field is estimated at the next iteration (k + 1) based on current estimates of the object segmentations and their object-by-object mappings, overall intensity matching of the day 0 and day d images and a local transformation smoothing term, with the tensor B-Spline FFD parameterization.
2.4. Implementation
The practical implementation of the algorithm described by the solution of equations (2) and (3) using the ICM strategy will proceed as follows. i.)Initialization. First, an expert manually segmented the key soft tissue structures (S0) in the planning 3DCT/MR data, i.e. the prostate, bladder, rectum or the bladder, uterus. Then, the first iterative estimate (k = 1) of a nonrigid mapping from day 0 to day d ( ) will be formed. This is done by performing a conventional nonrigid registration, which is similar to Eq. (17) without the soft tissue structure constraints. ii.) Iterative Solution. Here we alternately perform: (a)Segmentation: Using the current transformation estimated, the soft tissue segmentations obtained at day 0 will be mapped into day d , thus forming . Now using this information as a constraint, as well as the likelihood information and shape prior model defined in Section 2.2, the segmentation module of ICM strategy (Eq. 10) is run, producing the soft tissue segmentations at day d ( ). (b)Registration: A full 3D nonrigid mapping of the 3DCT/MR data from day 0 to the day d 3DCBCT/MR data will be estimated in the second stage of ICM strategy using Eq. (17), producing a newer mapping estimation ( ). The two steps run alternatively until convergence. Finally, when the convergence is achieved, we run the Eq.(17) again but switching the reference space and transform space, in order to get a backward transformation, i.e. mapping from the treatment day d to planning day 0. Thereafter, the soft tissue segmentation in day d as well as the bi-directional transformations (forward: from day 0 to day d, backward: from day d to day 0) are estimated simultaneously.
2.4.1. Level Set Formulation and Evolving the Surface
Here, we describe the optimization of the segmentation module energy functional Eseg in Eq.(10) using level sets. In the level set method, Si is the zero level set of a higher dimensional level set function Ψ i corresponding to the ith object being segmented, i.e., Si = {(x, y, z)| Ψi (x, y, z) = 0}. The evolution of the surface Si is given by the zero-level surface at time t of the function Ψi (t, x, y, z). We define Ψi to be positive outside Si and negative inside Si.
For the level set formulation of our model, we replace Si with Ψi n the energy functional in Eq.(10) using regularized versions of the Heaviside function H and the Dirac function δ, denoted by Hε and δε(Chan and Vese (2001))(described below).
| (18) |
where Ω denotes the image domain. In this paper, we define Ωi to be the domain where the level set distance is no more than 10 voxels considering that the size of objects of interest in our data is less than 40–50 voxels. Let G(·) be an operator to generate the vector representation (as in Eq.(5)) of a matrix by column scanning, and let g(·) be the inverse operator of G(·). To compute the associated Euler-Lagrange equation for each unknown level set function we keep c1 and c2 fixed, and minimize Eseg with respect to . Parametrizing the descent direction by artificial time t ≥ 0, the evolution equations in are:
| (19) |
In practice, the Heaviside function Hε and Dirac function δε are slightly smoothed, and c1, c2 are approximated as follows (Chan and Vese (2001)):
| (20) |
We use the regularized functions with ε = 1.5, for all the experiments in this paper. The approximation of Eq.(19) by the above difference scheme can be simply written as:
| (21) |
where is the approximation of the right hand side in Eq.(19) by the above spatial difference scheme. The difference equation (21) can be expressed as the following iteration, and the level sets are updated after each iteration.
| (22) |
In implementing the proposed level set surface evolving, thanks to the strong constraint from the transformed organs, the time step τcan be chosen significantly larger than the time step used in the traditional level set methods. We have tried a large range of the time step τin our experiments, from 0.1 to 30.0. A natural question is: what is the range of the time step τfor which the iteration (22) is stable? From our experiments, we have found that the time step τand the coefficient γ, which weights the constraint from the transformed organs, must satisfy τ·γ< 1/2 in the difference scheme described above, in order to maintain stable level set evolution. Using a larger time step can speed up the evolution, but may cause error in the boundary location if the time step is chosen too large. There is a tradeoff between choosing larger time step and accuracy in boundary location. Usually, we use t ≤ 10 for most images.
To simplify the complexity of the segmentation system, we generally choose the parameters in Eq.(18) as follows: λ1 = λ2 = λ, μ = 0.1, ω = 0.25, and ν = 0 (Chan and Vese (2001); Yang and Duncan (2004)). This leaves us only two free parameters (λ and γ) to balance the influence of two terms, the image data term and the constraints term from registration module. The tradeoff between these two terms depends on the strength of the constraints and the image quality for a given application. We set these parameters empirically for particular application.
In the registration system, ωobj are used to weight the tradeoff between transformed organs. We will discuss the choice of Ωobj in the following section 3.3.
3. Prostate Cancer Application: CBCT results
3.1. Data and Training
We tested our ICM algorithm on 32 kilovolt-CBCT treatment-day images acquired from four different patients undergoing prostate IGRT at Yale-New Haven Hospital. Each patient data set consisted of a planning-day CT, eight weekly treatment-day CBCTs, and a planning-day IMRT dose plan. Please refer to Fig.2 for an example of a planning-day IMRT dose plan.
The planning-day and treatment-day images as well as the treatment plans were down-sampled from 1.25mm × 1.25mm × 2.0mm and 2.0mm × 2.0mm × 5.0mm, respectively, to a clinically applicable spatial resolution of 4.0mm × 4.0mm × 4.0mm using BioImage Suite (Papademetris et al. (2008)).
The training data were obtained from manual segmentation by a qualified clinician. There are 8 treatment fractions and 1 planning fraction for each patient. A ”leave-one-out” strategy was used. One patient was chosen to test the algorithm, and the other 3 patients (24 images overall) were used as training sequences. All the tested images were not in their training sets.
3.2. Segmentation Results
The 3D surfaces of the segmented prostate (red), bladder (blue), rectum (green) using the proposed algorithm are presented in Fig.7. In Fig.8(a), we show the sagittal view of the segmentation using only gray level information, by which the surfaces cannot lock onto the shapes of the objects, since these structures have very poorly defined boundaries in CBCT images. Fig.8(b) shows the results using image gray level information as well as the shape prior (active shape model). The results are better, but the boundaries of the organs overlap a lot where the structures are connected. This is because the three structures are handled independently in the active shape model here, without the constraints from the transformed planning day organs. In Fig.8(c), we show results of using our proposed model. Visually, the three structures can be clearly segmented. The surfaces are able to converge on the desired boundaries even though some parts of the boundaries are too blurred to be detected using only gray level information. In practice, we use Eq.(13) to guarantee the adjacent objects disconnect with each other, therefore, there is no overlap between the boundaries due to the constraints from transformed planning day organs. Fig.8(d) shows the clinician’s manual segmentation for comparison.
Figure 7.
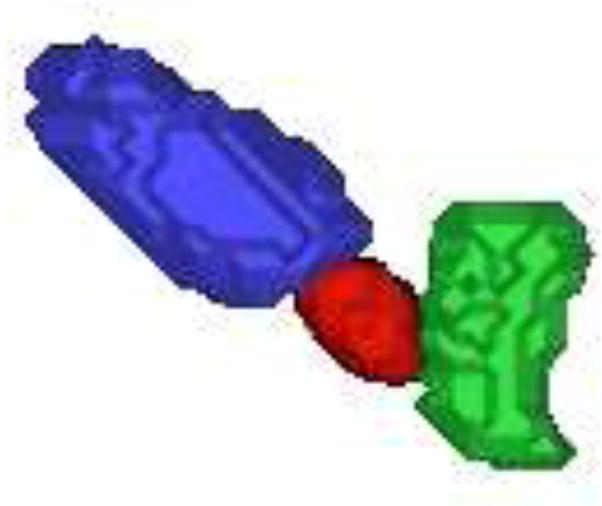
An example of automatically extracted 3D prostate(red), bladder (blue) and rectum (green) surfaces.
Figure 8.
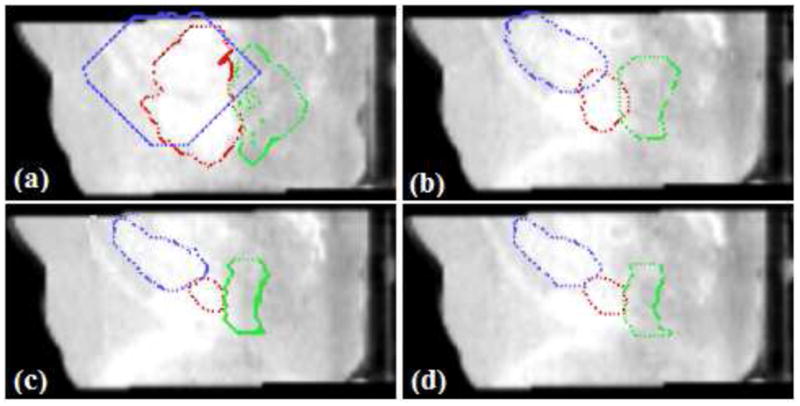
Evaluation of segmentation performance. Red:prostate, Blue:bladder, Green: rectum. (a)Segmentation using gray level information; (b)With Shape prior; (c)Proposed ICM algorithm(λ = 0.25, γ = 0.75); (d)Manual segmentation.
After the rigid alignment, the initial seeds are placed at the center of organs. In Fig.9, we show initial seeds as well as the segmentation results after 10, 20, and 30 iterations. The algorithm typically converges in 25–30 iterations, and it usually takes a couple of hours on a 2.83-GHz Intel XEON CPU using MATLAB.
Figure 9.
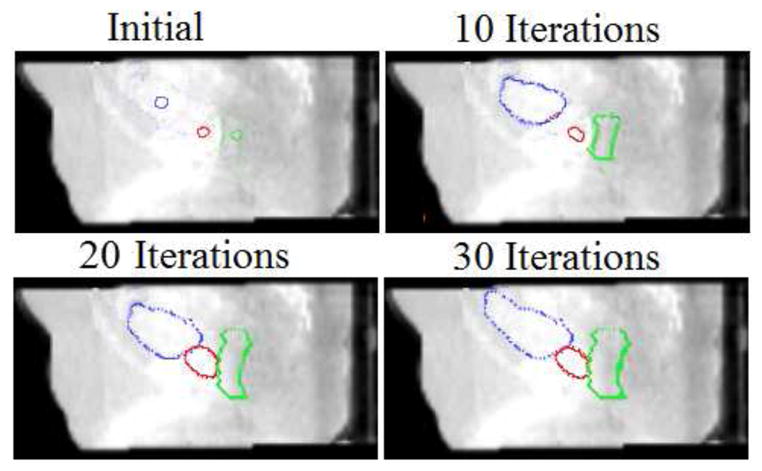
Detection of three pelvic structures in a CBCT image. Segmentation results after each iteration are shown. (λ = 0.25, γ = 0.75)
To validate the segmentation results, we compare the manual results (which are used as ground truth) to the automatic results using two distance error metrics, namely mean absolute distance (MAD) and Hausdorff distance (HD). Percentage of true positives (PTP) which evaluate the volume overlaps are also calculated. Let A = {a1, a2, ..., an}, B = {b1, b2, ..., bm}, ai, bi representing the boundary of the surfaces, we define:
where d(ai, B) = minj ||bj − ai||. While MAD represents the global disagreement between two contours, HD compares their local similarities.
Let ΩA and ΩB be two regions enclosed by the surfaces A and B respectively, PTP is defined as follows:
We test our model on all the 32 treatment day images respectively, and the results (mean and standard deviation) are summerized in Table 1. Virtually all the boundary points lie within one or two voxels of the manual segmentation when using our method. Quantitative validation in Table 1 shows consistent agreement between the proposed method and manual segmentation by expert.
Table 1.
Evaluation of the Segmentation Module
| Method | MAD(mm) | HD(mm) | PTP(%) | |
|---|---|---|---|---|
| Prostate | Without prior | 12.76 ± 4.33 | 15.42 ± 4.56 | 47.92 ± 8.15 |
| With shape prior | 8.02 ± 2.43 | 8.73 ± 2.90 | 60.13 ± 5.53 | |
| Proposed method | 1.96 ± 0.48 | 2.83 ± 0.76 | 85.32 ± 2.83 | |
|
| ||||
| Bladder | Without prior | 18.54 ± 5.39 | 20.13 ± 6.16 | 38.25 ± 10.28 |
| With shape prior | 11.69 ± 4.72 | 13.18 ± 5.31 | 65.20 ± 4.01 | |
| Proposed method | 2.96 ± 0.81 | 4.31 ± 1.24 | 90.33 ± 3.28 | |
|
| ||||
| Rectum | Without prior | 18.21 ± 4.81 | 19.87 ± 5.30 | 32.43 ± 8.92 |
| With shape prior | 9.91 ± 4.04 | 12.25 ± 5.36 | 54.71 ± 9.43 | |
| Proposed method | 2.85 ± 0.47 | 3.69 ± 1.20 | 84.72 ± 2.83 | |
3.3. Registration Results
The registration performance of the proposed algorithm is also evaluated. For comparison, a conventional non-rigid registration (NRR) using only intensity matching and rigid registration (RR) are performed on the same set of real patient data. Organ overlaps between the ground truth in day d and the transformed organs from day 0 are used as metrics to assess the quality of the registration (Table 2). In the experiments here, we choose ωprostate = 0.5, ωbladder = ωrectum = 0.3.
Table 2.
Evaluation of the Registration: Organ Overlap/PTP (%)
| Rigid Registration | Nonrigid Registration | Proposed Method | |
|---|---|---|---|
| Prostate | 45.32 ± 2.45 | 77.58 ± 4.14 | 87.24 ± 1.90 |
| Bladder | 61.85 ± 3.73 | 73.23 ± 8.28 | 91.38 ± 2.42 |
| Rectum | 41.96 ± 4.16 | 64.27 ± 6.32 | 86.41 ± 3.04 |
We also track the registration error percentage between the ground truth in day d and the transformed organs from day 0, as shown in Table 3. The registration error is represented as percentage of false positives (PFP), which calculates the percentage of a non-match being declared to be a match (Zhu et al. (2010)). Let ΩA and ΩB be two regions enclosed by the surfaces A and B respectively, PFP is defined as follows:
Table 3.
Evaluation of Registration Error: PFP (%)
| Rigid Registration | Nonrigid Registration | Proposed Method | |
|---|---|---|---|
| Prostate | 54.27 ± 3.18 | 24.56 ± 4.32 | 13.35 ± 1.96 |
| Bladder | 40.94 ± 4.07 | 28.85 ± 7.63 | 9.71 ± 2.81 |
| Rectum | 61.33 ± 5.83 | 35.76 ± 7.78 | 15.82 ± 4.03 |
Here, we define A is the ground truth at day d, and B is the transformed organ from day 0.
From the Table 2 and Table 3, we found that the RR performed the poorest out of all the registrations algorithms, generating an identity transform for all sets of patient data, while the proposed method significantly outperformed the NRR at aligning segmented organs. Ideally, the last columns of Table 1 and Table 2 should equal to the other, since T0d(S0) = Sd theoretically. When comparing Table 1 and Table 2, we find that the results of Table 2 are slightly better, but the difference is non-significant(less than 2%).
From our prior experience with radiotherapy research (Greene et al. (2009); Lu et al. (2010a,b)), the best organ registration results occur when the organ is used as the only constraint or one of the main constraints. In our work, the segmented prostate, bladder, rectum are all used as constraints. On average, the prostate overlap increases from 45.32% to 87.24%. The volume of the bladder varies from day to day and from time to time, however, the shape remains similar and the bladder is an easily segmented structure. Both of these situations lead to excellent registration results for the bladder. The bladder overlap increases from 61.85% to 91.38% after applying our method. The rectum is an odd shape which varies everyday because gas bubbles are a significant content of the rectum. In practice, our clinicians used a protocol to eliminate the bowel gas prior to the imaging, which contributes to the accurate segmentation and registration using our model. The rectum overlap goes from 41.96% to 86.41% after applying proposed method.
We also perform a sensitivity analysis on the weights of the transformed organs (i.e. ωobj). Previous research result shows that the best prostate registration results occurs when prostate is used as the strongest constraints (Greene et al. (2009); Lu et al. (2010b)), and since the prostate is the key organ for EBRT treatment, so ωprostate is weighted more than ωbladder and ωrectum. We test the influence of the variation of ωobj on the registration performance, the choices of ωobj are lists in Table 4, and the registration results are shown in Fig.10. From Table 4 and Fig.10, we can see the large variation of ωobj changes registration results (organ overlaps) by no more than 8%. Thus, our method is not sensitive to the balance of the weights. In the application of prostate cancer, Test 4 is the scenario we use.
Table 4.
Sensitivity analysis of different ωobj.
| Registration test | ωprostate: ωbladder: ωrectum |
|---|---|
| Test 1 | 0.5:0.5:0.5 |
| Test 2 | 0.5:0.5:0.3 |
| Test 3 | 0.5:0.5:0.1 |
| Test 4 | 0.5:0.3:0.3 |
| Test 5 | 0.5:0.3:0.1 |
| Test 6 | 0.5:0.1:0.3 |
| Test 7 | 0.5:0.1:0.1 |
Figure 10.
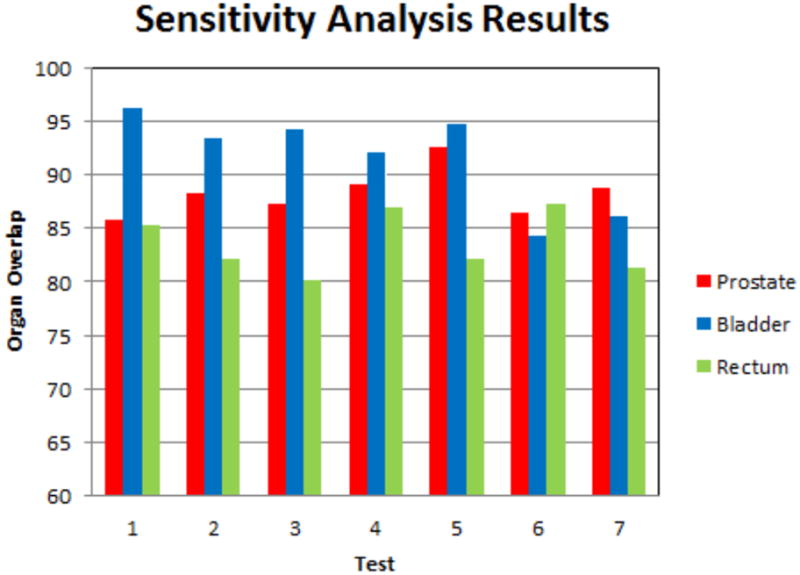
Sensitivity analysis of different ωobj. The bars plot organ overlaps for the tests listed in Table 4
3.4. Evaluation of Dose in the Presence of Organ Deformation
3.4.1. Quantification
We desire to use our strategy for assessing cumulative dose delivery in EBRT treatment of prostate cancer. Our integrated multi-object segmentation/nonrigid registration algorithm can be used to map from a fixed dose plan and the anatomy at each treatment day back to a reference planning day image in order to compute the dose delivered to each voxel of tissue (or organ) by properly integrating the warped dose over treatment fractions.
For this work, we performed the following operations, which were used to obtain the cumulative dose result from actual image data. First, an IMRT treatment plan with dose distribution is developed in the planning space ( day 0). Then, at each treatment day, the original dose plan is rigidly translated (as would be done clinically, described in Ghilezan et al. (2004)) to re-center it on the centroid of the CTV using a centering transformation R0d. Thus, the delivered dose plan at day d: is generated. In order to compute the dose delivered to each location at day d in the planning day coordinates , we need to use the determinant of the Jacobian of the transformation |J(T0d)| to properly account for the volumetric change:
| (23) |
where the first term represents the mapping of the dose plan ”back” to reference space using the transformation T0d, and the second term is the determinant of the Jacobian of the transformation T0d which accounts for the dilution or concentration of the dose in the event that one voxel expands to cover more than one voxel or vice-versa. (Note that |R0d| = 1.) Finally, we obtain a cumulative dose distribution over all available treatment days d = d1, ..., dmax by nonrigidly mapping each treatment day to the planning day using the mappings T0d estimated our by integrated segmentation/registration algorithm described above, and then summing over all treatment days:
| (24) |
where J = the Jacobian of T0d. This actual delivered dose can now be compared to the planned dose in the planning day coordinate system.
3.4.2. Dose Results
We have applied the strategy outlined in Section 3.4.1 for developing cumulative dose distributions in the planning day space based on our integrated segmentation/registration algorithm described in Section 2.
Fig.11 shows a 2D slice through 3D cumulative dose distribution when typical treatment dose plans (12 mm margin) were mapped and summed across 8 weekly treatment fractions from a single patient. While it is apparent that the prostate is receiving nearly 90% of the dose, it can be seen that the bladder and the rectum are also receiving substantial amounts. The excess doses received by the bladder and rectum are a consequence of the large margins (12 mm) that are prescribed around the CTV to generate the Planning Target Volume (PTV).
Figure 11.
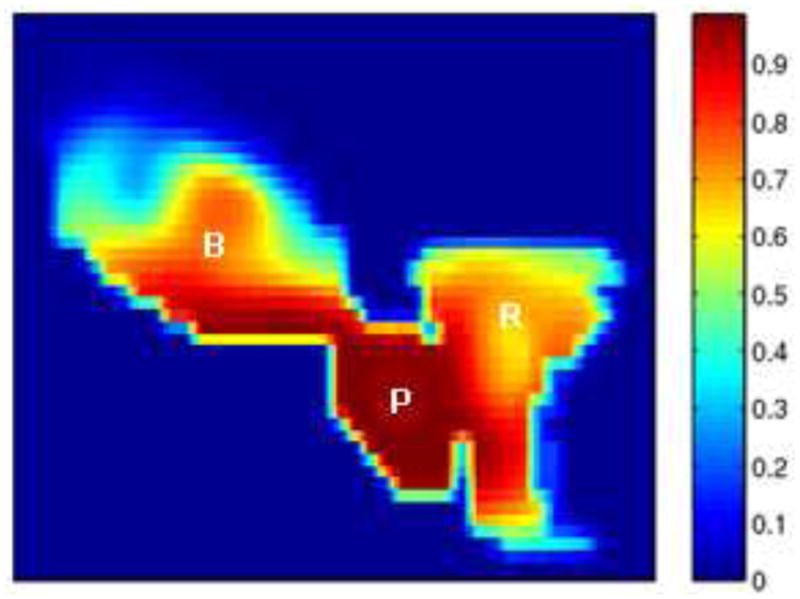
Cumulative dose distributions for typical treatment plans: 12 mm margin.
Since our method can achieve a more accurate segmentation and registration, it enables the clinician to set a tighter margin (4 mm) prescribed around the Clinical Tumor Volume (CTV), to ensure accurate delivery of the planned dose to the prostate (still around 90 %) and to minimize the dose received by the rectum and bladder, as shown in Fig.12.
Figure 12.
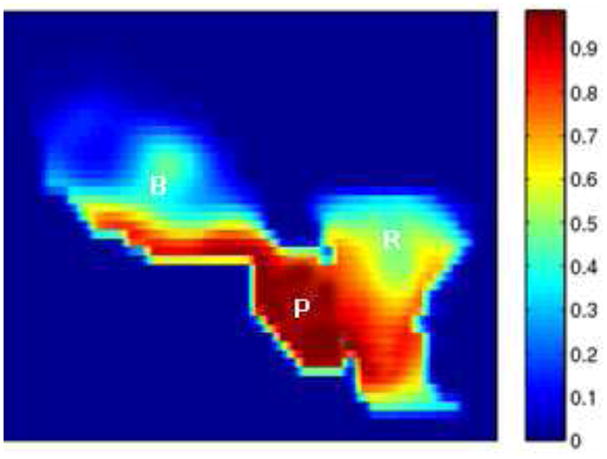
Cumulative dose distributions for plans with tighter margin (4 mm).
4. Cervical Cancer Application: MR-Guided Radiotherapy
4.1. Data and Training
We tested our proposed method on 30 sets of MR data acquired from five different patients undergoing EBRT for cervical cancer at Princess Margret Hospital, Toronto, Canada. Each of the patients had six weekly 3D MR images. A GE EXCITE 1.5-T magnet with a torso coil over the pelvis was used in all cases. T2-weighted, fast spin echo images (echo time/repetition time 100/5,000 ms, voxel size 0.36mm × 0.36mm × 5mm, and image dimension 512 × 512 × 38) were acquired. The clinician performed the bias field correction so that the intensities can be directly compared, and the MR images were resliced to be isotropic. Similar to the work of prostate cancer treatment, we also adopted a ”leave-one-out” test that alternately chose one patient out of the 30 sequences to validate our algorithm. All the tested images were not in their training sets.
4.2. Segmentation Results
In this section, we show the experimental results from our algorithm and compare them with those obtained from the segmentation using traditional level set deformable model (active shape model as in Leventon et al. (2000)). Fig.13 shows an example of MR data set with automatically extracted 3D bladder (red) and uterus (yellow) surfaces using the proposed method.
Figure 13.
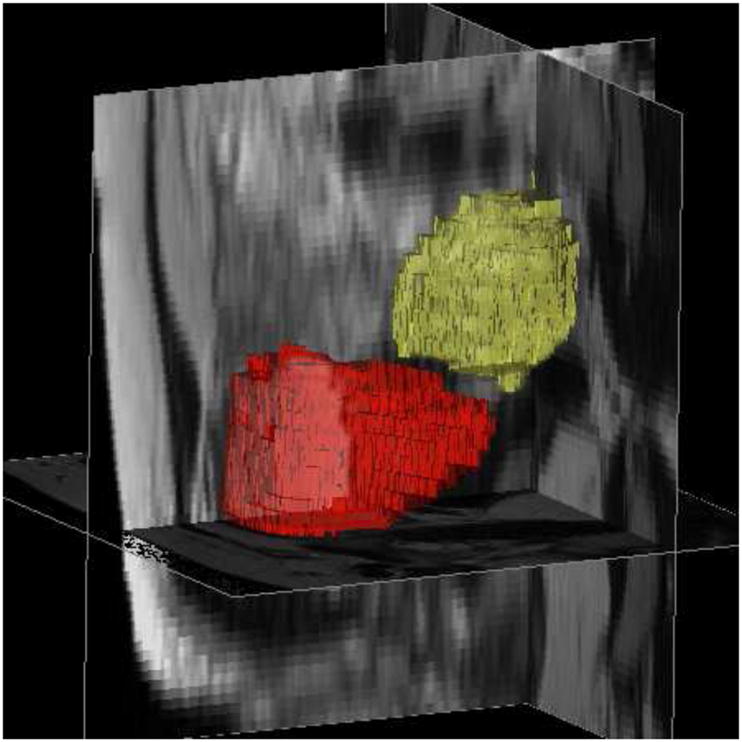
An example of MR data set with automatically extracted bladder (red) and uterus (yellow) surfaces. λ = γ = 0.5.
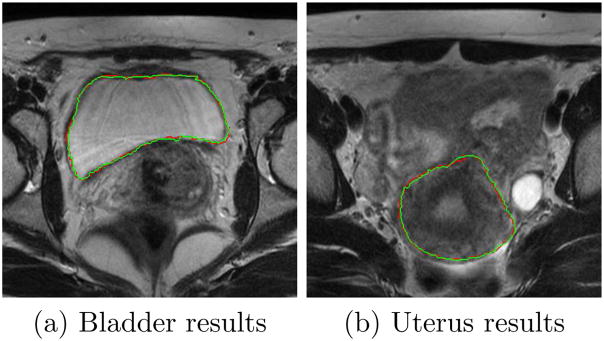
Fig.14 shows the axial view of segmented bladder and uterus surfaces overlaid on MR data in one treatment day, with comparison to manual contours.
Figure 14.
Comparing segmentation results using the proposed algorithm (green) and manual segmentation (red).λ = γ = 0.5.
Table 5 and 6 use MAD, HD and PTP to quantitatively analyze the segmentation results on bladder and uterus surfaces respectively. MAD, HD and PTP are defined in Section 3.2. From the tables, we observe that both MAD and HD decrease with the proposed method while PTP increasing, which implies that our method has a remarkable and consistent agreement with the manual segmentation.
Table 5.
Evaluation of Segmentation of Bladder
| MAD(mm) | HD(mm) | PTP (%) | |
|---|---|---|---|
| Without prior | 7.61 ± 2.69 | 8.63 ± 3.18 | 43.18 ± 7.92 |
| With shape prior | 3.91 ± 1.73 | 4.54 ± 2.04 | 72.47 ± 4.91 |
| Proposed method | 1.06 ± 0.12 | 1.29 ± 0.33 | 86.53 ± 2.18 |
Table 6.
Evaluation of Segmentation of Uterus
| MAD(mm) | HD(mm) | PTP(%) | |
|---|---|---|---|
| Without prior | 10.57 ± 6.19 | 12.13 ± 5.88 | 35.33 ± 8.19 |
| With shape prior | 6.93 ± 1.40 | 7.52 ± 1.25 | 71.02 ± 6.88 |
| Proposed method | 1.28 ± 0.26 | 2.01 ± 0.53 | 84.16 ± 2.39 |
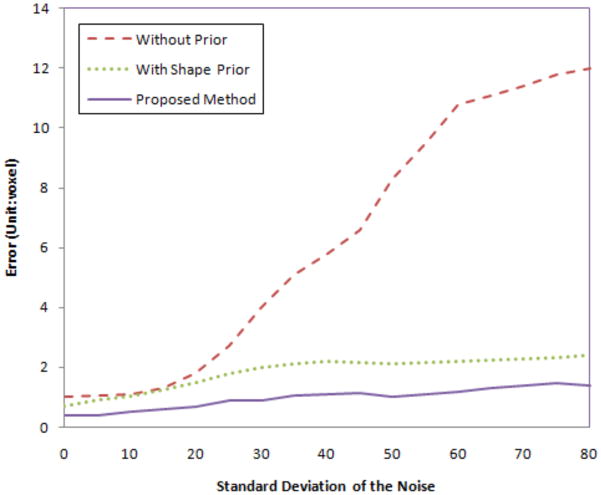
We also test the robustness of our algorithm to noise. We add Gaussian noise with different variances to the MR image, then perform the proposed algorithms. Fig.15 shows the segmentation errors of the uterus in three cases: with no prior, with shape prior only, and using our proposed method. As the variance of the noise increases, the error (calculated as Hausdorff distance) for no prior increases rapidly since the structure is too noisy to be detected using only gray level information. However, for shape prior method and out proposed method, the errors are much lower and are locked in a very small range even when the variance of the noise is large. Note that our integrated segmentation/registration model achieves the least error among all the cases.
Figure 15.
Segmentation errors (unit: voxel) with different variance of Gaussian noise for the MR images.
4.3. Registration Results
The mapping performance of the proposed algorithm was also evaluated. For comparison, a conventional non-rigid registration (NRR) using only intensity matching (described in Rueckert et al. (1999a)) and rigid registration (RR) were performed on the same sets of real patient data. The registration results using different transformation models and the corresponding difference images of the deformed uterus are shown in Fig.16. The check box of the registered MR image is presented in Fig.17.
Figure 16.
Example of different transformations on the registration for one patient. (a) Difference image of uterus after rigid registration. (b) After nonrigid registration. (c) After the proposed method.
Figure 17.
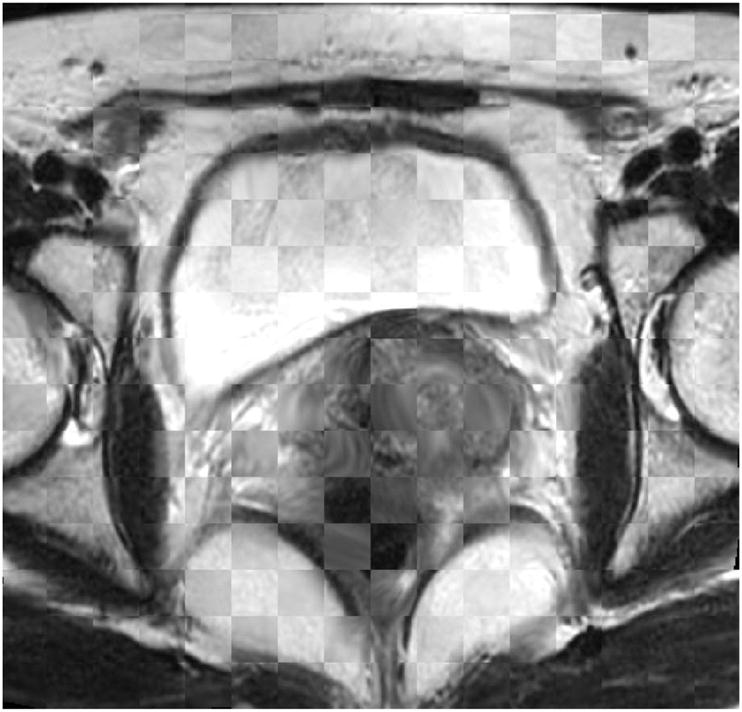
Registration result: Checkbox of the deformed MR image.
Organ overlaps between the ground truth in day d and the transformed organs from day 0 were used as metrics to assess the quality of the registration (Table 7). The registration error percentage represented as percentage of false positives (PFP) is also tracked in Table 8. Here, we choose ωbladder = 0.5, ωuterus = 0.3.
Table 7.
Evaluation of Registration: Organ Overlaps/PTP (%)
| Bladder | Uterus | |
|---|---|---|
| Rigid Registration | 65.76 ± 6.69 | 68.32 ± 5.18 |
| Nonrigid Registration | 80.34 ± 2.39 | 77.28 ± 3.84 |
| Proposed Method | 91.33 ± 1.69 | 87.64 ± 2.50 |
Table 8.
Evaluation of Registration Error: PFP (%)
| Bladder | Uterus | |
|---|---|---|
| Rigid Registration | 33.57 ± 5.34 | 30.92 ± 5.22 |
| Nonrigid Registration | 19.21 ± 3.41 | 21.78 ± 4.03 |
| Proposed Method | 9.36 ± 1.32 | 11.63 ± 1.80 |
The registration results presented in Table 7 and Table 8 are tested across five patient data sets for a total of 30 different treatment-days. As before, the segmented bladder and uterus are used as constraints to guide the registration module, both organs significantly increase overlap and decrease matching error when compared to RR and NRR results (p < 0.001, paired t-test). The average bladder overlap increases from 65.76% to 91.33%, and average uterus overlap increases from 68.32% to 87.64%.
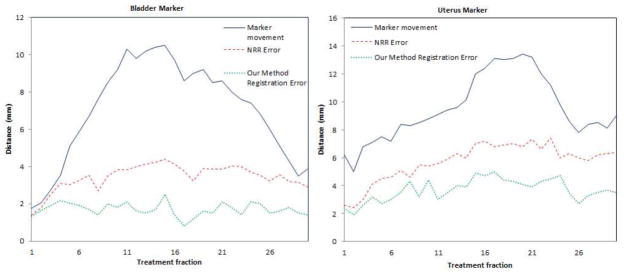
Furthermore, we perform 30 experiments on the same set of data with interactively selected landmarks to validate the accuracy of 3D registration. The markers are for validation purposes only and are not used for registration constraint. Fig.18 shows the algorithm’s registration errors of the markers on the bladder corner, and uterus corner respectively. From the error distributions, we can see that, in most cases, the registration error in 3D is around 2mm, which is much lower than the marker movement and the registration error of NRR.
Figure 18.
Quantitative validation of 3D registration module using the proposed method: Registration errors of the markers.
The bladder and uterus are adjacent to the tumor(Gross Tumor Volume, GTV), therefore, the accurate registration of these organs would help aligning the tumor/GTV (Lu et al. (2010b)). Fig. 19 shows a representative slice from the planning day MRI with overlaid five treatment day tumor/GTV deformed contours. It can be seen that the tumor appears in the same slice and the same location in the registered serial treatment images, though tumor regression process is clearly visible from the contours. Using this technique, we can easily calculate the location changes of the GTV for diagnosis and assessment, and also precisely guide the interventional devices toward the tumor during image-guided therapy.
Figure 19.
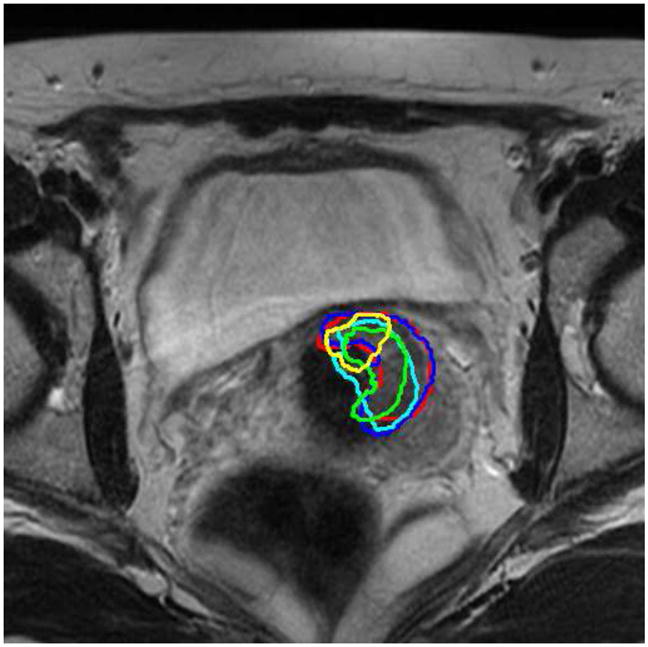
Tumor/GTV contours from 5 treatment imaging days (shown in 5 colors on a representative slice) mapped to the planning-day MRI.
5. Conclusion and Discussion
Our proposed integration algorithm allows accurate segmentation and registration by iteratively running the two stages of ICM model. We define a MAP estimation framework combining both the level set based deformable segmentation model as well as the constrained nonrigid registration. By combining segmentation and registration, we can recover the treatment fraction image region that corresponds to the organs of interest by incorporating transformed planning day image to guide and constrain the segmentation process; and conversely, accurate knowledge of important soft tissue structures will enable us to achieve more precise nonrigid registration. Testing of our approach on both prostate cancer treatment CT-CBCT data and cervical cancer treatment MR data shows that our new method produces results that have an accuracy comparable to that obtained by manual segmentation. For each patient data tested, the proposed method proves to be highly robust and significantly improves the overlap for each soft tissue compared to traditional rigid and multiresolution non-rigid alignment.
A key goal of image-guided adaptive radiotherapy is to more fully characterize the dose delivered to the patient and each region of interest. In this paper, we also propose a new strategy to assess cumulative actual dose for this novel integrated algorithm. Clinical application and evaluation of dose delivery show that the proposed method allows the clinician to set tighter PTV margin, which proves the superiority of this method to the procedure currently used in clinical practice (Ghilezan et al. (2004)), i.e. manual segmentation followed by rigid registration.
Dose-guided radiotherapy (Chen et al. (2006)) can be defined as an extension of adaptive radiotherapy where dosimetric considerations are the basis for decisions about whether future treatment fractions should be re-optimized, readjusted or re-planned to compensate for dosimetric errors.
As shown in Fig.20, in a prostate EBRT application, we can calculate the cumulative dose delivery after dK fractions using Eq.(24) defined in Section 3.4.1, and then compare the actual partially delivered dose with the intended dosage. In this way, we may increase the future dosage for compensation if the actual delivered dose is lower than intended, or vice versa, as described in Eq. (25).
Figure 20.
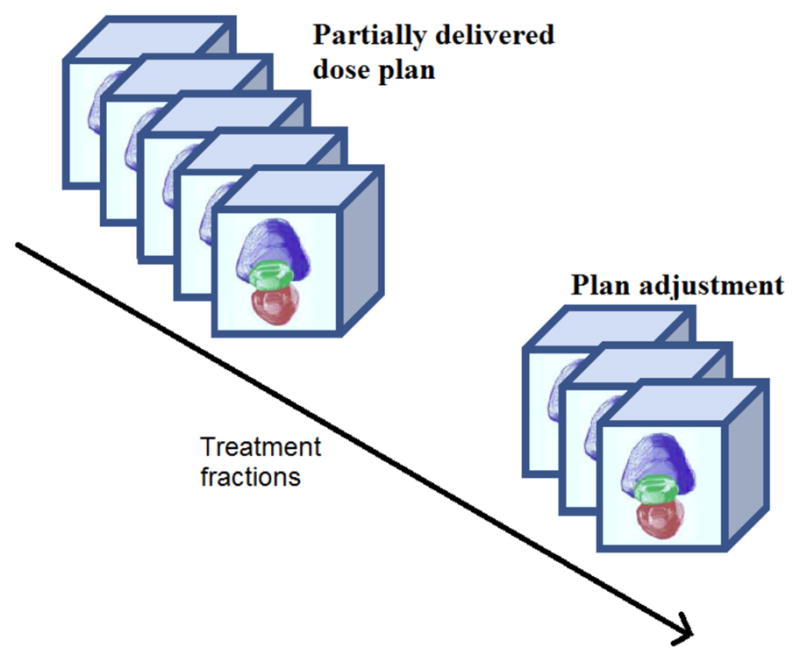
Dose adjustment or re-planning.
| (25) |
Using the techniques described in this paper, it is possible to easily calculate the location changes of the key organs for diagnosis and assessment, and also precisely guide the interventional devices toward the tumor during image-guided therapy. In addition, this complete, automatically-generated estimated cumulative dose distribution can be utilized to make decisions about changing margins based on the difference between the computed and desired treatment. We can potentially adjust the plan to better conform to the dose already delivered and match the predicted variability in the pelvic anatomy for future fractions.
Acknowledgments
This work is supported by NIH/NIBIB Grant R01EB002164. We would like to thank the anonymous reviewers for their valuable remarks which benefit the revision of this paper.
Footnotes
Publisher's Disclaimer: This is a PDF file of an unedited manuscript that has been accepted for publication. As a service to our customers we are providing this early version of the manuscript. The manuscript will undergo copyediting, typesetting, and review of the resulting proof before it is published in its final citable form. Please note that during the production process errors may be discovered which could affect the content, and all legal disclaimers that apply to the journal pertain.
References
- How many women get cancer of the cervix? American Cancer Society; Atlanta, GA: 2010a. http://www.cancer.org/Cancer/CervicalCancer/DetailedGuide/cervical-cancer-key-statistics/ [Google Scholar]
- What are the key statistics about prostate cancer? American Cancer Society; Atlanta, GA: 2010b. http://www.cancer.org/Cancer/ProstateCancer/DetailedGuide/prostate-cancer-key-statistics/ [Google Scholar]
- Besag J. On the statistical analysis of dirty pictures. Journal of the Royal Statistical Society Series B (Methodological) 1986;48 (3):259–302. [Google Scholar]
- Chan T, Vese L. Active contours without edges. IEEE Transactions on Image Processing. 2001 feb;10 (2):266–277. doi: 10.1109/83.902291. [DOI] [PubMed] [Google Scholar]
- Chelikani S, Purushothaman K, Knisely J, Chen Z, Nath R, Bansal R, Duncan J. A gradient feature weighted minimax algorithm for registration of multiple portal images to 3DCT volumes in prostate radiotherapy. Int J Radiation Oncology Biol Phys. 2006;65 (2):535–547. doi: 10.1016/j.ijrobp.2005.12.032. [DOI] [PMC free article] [PubMed] [Google Scholar]
- Chen J, Morin O, Aubin M, Bucci MK, Chuang CF, Pouliot J. Dose guided radiation therapy with megavoltage cone-beam CT. British Journal Of Radiology. 2006;79:S87–S98. doi: 10.1259/bjr/60612178. [DOI] [PubMed] [Google Scholar]
- Chen T, Kim S, Zhou J, Metaxas D, Rajagopal G, Yue N. 3d meshless prostate segmentation and registration in image guided radiotherapy. In: Yang G-Z, Hawkes D, Rueckert D, Noble A, Taylor C, editors. Medical Image Computing and Computer-Assisted Intervention (MICCAI 2009). Vol. 5761 of Lecture Notes in Computer Science. Springer: Berlin /Heidelberg; 2009. pp. 43–50. [DOI] [PubMed] [Google Scholar]
- Chen X, Brady M, Rueckert D. Simultaneous segmentation and registration for medical image. In: Barillot C, Haynor D, Hellier P, editors. Medical Image Computing and Computer-Assisted Intervention (MICCAI 2004). Vol. 3216 of Lecture Notes in Computer Science. Springer; Berlin /Heidelberg: 2004. pp. 663–670. [Google Scholar]
- Choi Y, Lee S. Local injectivity conditions of 2D and 3D uniform cubic B-spline functions. Proc. of Pacific Graphics; 1999. pp. 302–311. [Google Scholar]
- Cootes T, Beeston C, Edwards G, Taylor C. A unified framework for atlas matching using active appearance models. In: Kuba A, Saamal M, Todd-Pokropek A, editors. Information Processing in Medical Imaging (IPMI 1999). Vol. 1613 of Lecture Notes in Computer Science. Springer; Berlin /Heidelberg: 1999. pp. 322–333. [Google Scholar]
- Cremers D, Rousson M, Deriche R. A review of statistical approaches to level set segmentation: Integrating color, texture, motion and shape. International Journal of Computer Vision. 2007;72:195–215. [Google Scholar]
- Dawson LA, Sharpe MB. Image-guided radiotherapy: rationale, benefits, and limitations. Lancet Oncol. 2006;7:848–858. doi: 10.1016/S1470-2045(06)70904-4. [DOI] [PubMed] [Google Scholar]
- Foskey M, Davis B, Goyal L, Chang S, Chaney E, Strehl N, Tomei S, Rosenman J, Joshi S. Large deformation three-dimensional image registration in image-guided radiation therapy. Phys Med Biol. 2005;50:5869–5892. doi: 10.1088/0031-9155/50/24/008. [DOI] [PubMed] [Google Scholar]
- Ghilezan M, Yan D, Liang J, Jaffray D, Wong J, Martinez A. Online image-guided intensity-modulated radiotherapy for prostate cancer: How much improvement can we expect? A theoretical assessment of clinical benefits and potential dose escalation by improving precision and accuracy of radiation delivery. Int J Radiation Oncology Biol Phys. 2004;60 (5):1602–1610. doi: 10.1016/j.ijrobp.2004.07.709. [DOI] [PubMed] [Google Scholar]
- Greene WH, Chelikani S, Purushothaman K, Chen Z, Knisely J, Staib LH, Papademetris X, Duncan JS. A constrained non-rigid registration algorithm for use in prostate image-guided radiotherapy. In: Metaxas D, Axel L, Fichtinger G, Szekely G, editors. Medical Image Computing and Computer-Assisted Intervention (MICCAI 2008). Vol. 5241 of Lecture Notes in Computer Science. Springer; Berlin /Heidelberg: 2008. pp. 780–788. [DOI] [PMC free article] [PubMed] [Google Scholar]
- Greene WH, Chelikani S, Purushothaman K, Knisely J, Chen Z, Papademetris X, Staib LH, Duncan JS. Constrained non-rigid registration for use in image-guided adaptive radiotherapy. Medical Image Analysis. 2009;13 (5):809–817. doi: 10.1016/j.media.2009.07.004. [DOI] [PMC free article] [PubMed] [Google Scholar]
- Heimann T, Meinzer HP. Statistical shape models for 3D medical image segmentation: A review. Medical Image Analysis. 2009;13 (4):543–563. doi: 10.1016/j.media.2009.05.004. [DOI] [PubMed] [Google Scholar]
- Hill DLG, Batchelor PG, Holden M, Hawkes DJ. Topical review: Medical image registration. Phys Med Biol. 2001;46:R1–R45. doi: 10.1088/0031-9155/46/3/201. [DOI] [PubMed] [Google Scholar]
- Holden M, Hill DLG, Denton ERE, Jarosz JM, Cox TCS, Rohlfing T, Goodey J, Hawkes DJ. Voxel similarity measures for 3-D serial MR brain image registration. IEEE Transaction on Medical Imaging. 2000 February;19 (2):94–102. doi: 10.1109/42.836369. [DOI] [PubMed] [Google Scholar]
- Jaffray DA, Carlone M, Menard C, Breen S. Image-guided radiation therapy: Emergence of MR-guided radiation treatment (MRgRT) systems. Medical Imaging 2010: Physics of Medical Imaging. 2010;7622:1–12. [Google Scholar]
- Kirkby C, Stanescu K, Rathee S, Carlone M, Murray B, Fallone BG. Patient dosimetry for hybrid mri-radiotherapy systems. Medical Physics. 2008;35(1019) doi: 10.1118/1.2839104. [DOI] [PubMed] [Google Scholar]
- Letourneau D, Wong JW, Oldham M, Gulam M, Watt L, Jaffray DA, Siewerdsen JH, Martinez AA. Cone-beam-CT guided radiation therapy: technical implementation. Radiother Oncol. 2005;75:279–286. doi: 10.1016/j.radonc.2005.03.001. [DOI] [PubMed] [Google Scholar]
- Leventon ME, Grimson W, Faugeras O. Statistical shape influence in geodesic active contours. Computer Vision and Pattern Recognition (CVPR 2000), IEEE Conference; 2000. pp. 316–323. [Google Scholar]
- Lu C, Chelikani S, Chen Z, Papademetris X, Staib LH, Duncan JS. Integrated segmentation and nonrigid registration for application in prostate image-guided radiotherapy. In: Jiang T, Navab N, Pluim J, Viergever M, editors. Medical Image Computing and Computer-Assisted Intervention (MICCAI 2010). Vol. 6361 of Lecture Notes in Computer Science. Springer; Berlin /Heidelberg: 2010a. pp. 53–60. [DOI] [PubMed] [Google Scholar]
- Lu C, Chelikani S, Papademetris X, Staib L, Duncan J. Constrained non-rigid registration using Lagrange multipliers for application in prostate radiotherapy. Computer Vision and Pattern Recognition Workshops (CVPRW 2010), IEEE Computer Society Conference; Jun, 2010b. pp. 133–138. [Google Scholar]
- Nag S, Chao C, Martinez A, Thomadsen B. The american brachytherapy society recommendations for low-dose-rate brachytherapy for carcinoma of the cervix. Int J Radiation Oncology Biology Physics. 2002;52 (1):33–48. doi: 10.1016/s0360-3016(01)01755-2. [DOI] [PubMed] [Google Scholar]
- Osher S, Sethian JA. Fronts propagating with curvature-dependent speed: Algorithms based on Hamilton-Jacobi formulations. Journal of Computational Physics. 1988;79 (1):12–49. [Google Scholar]
- Papademetris X, Jackowski M, Rajeevan N, Constable RT, Staib LH. BioImage Suite: An integrated medical image analysis suite. Section of Bioimaging Sciences, Dept. of Diagnostic Radiology, Yale School of Medicine; 2008. http://www.bioimagesuite.org. [PMC free article] [PubMed] [Google Scholar]
- Pohl K, Fisher J, Levitt J, Shenton M, Kikinis R, Grimson W, Wells W. A unifying approach to registration, segmentation, and intensity correction. In: Duncan JS, Gerig G, editors. Medical Image Computing and Computer-Assisted Intervention (MICCAI 2005). Vol. 3749 of Lecture Notes in Computer Science. Springer; Berlin /Heidelberg: 2005. pp. 310–318. [DOI] [PMC free article] [PubMed] [Google Scholar]
- Potosky AL, Legler J, Albertsen PC, Stanford JL, Gilliland FD, Hamilton AS, Eley JW, Stephenson RA, Harlan LC. Health outcomes after prostatectomy or radiotherapy for prostate cancer: Results from the prostate cancer outcomes study. J Nat Cancer Inst. 2000 October;92 (19):1582–1592. doi: 10.1093/jnci/92.19.1582. [DOI] [PubMed] [Google Scholar]
- Rogers D. An Introduction to NURBS: with Historical Perspective. 1. Morgan Kaufmann Publishers; San Francisco: 2001. [Google Scholar]
- Rueckert D, Sonoda L, Denton E, Rankin S, Hayes C, Leach MO, Hill D, Hawkes DJ. Comparison and evaluation of rigid and non-rigid registration of breast MR images. SPIE. 1999a;3661:78–88. doi: 10.1097/00004728-199909000-00031. [DOI] [PubMed] [Google Scholar]
- Rueckert D, Sonoda LI, Hayes C, Hill DLG, Leach MO, Hawkes DJ. Nonrigid registration using free-form deformations: Application to breast MR images. IEEE Transaction on Medical Imaging. 1999b August;18 (8):712–721. doi: 10.1109/42.796284. [DOI] [PubMed] [Google Scholar]
- Siewerdsen JH, Jaffray DA. Cone-beam computed tomography with a flat-panel imager: Magnitude and effects of x-ray scatter. Med Phys. 2001 February;28 (2):220–231. doi: 10.1118/1.1339879. [DOI] [PubMed] [Google Scholar]
- Song T, Lee V, Rusinek H, Wong S, Laine A. Integrated four dimensional registration and segmentation of dynamic renal mr images. In: Larsen R, Nielsen M, Sporring J, editors. Medical Image Computing and Computer-Assisted Intervention (MICCAI 2006). Vol. 4191 of Lecture Notes in Computer Science. Springer; Berlin /Heidelberg: 2006. pp. 758–765. [DOI] [PubMed] [Google Scholar]
- Thilmann C, Nill S, Tucking T, Hoss A, Hesse B, Dietrich L, Bendl R, Rhein B, Haring P, Thieke C, Oelfke U, Debus J, Huber P. Correction of patient positioning errors based on in-line cone beam CTs: clinical implementation and first experiences. Radiat Oncol. 2006 May;1 (16):1–9. doi: 10.1186/1748-717X-1-16. [DOI] [PMC free article] [PubMed] [Google Scholar]
- Tsai A, Yezzi A, Wells W, Tempany C, Tucker D, Fan A, Grimson WE, Willsky A. A shape-based approach to the segmentation of medical imagery using level sets. IEEE Transactions on Medical Imaging. 2003 February;22 (2):137–154. doi: 10.1109/TMI.2002.808355. [DOI] [PubMed] [Google Scholar]
- Unal G, Slabaugh G. Coupled PDEs for non-rigid registration and segmentation; Computer Vision and Pattern Recognition (CVPR 2005), IEEE Computer Society Conference on; june, 2005. pp. 168–175. [Google Scholar]
- van de Bunt L, van der Heide UA, Ketelaars M, de Kort GAP, Jurgenliemk-Schulz IM. Conventional conformal, and intensity-modulated radiation therapy treatment planning of external beam radiotherapy for cervical cancer: The impact of tumor regression. International journal of radiation oncology, biology, physics. 2006;64 (1):189–196. doi: 10.1016/j.ijrobp.2005.04.025. [DOI] [PubMed] [Google Scholar]
- Varian eclipse treatment planning system. Varian Medical Systems; Palo Alto CA: 2010. http://www.varian.com. [Google Scholar]
- Yang J, Duncan JS. 3d image segmentation of deformable objects with joint shape-intensity prior models using level sets. Medical Image Analysis. 2004;8 (3):285–294. doi: 10.1016/j.media.2004.06.008. [DOI] [PMC free article] [PubMed] [Google Scholar]
- Yezzi A, Zollei L, Kapur T. A variational framework for integrating segmentation and registration through active contours. Medical Image Analysis. 2003;7 (2):171–185. doi: 10.1016/s1361-8415(03)00004-5. [DOI] [PubMed] [Google Scholar]
- Zhu Y, Papademetris X, Sinusas AJ, Duncan JS. A coupled deformable model for tracking myocardial borders from real-time echocardiography using an incompressibility constraint. Medical Image Analysis. 2010;14 (3):429–448. doi: 10.1016/j.media.2010.02.005. [DOI] [PMC free article] [PubMed] [Google Scholar]


