Abstract
We have developed a portable library for automated detection of melanoma termed SkinScan© that can be used on smartphones and other handheld devices. Compared to desktop computers, embedded processors have limited processing speed, memory, and power, but they have the advantage of portability and low cost. In this study we explored the feasibility of running a sophisticated application for automated skin cancer detection on an Apple iPhone 4. Our results demonstrate that the proposed library with the advanced image processing and analysis algorithms has excellent performance on handheld and desktop computers. Therefore, deployment of smartphones as screening devices for skin cancer and other skin diseases can have a significant impact on health care delivery in underserved and remote areas.
Keywords: Skin cancer detection, melanoma screening, smartphone, handheld device
1. INTRODUCTION
In recent years, cellular phones have made the transition from simple dedicated telephony devices to being small, portable computers with the capability to perform complex, memory- and processor-intensive operations. These new devices, generally referred to as smartphones, provide the user with a wide array of communication and entertainment options that until recently required many independent devices. Given the recent advances in medical imaging, smartphones can provide an attractive vehicle for delivering image-based diagnostic services at a low cost.
The focus of our research over the last 10 years has been the automated detection of skin cancer via analysis of dermoscopic images. We have previously developed a desktop application [1] that provides end-to-end processing of skin cancer images, including preprocessing, segmentation, feature extraction, analysis, and classification, culminating in the calculation of the probability of the lesion is malignant. The system is built using Matlab (The MathWorks Inc., Natick, MA) and requires a desktop computer to run. With the advent of smartphones, it is now possible to port the application on a portable device.
To that end, we have developed a C/C++ based library that implements the main portions of the desktop application in a form that is suitable for use on a smartphone in quasi-real time. The library is well suited for Apple iOS-based devices (iPhone, iPad, and iPod Touch) as well as Android based devices. However, in this paper we present an iPhone 4 implementation only. In particular, we compare the desktop application against the smartphone implementation in terms of computational speed and demonstrate that the library is light enough to be used on off-the-shelf smart devices.
2. METHODS
We have recently developed an automated procedure for lesion classification [1] based on the well known bag-of-features framework [2]. The main steps in the entire procedure are lesion segmentation, feature extraction, and classification.
2.1. Dataset
The application can process images taken either with the iPhone camera or taken with an external camera and uploaded to the image library on the phone. In this study, we use images from a large library of skin cancer images [3] that were uploaded to the phone. A total of 1300 artifact free images are selected: 388 were classified by histological examination as melanoma and the remaining 912 were classified as benign. All images were segmented manually by one of the authors to provide a ground truth against which the automated techniques employed by our application are compared. Prior to processing, the images are converted from color to 256 level greyscale.
2.2. Image segmentation
In addition to the lesion, images typically include relatively large areas of healthy skin, so it is important to segment the image and extract the lesion to be considered for subsequent analysis. To reduce noise and suppress physical characteristics, such as hair in and around the lesion that affect segmentation adversely, a fast two-dimensional median filtering [4] is applied to the greyscale image. The image is then segmented using three different segmentation algorithms, namely ISODATA (iterative self-organizing data analysis technique algorithm) [5], fuzzy c-means [6] [7], and active contour without edges [8]. The resulting binary image is further processed using morphological operations, such as opening, closing, and connected component labeling [9]. When more than one contiguous region is found, additional processing removes all regions except for the largest one. The end result is a binary mask that is used to separate the lesion from the background.
2.3. Feature extraction
Among the criteria employed by dermatologists to detect melanoma, as described by Menzies rules [10] and the 7-point list [11], texture analysis is of primary importance, since, among other things, malignant lesions exhibit substantially different texture patterns from benign lesions. Elbaum et al. [12] used wavelet coefficients as texture descriptors in their skin cancer screening system MelaFind® and our previous work [1] has demonstrated the effectiveness of wavelet coefficients for melanoma detection. Therefore, our library includes a large module dedicated to texture analysis.
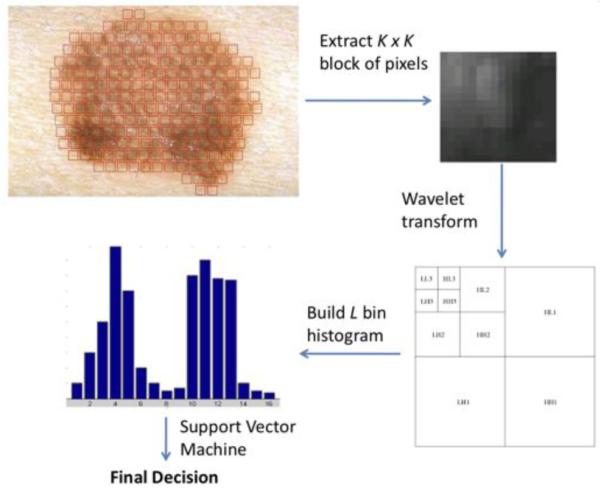
Feature extraction works as follows: for a given image, the binary mask created during segmentation is used to restrict feature extraction to the lesion area only. After placing an orthogonal grid on the lesion, we repeatedly sample patches of size K×K pixels from the lesion, where K is user defined. Large values of K lead to longer algorithm execution time, while very small values result in noisy features. Each extracted patch is decomposed using a 3-level Haar wavelet transform [13] to get 10 sub-band images. We extract texture features by computing statistical measures, like mean and standard deviation, on each sub-band image, which are then are put together to form a vector that describes each patch.
2.4. Image classification
Our classification approach closely follows the one outlined in [2]. A support vector machine (SVM) is trained using a subset (training set) of the total images available, and the resulting classifier is used to determine whether the rest of the images (test set) are malignant or benign.
2.5. Overall procedure
The overall procedure for training and testing of the classifier proceeds as follows:
2.5.1. Training
- For each image in the training set,
- Segment the input image to extract the lesion.
- Select a set of points on the lesion using a rectangular grid of size M pixels.
- Select patches of size K×K pixels centered on the selected points.
- Apply a 3-level Haar wavelet transform on the patches.
- For each sub-band image compute statistical measures, namely mean and standard deviation, to form a feature vector Fi = {m1, sd1, m2, sd2,…}.
For all feature vectors Fi extracted, normalize each dimension to zero mean and unit standard deviation.
Apply the K-means clustering [14] to all feature vectors Fi from all training images to obtain L clusters with centers C = {C1, C2, …,CL}.
For each training image build a L-bin histogram. For feature vector Fi, increment the jth bin of the histogram such that min j ∥Ci – Fi∥.
Use the histograms obtained from all the training images as the input to a SVM classifier to obtain a maximum margin hyperplane that separates the histograms of benign and malignant lesions.
The value of parameter M is a trade-off between accuracy and computation speed. Small values of M lead to more accurate classification results, but computation time increases accordingly. When the algorithm runs on the smartphone device we want to reduce computation time, so we choose M = 10 for grid size, K = 24 for patch size, and L = 200 as the number of clusters in the feature space. By exhaustive parameter exploration in our previous studies [1], we found that these parameters are reasonable settings for the dataset used in this paper. Figure 1 summarizes in graphical form the feature extraction and classification steps of the proposed procedure.
Fig. 1.

Lesion classification: select a patch from the lesion, apply a 3-level Haar wavelet transform, extract texture features, build a histogram using the cluster centers obtained during training, and input histogram to trained SVM classifier to classify the lesion.
2.5.2. Testing
Each test image is classified using the following steps:
Read the test image and perform Steps 1(a)–(e) and 2 in the training algorithm, to obtain a feature vector Fi that describes the lesion.
Build an L-bin histogram for the test image. For all feature vectors Fi extracted from the image, increment the jth bin of the histogram, such that minj ∥Ci – Fi∥, where this time the cluster centers Ci are the centers identified in Step 3 of the training procedure.
Submit the resulting histogram to the trained SVM classifier to classify the lesion.
For test images, likelihood of malignancy can be computed using the distance from the SVM hyperplane. Training of the SVM classifier was performed off-line on a desktop computer, while testing is performed entirely on the smartphone device.
3. RESULTS
3.1. iPhone 4 implementation
The iPhone 4 is a smartphone developed by Apple, Inc., and features an Apple A4 ARM processor running at 1 GHz, 512 MB DDR SDRAM, up to 32 GB of solid state memory, a 5 MPixel builtin camera with LED flash, and 3G/Wi-Fi/Bluetooth communication networks. Thus, it has all the features, computational power, and memory needed to run the complete image acquisition and analysis procedure in quasi real time. There is lot of potential for such a device in medical applications, because of its low cost, portability, ease of use, and ubiquitous connectivity.
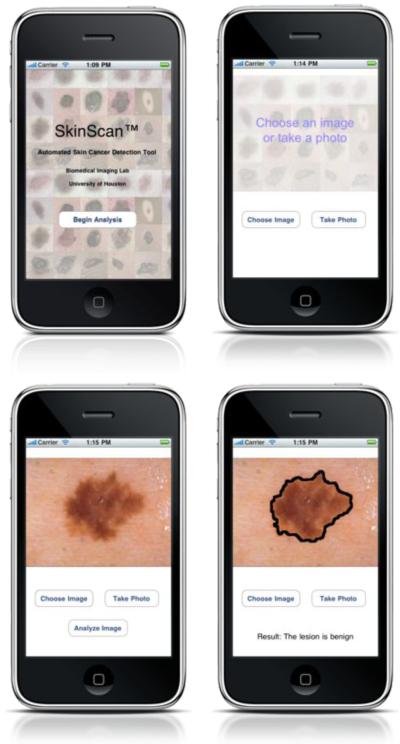
We have developed a menu based application that implements the automated procedure outlined in the previous sections, as shown is Figure 2. The user can take a picture of a lesion or load an existing image from the phone photo library. The image is then analyzed on the phone in quasi real time and the results of classification are displayed on the screen.
Fig. 2.
SkinScan application on Apple iPhone™ device
3.2. Comparison of the three segmentation methods
To assess the performance of the proposed application we compare the automatic segmentation with manual segmentation. For each image we calculate an error defined [15] as the ratio of the non-overlapping area between automatic and manual segmentation divided by the sum of the automatic and manually segmented images. The error ratio is zero when the results from automatic and manual segmentation match exactly, and 100 percent when the two segmentations do not overlap. Thus the error is always between zero and 100 percent, regardless of the size of the lesion. An earlier study found that when the same set of images was manually segmented by more than one expert, the average variability was about 8.5 percent [15]. We used the same figure and included an additional tolerance of 10 percent error to account for the large number of images in our dataset. Therefore, we set the cutoff for error ratio to 18.5 percent, considering that a lesion is correctly segmented by the automated procedure if the error ratio is less than 18.5 percent.
The dataset of 1300 skin lesion images was segmented using the three segmentation techniques mentioned previously. Table 1 shows the number of images correctly segmented, and the mean and standard deviation of error for all images. The active contour method was found to be the most accurate, as it had the highest number of images segmented correctly and least mean error ratio. ISO-DATA and Fuzzy c-Means, in that order, followed the active contour method in accuracy. Figure 3 shows the error distribution of three segmentation methods, where the number of images is plotted against the error ratio. The threshold of 18.5% is marked as the vertical dotted line. Of the 1300 images examined, 754 images had error ratio below 8.5% (variability of error among domain experts), 1147 images had error ratio below 18.5% (threshold for correct segmentation), and 153 images with error ratio above 18.5%. This seemingly high error is due to the fact that manual lesion segmentation yields a smooth boundary, while automatic segmentation detects fine edges on the border.
Table 1.
Performance of the segmentation techniques.
| ISODATA | Fuzzy c-Means | Active Contour | |
|---|---|---|---|
| Images correctly segmented |
883 | 777 | 1147 |
| Images incorrectly segmented |
417 | 523 | 153 |
| Mean error | 19.46% | 20.40% | 9.69% |
| Standard deviation error |
22.41 | 19.80 | 6.99 |
Fig. 3.

Error ratio distribution of three segmentation methods on the dataset of 1300 skin lesion images. The red dotted line marks the threshold for correct segmentation.
3.3. Classification accuracy
We performed 10 trials of 10-fold cross validation on the set of 1300 images. We divided the dataset into 10 folds, nine folds with 39 melanoma and 92 benign lesions and the remaining fold with 37 melanoma and 87 benign lesions. Of the 10 folds, we used nine for training and one for test. We performed 10 rounds of validation where we chose each fold for testing, to get 10×10 = 100 experiments. We averaged over these 100 experiments and found 80.76% sensitivity and 85.57% specificity.
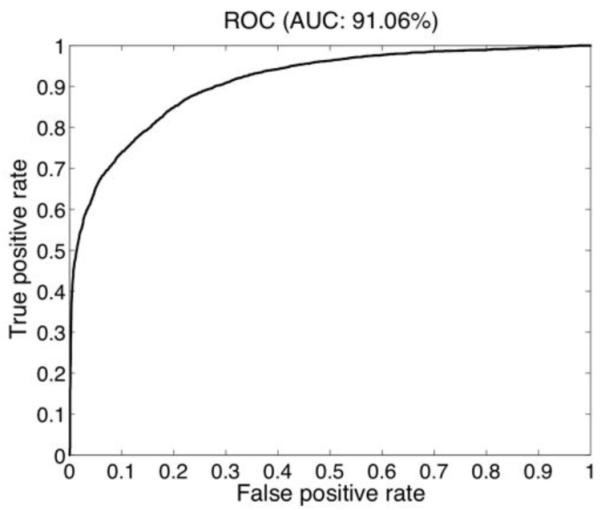
Figure 4 shows the receiver operating characteristic (ROC) curve of classification computed from testing data [16], whereby the area under the curve is 91.1%. We choose the threshold to maximize the mean of sensitivity and specificity on the training set. We estimated the 95% confidence interval on testing data using a binomial distribution for sensitivity to be [77.1%, 83.9%] and for specificity to be [83.5%, 87.4%]. The classification accuracy is same on the desktop computer and iPhone 4 smartphone.
Fig. 4.

ROC curve for lesion classification.
3.4. Execution time
We compare the time taken for active contour segmentation and classification on the Apple iPhone 4 smartphone and a typical desktop personal computer (2.26 GHz Intel Core 2 Duo with 2GB RAM). The classification time includes time taken for feature extraction. The average image size in the dataset is 552×825 pixels. Table 2 shows computation time in seconds for both platforms. For the largest image in the dataset which has dimensions 1879×1261 pixels, segmentation takes 9.71 sec and classification takes 2.57 sec on the iPhone. Thus, the whole analysis procedure takes under 15 sec to complete. This proves that the library is light enough to run on a smartphone which has limited computation power.
Table 2.
Computation time on the iPhone 4 and desktop computer
| Mean time (sec) | Apple iPhone 4 | Desktop computer |
|---|---|---|
| Segmentation | 3.4838 | 2.1752 |
| Classification | 1.3438 | 0.2418 |
4. CONCLUSIONS AND DISCUSSION
In this study we presented the SkinScan© library, which implements several image processing and image analysis algorithms for melanoma detection, and evaluated whether these algorithm can run on processors used on smartphone devices, which typically have lower computing power and memory. The library is written in C/C++ and it is therefore well suited for Apple iOS-based devices (iPhone, iPad, and iPod Touch) as well as Android-based devices. However, in this paper we tested only an iPhone 4 implementation.
In particular, we showed that the most computational intensive and time consuming algorithms of the library, namely image segmentation and image classification, can achieve accuracy and speed of execution comparable to a desktop computer. These findings demonstrate that it is possible to run sophisticated biomedical imaging applications on smartphones and other handheld devices, which have the advantage of portability and low cost, and therefore they can make a significant impact on health care delivery as assistive devices in underserved and remote areas.
Acknowledgments
This work was supported in part by NIH grant no. 1R21AR057921, and by grants from UH-GEAR and the Texas Learning and Computation Center at the University of Houston.
5. REFERENCES
- [1].Situ N, Yuan X, Chen J, Zouridakis G. Malignant melanoma detection by bag-of-features classification. Engineering in Medicine and Biology Society, 2008. EMBS 2008; 30th Annual International Conference of the IEEE; 2008. [DOI] [PubMed] [Google Scholar]
- [2].Csurka G, Dance C, Fan L, Willamowski J, Bray C. Visual categorization with bags of keypoints. ECCV; workshop on Statistical Learning in Computer Vision.2004. [Google Scholar]
- [3].Argenziano G, Soyer HP, Giorgi VD, Piccolo D, Carli P, Delfino M, Ferrari A, Wellenhof R, Massi D, Mazzocchetti G, Scalvenzi M, Wolf I. Dermoscopy: a tutorial. 2000 edition EDRA: medical publishing and new media; Feburary, 2000. [Google Scholar]
- [4].Huang T, Yang G, Tang G. A fast two-dimensional median filtering algorithm. Acoustics, Speech and Signal Processing, IEEE Transactions on. 1979 Feb;27:13–18. [Google Scholar]
- [5].Ridler TW, Calvard S. Picture thresholding using an iterative selection method. IEEE transactions on Systems, Man and Cybernetics. 1978;SMC-8:630–632. [Google Scholar]
- [6].Dunn JC. A fuzzy relative of the isodata process and its use in detecting compact well-separated clusters. Journal of Cybernetics. 1973;3:32–57. [Google Scholar]
- [7].Bezdek JC. Pattern Recognition with Fuzzy Objective Function Algoritms. Plenum Press; 1981. [Google Scholar]
- [8].Chan TF, Vese LA. Active contour without edges. IEEE Transaction on Image Processing. 2001;10:266–277. doi: 10.1109/83.902291. [DOI] [PubMed] [Google Scholar]
- [9].Shapiro LG, Stockman GC. Computer Vision. Prentice Hall; 2001. [Google Scholar]
- [10].Menzies SW, Ingvar C, Crotty KA, McCarthy WH. Frequency and morphologic characteristics of invasive melanomas lacking specific surface microscopic features. Archives of Dermatology. 1996;132(10):1178–1182. [PubMed] [Google Scholar]
- [11].Argenziano G, Fabbrocini G, Carli P, De Giorgi V. Epiluminescence microscopy for the diagnosis of doubtful melanocytic skin lesions. Arch Dermatol. 1998;134:1563–70. doi: 10.1001/archderm.134.12.1563. [DOI] [PubMed] [Google Scholar]
- [12].Elbaum M, Kopf AW, Rabinovitz HS, Langley RGB, Kamino H, Mihm MC, et al. Automatic differentiation of melanoma from melanocytic nevi with multispectral digital dermoscopy: A feasibility study. Journal of the American Academy of Dermatology. 2001;44(2):207–218. doi: 10.1067/mjd.2001.110395. [DOI] [PubMed] [Google Scholar]
- [13].Stollnitz EJ, DeRose TD, Salesin DH. Wavelets for computer graphics: A primer. IEEE Computer Graphics and Applications. 1995;15:76–84. [Google Scholar]
- [14].Hartigan JA, Wong MA. A k-means clustering algorithm. Applied Statistics. 1979;28:100–108. [Google Scholar]
- [15].Xu L, Jackowki M, Goshtasby A, Roseman D, Bines S, Yu C, Dhawan A. Segmentation of skin cancer images. Image and Vision Computing. 1999;17:65–74. [Google Scholar]
- [16].Fawcett T. An introduction to roc analysis. Pattern Recognition Letters. 2006;27(8):861–874. [Google Scholar]


