

Abstract
Recognition of point mutations in the K-ras gene can be used for the clinical management of several types of cancers. Unfortunately, several assay and hardware concerns must be addressed to allow users not well-trained in performing molecular analyses the opportunity to undertake these measurements. To provide for a larger user-base for these types of molecular assays, a vertically-stacked microfluidic analyzer with a modular architecture and process automation was developed. The analyzer employed a primary PCR coupled to an allele-specific ligase detection reaction (LDR). Each functional device, including continuous flow thermal reactors for the PCR and LDR, passive micromixers and ExoSAP-IT® purification, was designed and tested. Individual devices were fabricated in polycarbonate using hot embossing and assembled using adhesive bonding for system assembly. The system produced LDR products from a DNA sample in ~1 h, an 80% reduction in time compared to conventional bench-top instrumentation. Purifying the post-PCR products with the ExoSAP-IT® enzyme led to optimized LDR performance minimizing false positive signals and producing reliable results. Mutant alleles in genomic DNA were quantified to the level of 0.25 ng of mutant DNA in 50 ng of wild-type DNA for a 25 μL sample, equivalent to DNA from 42 mutant cells.
Keywords: K-ras mutation, Ligase detection reaction, Microfluidic system
Introduction
Cancer is a major contributor to human death accounting for ~13% of all deaths worldwide in 2008 according to the World Health Organization (http://www.who.int/mediacentre/factsheets/fs297/en/). Mutated K-ras genes have been found in a broad range of human cancers [1]. For example, K-ras point mutations were identified in more than 70% of patients with pancreatic adenocarcinomas [2; 3; 4; 5], and also in 35–50% of colorectal adenomas and cancers [6; 7; 8]. Most K-ras mutations (65–100%) are localized to codon 12 (glycine; GGT) of coding exon 1 with rare events occurring at codons 13 (glycine; GGC) and 61 (glutamine; CAA) of coding exons 1 and 2, respectively [1; 9; 10; 11; 12; 13; 14]. The most frequently observed point mutations within codon 12 produces a glycine to aspartate transition (GAT; G>A transition – G12D) or valine transversion (GTT; G>T transversion - G12V) [15; 16]. These substitutions produce oncogenic p21 ras proteins that inhibit GTPase activity while maintaining their binding capacity. The oncogenic p21 ras proteins are resistant to the action of the GTPase-activating protein, which no longer promotes GTP hydrolysis and constitutively remain in the active, GTP-bound state [17]. Therefore, they provoke unregulated proliferation and impaired differentiation in host cells.
The presence or absence of K-ras gene mutations have been used as a potential cancer (e.g., pancreatic and colorectal cancers) marker [18]. Genomic DNA obtained either by tissue biopsy or from circulating DNA may contain low copy numbers of mutant DNA, while the vast majority consists of wild-type DNA. The detection of K-ras gene mutations therefore requires a diagnostic assay that is accurate, sensitive, quick, and robust even when the mutated allele is a minority in a heterogeneous population. K-ras mutations may be discovered in the primary tumor by allele-specific PCR, direct DNA sequencing or restriction endonuclease digestion methodologies [11; 19; 20; 21; 22; 23]. However, each of these techniques has limitations. For example, allele-specific PCR tends to generate false positive signals due to contamination and DNA polymerase errors (13,21–22). Direct DNA sequencing is still labor-intensive and has low sensitivity for detecting K-ras mutations, especially when in low-abundance (23–24). For restriction endonuclease digestion techniques (25), relatively long reaction times are required with more than one hour needed for enzymatic completion. In addition, the mutation sites must be embedded within the recognition sequences of the restriction endonucleases used for the analysis.
A combined PCR/LDR (Ligase Detection Reaction) analysis can efficiently discriminate low-abundant mutant DNA from high copy numbers of wild-type DNA [24; 25; 26; 27; 28; 29; 30]. After PCR amplification of the target containing the loci of interest, remaining Taq DNA polymerase in the post-PCR products must be deactivated so as to not produce interferences in the subsequent LDR step. The final PCR products are subjected to LDR by adding discriminating and common oligonucleotides that flank the point mutation as well as a ligase enzyme. The discriminating oligonucleotide has a base at its 3′-end that corresponds to the single-base substitution site. When the discriminating oligonucleotide is perfectly matched at its 3′-end to the locus of the PCR product being interrogated, a thermostable DNA ligase specifically joins the common and discriminating oligonucleotides. This technique can also be used in multiplexed assays with the entire panel of K-ras mutations [25; 31] being screened in a single reaction. The total analysis typically takes > 4 h of processing time to undertake in the laboratory using conventional benchtop instrumentation, with additional time required for sample preparation.
Microfluidic systems that provide process integration for multi-step assays are potentially viable platforms for clinical applications. These systems can be used to automate the entire analysis pipeline of complex samples while reducing reagent consumption and accelerating the assay turn-around time. A variety of systems have been fabricated and evaluated for genotyping applications [32; 33], but many do not invoke strategies that can detect single base mutations in a high excess of wild-type DNA. Microfluidic devices developed for PCR/LDR analysis of low-abundance point mutations typically do serial processing in which the PCR products are directly subjected to LDR analysis [26; 30]. As such, the Taq polymerase, excess primers and dNTPs reside within the post-PCR mixture and can continue primer extension. Although the total analysis time was dramatically reduced using the microfluidic system, taking under 30 min in a continuous flow device, interfering products were generated during the LDR cycling as a result of continued Taq activity. These post-PCR products could adversely affect the accuracy of the LDR results. Therefore, purification of the post-PCR products is necessary for applying this analysis methodology in a clinical setting, which requires accurate and reliable results to produce viable clinical decisions based on the molecular analysis.
Several methods have been used to purify post-PCR products for subsequent molecular processing steps. Heat inactivation was used by Hashimoto et al. [27] to denature the Taq polymerase prior to LDR. The total reaction time was increased due to the long thermal incubation time (95 °C for 120 min) required. Also, gaseous bubbles may form in the microchannels or microchambers when heating the products to 95°C, causing poor performance in the subsequent processing steps [33]. Alternatively, a column- or bead-type media could be used for post-PCR purification with all substances except the amplified PCR products being specifically retained on the solid-phase and subsequently removed by a washing step. However, loss of DNA products in the media during the purification processes are inevitable [32; 34]; for a DNA sample containing a low ratio of mutant to wild-type DNA, a small loss of mutant DNA can lead to false negative results. Another option is to use the Stoffel fragment for the PCR amplification instead of Taq polymerase, which lacks 5′ → 3′ exonuclease activity [26]. This approach efficiently decreased the amount of LDR by-products (289 bp), but the polymerization activity of the Stoffel fragment with excess primers and dNTPs during the LDR phase of the assay was still retained. This generated several DNA fragments (Figure S1) that were not detected visually by the DNA analysis system and provided nonuniform concentration of DNA templates for the subsequent LDR assay, which could impact the fidelity and efficiency of the LDR phase of the assay.
An alternative approach for purification of PCR products prior to subsequent processing steps, such as LDR, can utilize ExoSAP-IT®. The ExoSAP-IT® mixture is composed of Exonuclease I and Shrimp Alkaline Phosphates, which are widely used for DNA sequencing and single nucleotide polymorphism analysis [35; 36; 37; 38; 39; 40]. The complex enzyme digests remaining excess forward and reverse primers and dNTPs from the post-PCR mixture. Even though the polymerization functionality of the Taq polymerase remains active as in previous PCR/LDR assays, a solution treated with ExoSAP-IT® does not contain any source of polymerization with the primers used for the LDR step. The reaction time is only ~25 min including the inactivation step required for the ExoSAP-IT® enzyme. ExoSAP-IT® purification is ideally suited for implementation of this assay strategy in a microfluidic system due to its compatibility with downstream processing and its ability to remove sources of interfering DNA products produced by Taq polymerase.
A vertically-stacked, polymer-based PCR/ExoSAP-IT®/LDR analyzer was developed and demonstrated to detect low-abundance K-ras point mutations in genomic DNA. To obtain accurate and sensitive LDR results, a purification step for the post-PCR products, which can potentially create problems for the subsequent LDR step, was incorporated into the system design. The use of ExoSAP-IT® for post-PCR purification was investigated as a method for reducing potential PCR product loss and minimizing the generation of interfering DNA products arising from Taq extension of primers used for the LDR.
Materials and Methods
Bench-top Validation of the Assay
PCR amplification and PCR product purification
PCR was performed using four different genomic DNA templates extracted from various cell lines. The cell lines used in these experiments along with their K-ras genotypes are shown in Table 1. The concentration and quality of each genomic DNA template was estimated using a NanoDrop ND-1000 spectrophotometer (v3.0.1, Thermo Fisher Scientific Inc., Waltham, MA).
Table 1.
Source of codon 12 mutations used in experiments.
| Cell line | Source (ATCC number) | Mutation |
|---|---|---|
| HT29 | Human colon (HTB-38) | Wild-type |
| LS180 | Human colon (CL-187) | G12D |
| SW1116 | Human colon (CCL-233) | G12A |
| SW620 | Human colon (CCL-227) | G12V |
Oligonucleotide primers for the PCR amplification (395 bp) of codon 12 of the K-ras gene on chromosome 12 were designed using the Primer3 utility (http://frodo.wi.mit.edu/primer3/). Each primer was checked using OligoCalc [41] to avoid self-complementarity or potential hairpin loop formation. PCR amplifications were performed in 25 μL reactions using 50 ng of genomic DNA, 200 nM of each oligonucleotide primer, 200 μM dNTPs in 50 mM KCl, 1.5 mM MgCl2, 10 mM Tris-HCl (pH 8.4), and 1 U Platinum® Taq DNA polymerase (Invitrogen, Carlsbad, CA) using the iCycler (Bio-Rad, Hercules, CA). The PCR cocktail was subjected to an initial denaturation step of 30 s at 98 °C, followed by 35 cycles of PCR with each consisting of 5 s of denaturation at 98 °C, 25 s of annealing and extension at 60 °C, and a final extension step of 30 s at 60 °C. The PCR products were loaded onto a 2% agarose-ethidium bromide gel and visualized using UV fluorescence (Bio-Rad, Hercules, CA). To confirm the allelic composition of the locus being interrogated (C, T, G, and A) for the four different known K-ras genotypes from genomic DNA extracted from the HT29, LS180, SW1116, and SW620 cell lines, respectively, individual PCR products were gel purified using the Wizard® gel purification kit (Promega, Madison, WI) and cloned into vectors using the TOPO-TA Cloning® kit (Invitrogen, Carlsbad, CA) according to the manufacturers’ instructions. DNA sequencing was then performed using dideoxy chain-termination sequencing [42] on an Applied Biosystems automated DNA sequencer (ABI3130XL, Life Technologies, Carlsbad, CA).
The confirmed genomic DNA samples were then mixed at concentration ratios of mutant-to-wild type DNA ratios ranging from 0:1 (control) to 1:200. The concentration of wild-type DNA was set at 50 ng per 25 μL reaction. Each DNA cocktail was subjected to PCR using the conditions described above. To purify the PCR products, ExoSAP-IT® (USB, Cleveland, OH) was used. Each PCR product was processed in 10 μL reactions using 5 μL of PCR product, 2 μL of ExoSAP-IT®, and 3 μL of ddH2O. The mixtures were incubated at 37 °C for 10 min to digest the remaining forward and reverse primers and nucleotides (dNTPs) into nucleosides and inorganic phosphate followed by deactivation of the ExoSAP-IT® in the thermal cycler at 80 °C for 15 min.
LDR and Slab Gel Electrophoresis Analysis
LDR analysis was performed in 20 μL reactions using 10 μL of enzymatically ExoSAP-IT® purified PCR product, 22.5 nM discriminating primers (7.5 nM each, see Table 2), 20 nM common primer that was fluorescently labeled, 20 mM Tris-HCl (pH 7.6), 25 mM KCl, 10 mM MgCl2, 10 mM DTT, 1 mM NAD+, 0.1% Triton X-100 (Fisher Scientific, Houston, TX), and 2 U Taq DNA ligase (New England Biolabs Inc., Beverly, MA). Each LDR mixture was preheated to 95 °C for 30 s and then cycled through the following temperatures 20 times: 64 °C for 28 s and 95 °C for 7 s. Prior to polyacrylamide gel electrophoresis, the LDR products were denatured for 23 s at 95 °C and mixed with a stop solution (Li-COR Biotechnology, Lincoln, NE).
Table 2.
Oligonucleotides used in the vertical PCR/ExoSAP-IT®/LDR analyzer.
| Oligomers | Sequences (5′ – 3′) | Tm (°C)d |
|---|---|---|
| K-ras coding-exon 1 forward | CTCCCAAGGAAAGTAAAGTTCCCATA | 58 |
| K-ras coding-exon 1 reverse | GGTACTGGTGGAGTATTTGATAGTGT | 57.5 |
| K-ras c12 com-2a | pb TGGCGTAGGCAAGAGTGCCT-IRDye800c | 63.5 |
| dOligo-K-ras c12.2Da | GCTGATGGCAGGTGCTGAAACTTGTGGTAGTTGGAGCTGA | 69.7 |
| dOligo -K-ras c12.2Aa | TGACGTGACGAAACTTGTGGTAGTTGGAGCTGC | 66.8 |
| dOligo -K-ras c12.2Va | TGACGTGGCTGAGGTCGGTCGCAGATGCTGAAAACTTGTGGTAGTTGGAGCTGT | 72.9 |
Oligonucleotides are derived from Hashimoto et al. [28]. Bold letters represent stuffer sequences which generate different lengths of discriminating oligomers.
Phosphorylated.
λex = 787 nm and λem = 812 nm.
Melting temperature is calculated by oligo analyzer (http://www.idtdna.com/analyzer/Applications/OligoAnalyzer/) using the following conditions: oligo concentration, 1 μM; Na+ concentration, 50 mM.
The LDR products were separated by gel electrophoresis on a KBPLUS 6.5% Gel Matrix (Li-COR Biotechnology, Lincoln, NE). The gel solution, with 10% (w/v) ammonium persulfate and tetramethylethylenediamine (TEMED), was injected into a gel cassette (21 cm × 25 cm). After polymerization, the polyacrylamide slab gel was placed in a Global IR2 DNA analysis system (Li-COR Biotechnology, Lincoln, NE) for 2 h at 1500 V. The fluorescent bands were integrated over each separation lane using the ImageQuant TL software (v2003, Amersham Biosciences, Piscataway, NJ).
Design of the vertically-stacked, microfluidic analyzer
The analyzer was comprised of a vertically-stacked microfluidic PCR device, passive diffusional micromixers and a microfluidic LDR device mutually interconnected with a continuous flow path. Each functional device was made from two components: a microfluidic reactor and a cover plate. The microfluidic reactors included microchannels for analyte processing and the cover plates incorporated thermal management structures - grooves in this case - to reduce heat conduction between temperature zones [43]. Each reactor incorporated hole and slot alignment features that mated with hemispherical pins on the cover plates to align and constrain the components during assembly [44]. Schematics of each microfluidic reactor are shown in Figure 1.
Figure 1. Layout of the vertical analyzer in a stacked format.

(A) Microfluidic PCR reactor – S1: inlet of PCR mixture and S2: inlet of enzyme mixture for ExoSAP-IT® purification; (B) Passive diffusional micromixer reactor – S3: inlet of mixture of LDR reagents; (C) microfluidic LDR reactor.
The microfluidic PCR device was designed for continuous flow operation using a syringe pump, in which the reaction cocktail was shuttled hydrodynamically through isothermal zones to affect the thermal cycling. The channel length was calculated so that the desired residence times and proportions between zones for each cycle were achieved at the designed flow rate for the PCR mixture of 0.18 μL/min and 35 cycles. Channel dimensions were also chosen to minimize the residence time per cycle subject to reaction-imposed constraints. Two temperature zones were used for the PCR with DNA denaturation at 98°C and annealing and extension at 60°C (Figure 1A-(a)). In addition, a short channel was required in the 98°C zone to accommodate preheating before entering the thermal cycling channels. Each temperature zone had a footprint of 6.5 mm by 28 mm. The channel depth was a constant 60 μm and the channel width varied from 40 μm in the denaturation zone to 120 μm in the annealing and extension zones. Varying the channel width yielded the required residence times while obtaining footprints of comparable size for the two thermal zones. Channels of different widths were connected by a temperature transition zone between the 98 °C and 60 °C zones. The transition microchannels were 60 μm deep and 3 mm long with a 7° taper giving a transition time of 2.4 s. The total PCR residence times were 6.5 s at 98°C and 26 s at 60°C for a ratio of 1:4 for the PCR. The ratio of the channel width changes was not the same as the ratio of the residence times because of the different channel lengths.
The outlet for the PCR was connected to a device combining mixing and purification. The first passive diffusional micromixer was designed based on previous studies [45; 46] to combine the PCR products with the ExoSAP-IT® enzyme mixture at a 1:1 volume flow rate ratio. The diffusion channel was 34.4 mm long with a width and depth of 40 μm and 60 μm, respectively. The mixer and diffusion channel were located in a temperature transition zone between 60°C and 37°C as shown in Figure 1A-(b). The effects of the temperature gradient on mixing, which resulted from the temperature dependence of the diffusion coefficients, were factored into the design of the mixer. Minimizing the pressure drop was emphasized over faster mixing in this micromixer because shorter mixing times were not critical compared to the relatively long incubation times required for the purification of the post-PCR products. Furthermore, because the enzyme only worked with an excess of primers and dNTPs, which have larger diffusion coefficients than the PCR products in the mixture [47; 48], a shorter diffusion length for complete mixing of the critical components was also expected with the temperature elevated to 37°C. The design was conservative because it was based on the smallest diffusion coefficient among all of the reaction components (see Table 3). An incubation channel, 180 μm wide, 100 μm deep and 240 mm long, was followed by the mixing channel (see Figure 1A-(c)). The residence time was approximately 10 min with a combined flow rate of 0.36 μL/min, which included 0.18 μL/min for the PCR mixture and 0.18 μL/min for the enzyme mixture.
Table 3.
Typical diffusivities for various tracers in water at room temperature [48].
| Particle | Typical size | Diffusion coefficient (μm2/s) |
|---|---|---|
| Solute ion | 10−1 nm | 2 × 10³ |
| Small protein | 5 nm | 40 |
| Virus | 100 nm | 2 |
| Bacterium | 1 μm | 0.2 |
| Mammalian/human cell | 10 μm | 0.02 |
Deactivation of the purification enzyme was combined with a second passive diffusional micromixer to produce the LDR cocktail as shown in Figure 1B. The purified PCR output flowed into the deactivation channel, which was 180 μm wide, 100 μm deep, and 300 mm long, to produce a 15 min residence time at 80°C before mixing with the LDR reagents (Figure 1B-(d)). The deactivation channel was connected to a mixing microchannel to produce the LDR mixture at the junction with a 1:1 flow rate ratio as seen in Figure 1B-(f). The mixing channel theoretically allowed complete mixing for small proteins including short DNA fragments in <1 min using the same concepts employed in the first mixer (Figure 1B-(f) and (e)). The necessary channel lengths were calculated for different substances using diffusivities of various tracers, shown in Table 3 [48; 49]. These values showed how any tracers move diffusively through the fluid at room temperature. The diffusion coefficients for small proteins and 43 bp DNA fragments were approximately 40 μm2/s and 50 μm2/s, respectively. The corresponding mixing length required for the 60 μm wide and 60 μm deep channels was 300 mm. The length was reduced to account for the effect of the temperature gradient produced by the thermal cycling components on the top and bottom of the analyzer with the estimated temperature varying between 40 and 80 °C along the mixing channel. The diffusion coefficients were expected to increase between ~1.6 and ~3.2 fold over that temperature range. The final mixing channel dimensions were 60 μm wide, 60 μm deep and 160 mm long. The nominal residence time in the mixing channel was ~50 s.
Continuous flow operation at a total volume flow rate of 0.72 μL/min was the basis for the microfluidic LDR device with 20 cycles of thermal cycling between 94°C for denaturation, and 64°C for annealing and ligation (Figure 1B-(g)). A short channel section was incorporated between the inlet (S3) and the reactor to preheat the sample for 10 s at 94°C. The channel depth was a uniform 72 μm. As in the PCR design, a change in the width of the microchannel was used to control the residence time, reduce the length and footprint of the microchannel and to ensure temperature zones with an equal footprint of 12.5 mm by 28 mm. The channel width was 60 μm for 5 s per cycle at 94°C and 240 μm for 25 s per cycle at 64°C giving a residence time ratio of 1:5. The transition sections between the temperature zones were 80 μm wide, 60 μm deep and 3 mm long with a 7° taper angle giving transition times of 1.2 s. In order to decrease the lateral heat transfer between the temperature zones in the PCR and LDR microfluidic reactors, the cover plates were patterned with grooves to separate the temperature zones. These were 3 mm wide and 2 mm deep and were critical for successful thermal management in the temperature zones to ensure that reactions were carried out within the optimal temperature ranges, based on the results of thermal simulation [50].
A pair of microfluidic interconnects and spacers were used to connect each set of devices in the vertically stacked analyzer. The interconnects served two primary functions; effectively transporting the analyte to the next device and providing adequate vertical spacing to ensure the desired temperature distribution was achieved in the reactors while the spacers were used for thermal management only. The fluidic connections were between a reservoir on the cover of each microfluidic device with a diameter of 500 μm and a reservoir with a larger diameter for the microfluidic interconnects. The interconnects included two reservoirs, which were 850 μm in diameter on the top and bottom of each component and a laser-drilled hole for fluid passage. Passive alignment features, including a hemispherical pin-in-hole, a hemispherical pin-in-slot, and a plate-plate lap joint, were used to guide the assembly process. The total dead volume in the four fluidic interconnects was estimated to be 588 nL, which consisted of 354 nL between the microfluidic PCR device and the passive micromixers, and 234 nL between the passive micromixers and the microfluidic LDR device. The dead volume was approximately 125 nL for the fluid passage between the PCR and micromixers and 98 nL for the channel between the mixers and LDR device.
Fabrication and assembly of the microfluidic devices to form the vertical analyzer
Each microfluidic device was fabricated in 2 mm thick polycarbonate, PC (LEXAN® 9034 Sheet, SABIC Innovative Plastics™, Pittsfield, MA), using hot embossing (HEX-02, Jenoptik, Jena) and a micromilled brass mold insert [26]. After the embossed parts were cut to the desired size, the back side was fly cut (Optimum 120, Precitech, Keene, NH) to decrease the thickness of the devices from 2 mm to 0.5 mm. This process was performed by a flycutting machine (Optimum 120, Precitech, Keene, NH), which has a vertical-axis spindle and flycutter over a horizontal-axis slide. The hole and slot features were exposed for alignment.
Cover plates, including grooves on one side and hemispherical pins on the opposite side, were produced using double-sided hot embossing with two micromilled brass mold inserts. PC substrates with 3 mm thickness were sandwiched between the mold inserts that were aligned with respect to each within a few micrometers. The top molding tool contained thermal management features and the bottom molding tool possessed alignment features. After the embossed parts were cut from the substrate, a hole was drilled using an excimer laser (Maestro, Resonetics, Nashua, NH) through each cover plate.
All reactors and cover plates were cleaned using 1% detergent, isopropyl alcohol (IPA), and DI water and dried in a convection oven (VWR 1602, VWR Scientific Inc., PA) at 85°C overnight. After each 0.5 mm thick device was aligned with the corresponding 3 mm thick cover plate, they were thermally fusion bonded. For fusion bonding, the parts were sandwiched between borosilicate glass plates (McMaster-Carr, GA), tightly clamped and put in a convection oven at 151°C for 2 h.
Both the interconnects and the spacers were produced by double-sided hot embossing. The microfluidic interconnect used to assemble the PCR microfluidic device and the passive microfluidic mixer was 4.5 mm thick. The fluidic via between the reservoirs at the center, with a 300 μm diameter, was fabricated by excimer laser ablation. The spacer had no fluid passage, serving only as a standoff. The same types of microfluidic interconnector and spacer, with 3.0 mm thicknesses, were used to assemble the passive microfluidic mixer with the microfluidic LDR device. All of the components were thoroughly cleaned using the same procedure as that used for the reactors and cover plates, then baked in a convection oven at 85°C for 30 min to remove residual water from the components.
An adhesive coating, SU-8 MicroSpray™ (Microchem Corp., MA, USA), was applied to each of the microfluidic interconnects for bonding. The openings of the microfluidic ports were temporarily masked using removable tape (Scotch® 811 Removable Tape, 3M, St. Paul, MN) to protect them from clogging during the application of the adhesive. After the thermally bonded modules were assembled with the fluidic interconnects and spacers using the passive alignment features, they were clamped between glass plates, cured at room temperature for 1–2 h, then baked in a convection oven at 95°C for 10 min.
Kapton™ heaters (HK5569; HK5574, Minco Inc., Minneapolis, MN) were mounted on 1 mm thick copper sheets. Thermocouples were embedded in channels micromilled in each copper sheet for feedback to make integrated temperature control units. The temperature control units were sized to match the dimensions of the heated zones in the reactors, two each in the PCR and LDR devices. The thermocouples (HYP-0, Omega Engineering Inc., Stamford, CT), were Type Q, 200 μm in diameter, and mounted in the channel with thermally-conductive paste (OMEGATHERM® 201, Omega Engineering Inc., Stamford, CT) to ensure good thermal contact. A thermocouple control module and a PWM module in a FieldPoint™ data acquisition system (NI FP-1000, National Instruments Inc., Austin, TX) were used for thermal control. A LabVIEW™ (v.7.1, National Instruments Inc., Austin, TX) program using a Proportional Integral Differential (PID) toolkit was used to modulate the temperatures in each temperature zone. A set point profile of the temperature with time was supplied to the program to govern operation.
Operation of the vertical analyzer for mutation detection
Three syringe pumps, S1 – S3 (New Era Pump Systems, Wantagh, NY) were used to drive a continuous flow of reagent mixtures into the microchannel network of the vertical analyzer. Separate inlet ports were used for each cocktail (see Figure 1): S1 – PCR cocktail, S2 - ExoSAP-IT® reagents, and S3 – LDR primers. Flexible fused silica capillary tubing (Polymicro Technologies, Phoenix, AZ) was connected to the inlet and outlet ports. Tubing with a 75 μm inner diameter was used at ports S1 and S2 and tubing with a 100 μm inner diameter was connected to port S3 and the outlet port. The tubes were directly inserted into the microchannels at each port and sealed with an epoxy adhesive (Scotch-Weld™, 3M St. Paul, MN) and applied at the entrance of the microchannels to avoid leakage of reagents.
A solution including bovine serum albumin (BSA) with a concentration of 1 μg/μL was injected into the microchannel network through ports S1, S2, and S3 for leakage testing and maintained for 1 h. This primed the microchannel network with BSA to reduce any non-specific adsorption of enzymes to these walls. After each use, air was used to completely remove any remaining solution from the device, which was then dried in a convection oven at 45°C for 1 h.
PCR reagents, including the genomic DNA, were premixed off-chip to a 25 μL total volume and pumped into port S1 in the PCR device at a volume flow rate of 0.18 μL/min (see Figure 1A-(a)). The concentration ratio of the mutant-to-wild type DNA was varied from 0:1 (control) to 1:200. After circulating through the isothermal temperature zones for approximately 28 min, the PCR products were mixed with the hydrolytic enzymes in nuclease free water to a volume of 10 μL via injection through port S2 at a volume flow rate of 0.18 μL/min. The mixture consisted of 4 μL of enzyme and 6 μL of ddH2O. The mixing was performed at a volume flow ratio of 1:1 with respect to the PCR cocktail. After 10 min of ExoSAP-IT® incubation, the mixture entered a long channel to deactivate the enzyme mixture at approximately 80°C for 15 min.
Prior to carrying out the LDR on-chip, synthetic primers (discriminating primers and common primers, IDT, Coralville, IA), DNA ligase in a reaction buffer (New England Biolabs, Beverly, MA) and water were premixed to a total volume of 10 μL and injected through port S3 at 0.36 μL/min. This was mixed with the purified PCR products in a channel situated on the passive diffusional micromixer chip of the analyzer. Following mixing, the LDR was carried out on device C (See Figure 1). The final sample was collected in a microfuge tube (VWR, Suwanee, GA) connected via a capillary tube to the outlet port.
The total reaction time for the assay using this vertical analyzer, based on the input volumetric flow rates, the length of the reactor/mixing channels and their cross-sectional areas, was estimated to be 67 min, with 28 min for PCR, 25 min for the post-PCR purification, 1.5 min for mixing and 12.5 min for the LDR.
The performance of the PCR was tested independently with all of the heaters on with the sample inlets, S3 and outlet closed to prevent sending the PCR products to subsequent devices comprising the system. Four PCR mixtures were prepared with different concentration ratios of mutant to wild-type DNA ranging from 0:1 to 1:200 (mutant: wild-type DNA) in a 25 μL volume. Each PCR mixture was continuously pumped through the microfluidic PCR device from port S1 at 0.18 μL/min and samples were collected at port S2.
Results and Discussion
Vertically-stacked PCR/ExoSAP-IT®/LDR analyzer
The final assembled system is shown in Figure 2. The dimensions of the analyzer, including the three devices comprising it, were 52 mm in length, a width of 28 mm and a height of approximately 17.5 mm.
Figure 2. A vertical PCR/ExoSAP-IT®/LDR analyzer for mutation detection.

(A) Assembled analyzer including (1) microfluidic PCR reactor, (2) passive micromixer reactor, (3) microfluidic LDR reactor. The scale bar represents 10 mm. (B) A working prototype vertical analyzer mounted on insulation material of the heating stage and fitted with tubing and temperature control units.
To amplify the coding exon of the K-ras gene in human chromosome 12, K-ras specific PCR primers (Table 2) were used with the PCR carried out directly on mutant and wild-type genomic DNA as templates for the vertical PCR/ExoSAP-IT®/LDR analyzer. In order to provide a device suitable for clinical diagnostics, the vertically-stacked PCR/ExoSAP-IT®/LDR analyzer processed genomic DNA directly extracted from cultured cells.
A process development diagram for the PCR/ExoSAP-IT®/LDR assay is given in Figure S2. Briefly, the coding exon of the K-ras gene, which contained the point mutation(s), was amplified by using a PCR with mixed genomic DNAs (mutant:wild-type). After the PCR amplification, the post-PCR amplicon (395 bp) was purified by the enzyme system, ExoSAP-IT®. The purified DNA fragments were then combined with the LDR cocktail, which contained three different discriminating primers, fluorescently-labeled common primers and the DNA ligase within the reaction buffer. If the discriminating primer was perfectly matched at its 3′-end to the allele being interrogated on the target, the DNA ligase catalyzed the formation of a phosphodiester bond between the 3′ hydroxyl group of the discriminating primer and the 5′ phosphate termini of the fluorescently-labeled common primer and produced size-specific LDR products that could be analyzed via electrophoresis (Figure S2).
Previous studies have focused on PCR product purification using column- or bead-based approaches [32; 34], which can lead to DNA loss and therefore, the concentration of the purified post-PCR products may not be identical among replicate samples. The best previous PCR/LDR performances [26; 30] for high accuracy detection of low-abundance K-ras point mutations required 5–10 ng of mutant genomic DNAs. The vertically-stacked analyzer could successfully detect 0.25 ng of mutant DNA in 50 ng of wild-type DNA. The 0.25 ng of mutant genomic DNA corresponded to approximately 42 mutant cells (one diploid genome per cell is ~6 pg) in 25 μL.
The system produced LDR products from a DNA sample in ~1 h, which was 20% of the time required for bench top processing. In addition, even if we consider sample preparation time, the system would save a total of more than 80% processing time compared to conventional bench-top instrumentation.
Assessment of biases generated by unpurified post-PCR products
Post-PCR products containing Taq polymerase, excess primers and dNTPs can potentially interfere with the LDR process [28; 51; 52]. The observed interference(s) of the LDR is explained by several factors: The PCR primers remaining after amplification anneal and amplify DNA strands using residual dNTPs and Taq polymerase during the LDR process [27]. This phenomenon generates another LDR product (151 bp) along with the expected LDR product even though Taq polymerase contains 5′→3′ exonuclease activity that can degrade the labeled primer hybridized to a specific target (Figure 3A). The amount of degraded primer was dependent on starting template and primer concentrations and the number of amplification cycles [53]. These by-products could affect the yield of the intended LDR product due to competition between the LDR mixture and other products, which are generated by reaction components remaining after the PCR.
Figure 3. Post-PCR product purification using ExoSAP-IT®.

(A) LDR results without the ExoSAP-IT® purification step and (B) LDR results with the ExoSAP-IT® purification step. Blue and red arrows represent forward and reverse primers, respectively, used for the PCR. Blue dotted lines indicate a new DNA strand that was synthesized by remaining dNTPs with Taq DNA polymerase when in the LDR phase of the assay. Polyacrylamide gel electropherograms of LDR products are shown on the right. The ratio of mixed DNAs (mutant: wild-type) used in each LDR are shown on the top of each gel image. SW620 (G12V) genomic DNA was used as a mutant sample and thus a 74 bp LDR product was detected by the Global IR2 DNA analysis system. However, unpurified post-PCR products generated another LDR product (151 bp).
Additionally, if the DNA strands synthesized by the remaining PCR primers, dNTPs, and Taq polymerase do not react with the K-ras c12 Com-2 common primers and the discriminating primers during the LDR process, production of three erroneous PCR-based products was expected. First, the size of the by-product strands during LDR is identical to the PCR product due to continuation of the PCR during the LDR process (Figure S1-A). Second, the discriminating primers (i.e., dOligo-K-ras c12.2D, dOligo-K-ras c12.2A, and dOligo-K-ras c12.2V) could be utilized as forward primers and generate 304, 297, and 318 bp DNA fragments, respectively (see Figure S1-B). These DNA fragments (304, 297, and 318 bp) could also be used as templates for the reverse primers. Finally, 304, 297, and 318 bp double stranded DNAs are generated by the discriminating primers, remaining reverse primer, dNTPs, and Taq polymerase (Figure S1-C and -D). Although these processes provide more templates to perform LDR, they generate additional erroneous LDR products and background (Figure 3A, see multiple bands). Unbiased amplification of each DNA strand can produce inaccurate LDR results because the samples with mutant DNA are mixed with the wild-type DNA. Biases will persist unless the reactants used in the previous steps are removed. The purification of the PCR products should ideally be performed before the subsequent molecular step to prevent confounding events during the LDR phase of the assay.
Optimization of LDR following ExoSAP-IT® purification
The LDR product yield of samples treated with ExoSAP-IT® were compared with ones generated without ExoSAP-IT® (Figure 4). The intensity of the LDR products without the ExoSAP-IT® step were much higher than those with the ExoSAP-IT® step because of the continuation of the PCR during the LDR process (Figure S1). Although both methods, either with or without the ExoSAP-IT® step, can provide a strategy for identifying the presence of mutant alleles, only the purified products enabled efficient quantification of these mutant alleles. The large standard deviations in the results from the PCR/LDR without ExoSAP-IT® indicated the presence of false positive results generated by the unpurified post-PCR products; with the standard deviations shown, the 1:50 and 1:100 concentration ratios of mutant-to-wild-type could not be distinguished. The high standard deviations lead to inconsistent results due to unbiased amplification of each DNA strand, including both wild-type and mutant alleles, during the LDR process as shown in Figure S1.
Figure 4. Comparison of LDR product yields.

(A) LDR assay after the ExoSAP-IT® purification step and (B) LDR assay without the purification step. The LDR product yields were estimated from the corresponding gel images using ImageQuant software and shown as the mean with their associated standard deviation, which were based on three replicates. The lines represent an exponential regression best fit of experimental data.
LDR genotyping using different length discriminating primers
To screen LDR products generated from allele-specific reactions, previous studies have typically used a zip code microarray. The 5′ end of the LDR products generated by the ligation reaction was complementary to a zip code probe patterned in a two-dimensional array [27; 28]. Recently, Sinville and co-authors utilized drag-tags appended to discriminating primers, which consisted of linear poly N-methoxyethylglycine (N-MEG) moieties attached to the 5′-end of the discriminating primer used for the LDR. Three different discriminating primers for each point mutation contained three different N-MEG drag-tags [30]. By using this methodology, each point mutation was distinguished on the basis of size as characterized by its electrophoretic mobility [30]. With this format, free solution electrophoresis could be undertaken without requiring the need for a sieving matrix.
Different length discriminating primers [25] designed for the LDR genotyping and polyacrlyamide gel electrophoresis were used to sort the products by size (Table 2) following their processing using the LDR genetic analyzer. For detection, the common primers were fluorescently labeled on their 3′-ends. By using these discriminating primers, three types of LDR products were generated from the LS180 (G12D), SW1116 (G12A), and SW620 (G12V) cell lines, corresponding to fragment lengths of 60, 53, and 74 bp, respectively (Figure 5), which were successfully detected using the slab gel electrophoresis after PCR/LDR processing and ExoSAP-IT® post-PCR cleanup.
Figure 5. LDR genotyping using different length discriminating oligomers.
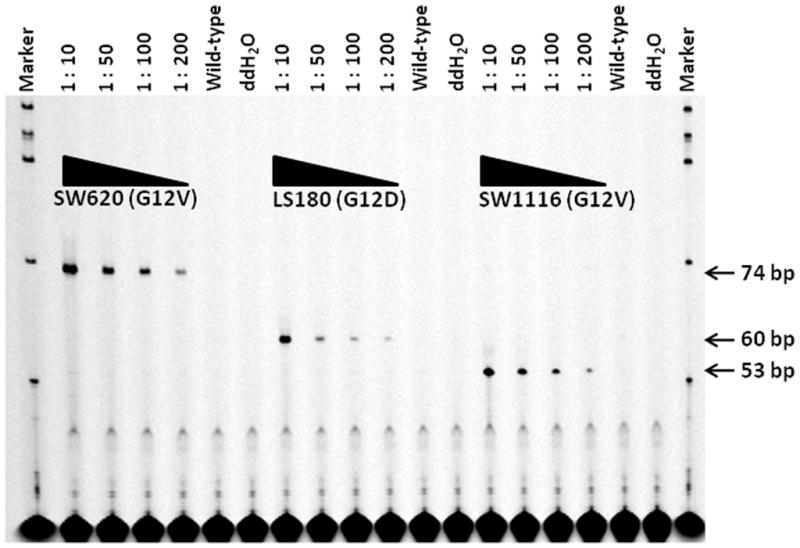
The ratio of mixed DNA samples (mutant: wild-type DNA) used in each LDR is shown on top of the gel images. The concentration of wild-type DNA was fixed as 50 ng per reaction. The three types of LDR products from SW620 (G12V), LS180 (G12D), and SW1116 (G12A) corresponded to 74, 60, and 53 bp, respectively.
Conclusions
The vertically-stacked, polymer-based microfluidic PCR/ExoSAP-IT®/LDR analyzer was developed and demonstrated successfully. The PCR, post-PCR product purification, and LDR processing steps were conducted sequentially on this system and used to detect low-abundance K-ras point mutations with high accurately due to the incorporation of enzymatic post-PCR product purification. The inclusion of the post-PCR product purification step before the LDR step optimized LDR performance because the unpurified post-PCR products interfered with the sensitivity of the LDR and lead to high variation of replicate LDR results. The total processing time was about one hour, which was 20% of the time required for bench top processing and comparable to other microfluidic devices with lower accuracy. The processing speed of this analyzer could be improved by further optimization of the additional purification step. When compared with previous PCR/LDR analyzers and DNA sequencing, our PCR/ExoSAP-IT®/LDR analyzer has advantages of (i) conveniently distinguishing different substitutions on the same target (ii) supporting quantitative detection of point mutations without erroneous LDR products and background due to the use of different lengths of discriminating primers and ExoSAP-IT®. This novel vertically-stacked PCR/ExoSAP-IT®/LDR analyzer could be practical for the detection of low-frequency base substitutions in cancer or disease-associated genes in addition to the K-ras gene.
Supplementary Material
All of these products are generated by unpurified post-PCR mixtures that contain Taq DNA polymerase, dNTPs, and PCR primers present during the LDR phase of the assay, which can potentially interfere with the LDR process. (A) Remaining forward and reverse primers (blue and red arrows, respectively) anneal to the PCR products and new strands are extended by the DNA polymerase before the annealing of discriminating and common primers used for the LDR. (B) Discriminating primers anneal to the PCR products and a new fragment is produced by extension of these primers by the DNA polymerase. (C) The DNA fragment(s) generated by (B) provide a new template for reverse primers and thus, new DNA fragments are created. (D) Small amounts of erroneous products were detected by DHPLC analysis.
A karyotype image of human chromosome 12 was created using the idiographica webtool [54]. Blue and red arrows represent forward and reverse primers, respectively. The vertical red line indicates the position of the K-ras point mutation. An agarose gel electropherogram is shown on the right showing the PCR products that were generated. The DNA templates used in each PCR reaction are shown on the top of the gel images. Three discriminating primers for the LDR assay are represented by yellow-, blue-, and green-black lines.
Acknowledgments
Funding
This work was supported by grants from the National Institutes of Health [R24-EB002115]; National Science Foundation [EPS-0346411 and EPS-0701491]; World Class University program through the National Research Foundation of Korea funded by the Ministry of Education, Science and Technology [R31-10069].
The authors would also like to thank Drs. Mark A. Batzer, Joomyeong Kim, and Thomas J. Meyer for their useful comments during preparation of the manuscript, Mr. Jason Guy of the Center for BioModular Multi-Scale Systems (CBMM) and Dr. Proyag Datta of the Center for Advanced Microstructures and Devices (CAMD) for their contributions to the polymer microfabrication of this work and Dr. Francis Barany and Dr. Yu-Wei Cheng for valuable support of the biological work. We also thank all members of the Won Cheoul Jang laboratory for performing DHPLC analysis.
Footnotes
Publisher's Disclaimer: This is a PDF file of an unedited manuscript that has been accepted for publication. As a service to our customers we are providing this early version of the manuscript. The manuscript will undergo copyediting, typesetting, and review of the resulting proof before it is published in its final citable form. Please note that during the production process errors may be discovered which could affect the content, and all legal disclaimers that apply to the journal pertain.
References
- 1.Bos JL. The ras gene family and human carcinogenesis. Mutat Res. 1988;195:255–71. doi: 10.1016/0165-1110(88)90004-8. [DOI] [PubMed] [Google Scholar]
- 2.Almoguera C, Shibata D, Forrester K, Martin J, Arnheim N, Perucho M. Most human carcinomas of the exocrine pancreas contain mutant c-K-ras genes. Cell. 1988;53:549–54. doi: 10.1016/0092-8674(88)90571-5. [DOI] [PubMed] [Google Scholar]
- 3.Hruban RH, van Mansfeld AD, Offerhaus GJ, van Weering DH, Allison DC, Goodman SN, Kensler TW, Bose KK, Cameron JL, Bos JL. K-ras oncogene activation in adenocarcinoma of the human pancreas. A study of 82 carcinomas using a combination of mutant-enriched polymerase chain reaction analysis and allele-specific oligonucleotide hybridization. Am J Pathol. 1993;143:545–54. [PMC free article] [PubMed] [Google Scholar]
- 4.Smit VT, Boot AJ, Smits AM, Fleuren GJ, Cornelisse CJ, Bos JL. KRAS codon 12 mutations occur very frequently in pancreatic adenocarcinomas. Nucleic Acids Res. 1988;16:7773–82. doi: 10.1093/nar/16.16.7773. [DOI] [PMC free article] [PubMed] [Google Scholar]
- 5.Tada M, Omata M, Ohto M. Clinical application of ras gene mutation for diagnosis of pancreatic adenocarcinoma. Gastroenterology. 1991;100:233–8. doi: 10.1016/0016-5085(91)90606-l. [DOI] [PubMed] [Google Scholar]
- 6.Andersen SN, Lovig T, Breivik J, Lund E, Gaudernack G, Meling GI, Rognum TO. K-ras mutations and prognosis in large-bowel carcinomas. Scand J Gastroenterol. 1997;32:62–9. doi: 10.3109/00365529709025065. [DOI] [PubMed] [Google Scholar]
- 7.Chiang JM. Role of K-ras mutations in colorectal carcinoma. Cancer Lett. 1998;126:179–85. doi: 10.1016/s0304-3835(98)00008-1. [DOI] [PubMed] [Google Scholar]
- 8.Rothschild CB, Brewer CS, Loggie B, Beard GA, Triscott MX. Detection of colorectal cancer K-ras mutations using a simplified oligonucleotide ligation assay. J Immunol Methods. 1997;206:11–9. doi: 10.1016/s0022-1759(97)00078-1. [DOI] [PubMed] [Google Scholar]
- 9.Breivik J, Meling GI, Spurkland A, Rognum TO, Gaudernack G. K-ras mutation in colorectal cancer: relations to patient age, sex and tumour location. Br J Cancer. 1994;69:367–71. doi: 10.1038/bjc.1994.67. [DOI] [PMC free article] [PubMed] [Google Scholar]
- 10.Capella G, Cronauer-Mitra S, Pienado MA, Perucho M. Frequency and spectrum of mutations at codons 12 and 13 of the c-K-ras gene in human tumors. Environ Health Perspect. 1991;93:125–31. doi: 10.1289/ehp.9193125. [DOI] [PMC free article] [PubMed] [Google Scholar]
- 11.Finkelstein SD, Sayegh R, Bakker A, Swalsky P. Determination of tumor aggressiveness in colorectal cancer by K-ras-2 analysis. Arch Surg. 1993;128:526–31. doi: 10.1001/archsurg.1993.01420170056008. discussion 531–2. [DOI] [PubMed] [Google Scholar]
- 12.Forrester K, Almoguera C, Han K, Grizzle WE, Perucho M. Detection of high incidence of K-ras oncogenes during human colon tumorigenesis. Nature. 1987;327:298–303. doi: 10.1038/327298a0. [DOI] [PubMed] [Google Scholar]
- 13.Losi L, Benhattar J, Costa J. Stability of K-ras mutations throughout the natural history of human colorectal cancer. Eur J Cancer. 1992;28A:1115–20. doi: 10.1016/0959-8049(92)90468-h. [DOI] [PubMed] [Google Scholar]
- 14.Smith AJ, Stern HS, Penner M, Hay K, Mitri A, Bapat BV, Gallinger S. Somatic APC and K-ras codon 12 mutations in aberrant crypt foci from human colons. Cancer Res. 1994;54:5527–30. [PubMed] [Google Scholar]
- 15.Martinez-Garza SG, Nunez-Salazar A, Calderon-Garciduenas AL, Bosques-Padilla FJ, Niderhauser-Garcia A, Barrera-Saldana HA. Frequency and clinicopathology associations of K-ras mutations in colorectal cancer in a northeast Mexican population. Dig Dis. 1999;17:225–9. doi: 10.1159/000016940. [DOI] [PubMed] [Google Scholar]
- 16.Urosevic N, Krtolica K, Skaro-Milic A, Knezevic-Usaj S, Dujic A. Prevalence of G-to-T transversions among K-ras oncogene mutations in human colorectal tumors in Yugoslavia. Int J Cancer. 1993;54:249–54. doi: 10.1002/ijc.2910540215. [DOI] [PubMed] [Google Scholar]
- 17.Crespo P, Leon J. Ras proteins in the control of the cell cycle and cell differentiation. Cell Mol Life Sci. 2000;57:1613–36. doi: 10.1007/PL00000645. [DOI] [PMC free article] [PubMed] [Google Scholar]
- 18.Bos JL. ras oncogenes in human cancer: a review. Cancer Res. 1989;49:4682–9. [PubMed] [Google Scholar]
- 19.McKinzie PB, Parsons BL. Detection of rare K-ras codon 12 mutations using allele-specific competitive blocker PCR. Mutat Res. 2002;517:209–20. doi: 10.1016/s1383-5718(02)00077-3. [DOI] [PubMed] [Google Scholar]
- 20.Schuermann M. Detection of K-ras and p53 mutations by “mutant-enriched” PCR-RFLP. Methods Mol Med. 2003;75:325–33. doi: 10.1385/1-59259-324-0:325. [DOI] [PubMed] [Google Scholar]
- 21.Jiang W, Kahn SM, Guillem JG, Lu SH, Weinstein IB. Rapid detection of ras oncogenes in human tumors: applications to colon, esophageal, and gastric cancer. Oncogene. 1989;4:923–8. [PubMed] [Google Scholar]
- 22.Levi S, Urbano-Ispizua A, Gill R, Thomas DM, Gilbertson J, Foster C, Marshall CJ. Multiple K-ras codon 12 mutations in cholangiocarcinomas demonstrated with a sensitive polymerase chain reaction technique. Cancer Res. 1991;51:3497–502. [PubMed] [Google Scholar]
- 23.Theodor L, Melzer E, Sologov M, Idelman G, Friedman E, Bar-Meir S. Detection of pancreatic carcinoma: diagnostic value of K-ras mutations in circulating DNA from serum. Dig Dis Sci. 1999;44:2014–9. doi: 10.1023/a:1026618317716. [DOI] [PubMed] [Google Scholar]
- 24.Barany F. Genetic disease detection and DNA amplification using cloned thermostable ligase. Proc Natl Acad Sci U S A. 1991;88:189–93. doi: 10.1073/pnas.88.1.189. [DOI] [PMC free article] [PubMed] [Google Scholar]
- 25.Khanna M, Park P, Zirvi M, Cao W, Picon A, Day J, Paty P, Barany F. Multiplex PCR/LDR for detection of K-ras mutations in primary colon tumors. Oncogene. 1999;18:27–38. doi: 10.1038/sj.onc.1202291. [DOI] [PubMed] [Google Scholar]
- 26.Hashimoto M, Barany F, Xu F, Soper SA. Serial processing of biological reactions using flow-through microfluidic devices: coupled PCR/LDR for the detection of low-abundant DNA point mutations. Analyst. 2007;132:913–21. doi: 10.1039/b700071e. [DOI] [PubMed] [Google Scholar]
- 27.Hashimoto M, Barany F, Soper SA. Polymerase chain reaction/ligase detection reaction/hybridization assays using flow-through microfluidic devices for the detection of low-abundant DNA point mutations. Biosens Bioelectron. 2006;21:1915–23. doi: 10.1016/j.bios.2006.01.014. [DOI] [PubMed] [Google Scholar]
- 28.Hashimoto M, Hupert ML, Murphy MC, Soper SA, Cheng YW, Barany F. Ligase detection reaction/hybridization assays using three-dimensional microfluidic networks for the detection of low-abundant DNA point mutations. Anal Chem. 2005;77:3243–55. doi: 10.1021/ac048184d. [DOI] [PubMed] [Google Scholar]
- 29.McNamara DT, Thomson JM, Kasehagen LJ, Zimmerman PA. Development of a multiplex PCR-ligase detection reaction assay for diagnosis of infection by the four parasite species causing malaria in humans. J Clin Microbiol. 2004;42:2403–10. doi: 10.1128/JCM.42.6.2403-2410.2004. [DOI] [PMC free article] [PubMed] [Google Scholar]
- 30.Sinville R, Coyne J, Meagher RJ, Cheng YW, Barany F, Barron A, Soper SA. Ligase detection reaction for the analysis of point mutations using free-solution conjugate electrophoresis in a polymer microfluidic device. Electrophoresis. 2008;29:4751–60. doi: 10.1002/elps.200800197. [DOI] [PMC free article] [PubMed] [Google Scholar]
- 31.Gerry NP, Witowski NE, Day J, Hammer RP, Barany G, Barany F. Universal DNA microarray method for multiplex detection of low abundance point mutations. J Mol Biol. 1999;292:251–62. doi: 10.1006/jmbi.1999.3063. [DOI] [PubMed] [Google Scholar]
- 32.Diehl F, Beckmann B, Kellner N, Hauser NC, Diehl S, Hoheisel JD. Manufacturing DNA microarrays from unpurified PCR products. Nucleic Acids Res. 2002;30:e79. doi: 10.1093/nar/gnf078. [DOI] [PMC free article] [PubMed] [Google Scholar]
- 33.Zhang C, Xing D. Miniaturized PCR chips for nucleic acid amplification and analysis: latest advances and future trends. Nucleic Acids Res. 2007;35:4223–37. doi: 10.1093/nar/gkm389. [DOI] [PMC free article] [PubMed] [Google Scholar]
- 34.Park DS, Hupert ML, Witek MA, You BH, Datta P, Guy J, Lee JB, Soper SA, Nikitopoulos DE, Murphy MC. A titer plate-based polymer microfluidic platform for high throughput nucleic acid purification. Biomed Microdevices. 2008;10:21–33. doi: 10.1007/s10544-007-9106-y. [DOI] [PubMed] [Google Scholar]
- 35.Berger J, Suzuki T, Senti KA, Stubbs J, Schaffner G, Dickson BJ. Genetic mapping with SNP markers in Drosophila. Nat Genet. 2001;29:475–81. doi: 10.1038/ng773. [DOI] [PubMed] [Google Scholar]
- 36.Caldwell KS, Dvorak J, Lagudah ES, Akhunov E, Luo MC, Wolters P, Powell W. Sequence polymorphism in polyploid wheat and their d-genome diploid ancestor. Genetics. 2004;167:941–7. doi: 10.1534/genetics.103.016303. [DOI] [PMC free article] [PubMed] [Google Scholar]
- 37.Dugan KA, Lawrence HS, Hares DR, Fisher CL, Budowle B. An improved method for post-PCR purification for mtDNA sequence analysis. J Forensic Sci. 2002;47:811–8. [PubMed] [Google Scholar]
- 38.Eckhardt F, Lewin J, Cortese R, Rakyan VK, Attwood J, Burger M, Burton J, Cox TV, Davies R, Down TA, Haefliger C, Horton R, Howe K, Jackson DK, Kunde J, Koenig C, Liddle J, Niblett D, Otto T, Pettett R, Seemann S, Thompson C, West T, Rogers J, Olek A, Berlin K, Beck S. DNA methylation profiling of human chromosomes 6, 20 and 22. Nat Genet. 2006;38:1378–85. doi: 10.1038/ng1909. [DOI] [PMC free article] [PubMed] [Google Scholar]
- 39.Mu J, Duan J, Makova KD, Joy DA, Huynh CQ, Branch OH, Li WH, Su XZ. Chromosome-wide SNPs reveal an ancient origin for Plasmodium falciparum. Nature. 2002;418:323–6. doi: 10.1038/nature00836. [DOI] [PubMed] [Google Scholar]
- 40.Watanabe Y, Kinoshita A, Yamada T, Ohta T, Kishino T, Matsumoto N, Ishikawa M, Niikawa N, Yoshiura K. A catalog of 106 single-nucleotide polymorphisms (SNPs) and 11 other types of variations in genes for transforming growth factor-beta1 (TGF-beta1) and its signaling pathway. J Hum Genet. 2002;47:478–83. doi: 10.1007/s100380200069. [DOI] [PubMed] [Google Scholar]
- 41.Kibbe WA. OligoCalc: an online oligonucleotide properties calculator. Nucleic Acids Res. 2007;35:W43–6. doi: 10.1093/nar/gkm234. [DOI] [PMC free article] [PubMed] [Google Scholar]
- 42.Sanger F, Coulson AR. A rapid method for determining sequences in DNA by primed synthesis with DNA polymerase. J Mol Biol. 1975;94:441–8. doi: 10.1016/0022-2836(75)90213-2. [DOI] [PubMed] [Google Scholar]
- 43.Chen PC, Nikitopoulos DE, Soper SA, Murphy MC. Temperature distribution effects on micro-CFPCR performance. Biomed Microdevices. 2008;10:141–52. doi: 10.1007/s10544-007-9119-6. [DOI] [PubMed] [Google Scholar]
- 44.Whitney DE. Mechanical Assemblies - Their Design, Manufacture, and Role in Product Development. Oxford University Press; [Google Scholar]
- 45.Maha A, Palaparthy V, Soper SA, Murphy MC, Nikitopoulos DE. Optimized High-Aspect-Ratio Diffusional Micromixers. ASME Conference Proceedings; 2008; 2008. pp. 645–646. [Google Scholar]
- 46.Nikitopoulos DE, Maha A. In: Chapter 7:Micromixers in Bio-MEMS: Technologies and Applications. Wang W, Soper SA, editors. Taylor & Frances Group; 2007. [Google Scholar]
- 47.Heule M, Manz A. Sequential DNA hybridisation assays by fast micromixing. Lab Chip. 2004;4:506–11. doi: 10.1039/b404633a. [DOI] [PubMed] [Google Scholar]
- 48.Squires TM, Quake SR. Microfluidics: Fluid physics at the nanoliter scale. Reviews of Modern Physics. 2005;77:977. [Google Scholar]
- 49.Bessoth FG, deMello AJ, Manz A. Microstructure for efficient continuous flow mixing. Analytical Communication. 1999;36:213–15. [Google Scholar]
- 50.Lee TY. PhD dissertation. Louisiana State University; 2009. A Multi-Function, Disposable, Microfluidic Module for Mutation Detection. [Google Scholar]
- 51.Thomas G, Sinville R, Sutton S, Farquar H, Hammer RP, Soper SA, Cheng YW, Barany F. Capillary and microelectrophoretic separations of ligase detection reaction products produced from low-abundant point mutations in genomic DNA. Electrophoresis. 2004;25:1668–77. doi: 10.1002/elps.200405886. [DOI] [PubMed] [Google Scholar]
- 52.Wang Y, Vaidya B, Farquar HD, Stryjewski W, Hammer RP, McCarley RL, Soper SA, Cheng YW, Barany F. Microarrays assembled in microfluidic chips fabricated from poly(methyl methacrylate) for the detection of low-abundant DNA mutations. Anal Chem. 2003;75:1130–40. doi: 10.1021/ac020683w. [DOI] [PubMed] [Google Scholar]
- 53.Holland PM, Abramson RD, Watson R, Gelfand DH. Detection of specific polymerase chain reaction product by utilizing the 5′----3′ exonuclease activity of Thermus aquaticus DNA polymerase. Proc Natl Acad Sci U S A. 1991;88:7276–80. doi: 10.1073/pnas.88.16.7276. [DOI] [PMC free article] [PubMed] [Google Scholar]
- 54.Kin T, Ono Y. Idiographica: a general-purpose web application to build idiograms on-demand for human, mouse and rat. Bioinformatics. 2007;23:2945–6. doi: 10.1093/bioinformatics/btm455. [DOI] [PubMed] [Google Scholar]
Associated Data
This section collects any data citations, data availability statements, or supplementary materials included in this article.
Supplementary Materials
All of these products are generated by unpurified post-PCR mixtures that contain Taq DNA polymerase, dNTPs, and PCR primers present during the LDR phase of the assay, which can potentially interfere with the LDR process. (A) Remaining forward and reverse primers (blue and red arrows, respectively) anneal to the PCR products and new strands are extended by the DNA polymerase before the annealing of discriminating and common primers used for the LDR. (B) Discriminating primers anneal to the PCR products and a new fragment is produced by extension of these primers by the DNA polymerase. (C) The DNA fragment(s) generated by (B) provide a new template for reverse primers and thus, new DNA fragments are created. (D) Small amounts of erroneous products were detected by DHPLC analysis.
A karyotype image of human chromosome 12 was created using the idiographica webtool [54]. Blue and red arrows represent forward and reverse primers, respectively. The vertical red line indicates the position of the K-ras point mutation. An agarose gel electropherogram is shown on the right showing the PCR products that were generated. The DNA templates used in each PCR reaction are shown on the top of the gel images. Three discriminating primers for the LDR assay are represented by yellow-, blue-, and green-black lines.