

Abstract
In many organisms the allocation of primordial germ cells (PGCs) is determined by the inheritance of maternal factors deposited in the egg. However, in mammals, inductive cell interactions are required around gastrulation to establish the germ line. Here, we show that Bmp4 homozygous null embryos contain no PGCs. They also lack an allantois, an extraembryonic mesodermal tissue derived, like the PGCs, from precursors in the proximal epiblast. Heterozygotes have fewer PGCs than normal, due to a reduction in the size of the founding population and not to an effect on its subsequent expansion. Analysis of β-galactosidase activity in Bmp4lacZneo embryos reveals that prior to gastrulation, Bmp4 is expressed in the extraembryonic ectoderm. Later, Bmp4 is expressed in the extraembryonic mesoderm, but not in PGCs. Chimera analysis indicates that it is the Bmp4 expression in the extraembryonic ectoderm that regulates the formation of allantois and primordial germ cell precursors, and the size of the founding population of PGCs. The initiation of the germ line in the mouse therefore depends on a secreted signal from the previously segregated, extraembryonic, trophectoderm lineage.
Keywords: Primordial germ cells, allantois, mouse embryo, Bmp4, extraembryonic ectoderm, chimera
Before gastrulation, the mouse embryo consists of three distinct cell lineages which were established in the blastocyst during the peri-implantation period, that is, epiblast, extraembryonic endoderm, and trophectoderm. The epiblast, from which the entire fetus will form, as well as the extraembryonic mesoderm and amnion ectoderm, is a cup-shaped epithelium apposed on its open end to the extraembryonic ectoderm, a trophectoderm derivative. Both epiblast and extraembryonic ectoderm are covered by visceral endoderm, which is part of the extraembryonic endoderm lineage (Hogan et al. 1994).
The primordial germ cells (PGCs) of the mouse embryo are derived from part of the population of epiblast cells that will give rise mainly to the extraembryonic mesoderm. Precursors of the PGCs are located before gastrulation in the extreme proximal region of the epiblast adjacent to the extraembryonic ectoderm, and have descendants not only in the germ line, but also in extraembryonic structures, that is, the allantois, blood islands, and yolk sac mesoderm, as well as both layers of the amnion. At embryonic day (E) 6.0, these precursors lie scattered in a ring that extends up to three cell diameters from the junction with the extraembryonic ectoderm (Lawson and Hage 1994). Early in gastrulation, they converge toward the primitive streak in the posterior of the embryo and translocate through it. Allocation to the germ cell lineage is thought to occur in ∼45 cells around E7.2, after the precursors have passed through the streak and have come to reside in the extraembryonic mesoderm (Lawson and Hage 1994). This is about the time when the putative PGCs can first be identified morphologically in a cluster posterior to the primitive streak in a position that will later become the base of the allantois (Ginsburg et al. 1990). PGCs stain strongly in a characteristic pattern for alkaline phosphatase (AP) activity (Chiquoine 1954), which by this stage is due to tissue nonspecific AP (Hahnel et al. 1990; MacGregor et al. 1995). The PGCs continue to express AP during their proliferation in the developing hindgut and migration into the genital ridges (for review, see Buehr 1997).
Transplantation studies have shown that genetically marked distal epiblast cells from pre- and early-primitive streak-stage embryos, which would normally contribute to neuroectoderm and never to the PGCs, can give rise to PGCs and extraembryonic mesoderm when grafted to the proximal epiblast (Tam and Zhou 1996). These results raise the possibility that PGC precursors are induced by extracellular factors and/or cell interactions present locally at the junction between the extraembryonic ectoderm and epiblast.
Candidate genes encoding putative germ cell precursor inducing factors are predicted to be expressed in the mouse embryo before and during gastrulation. One such factor is Bone Morphogenetic Protein 4 (Bmp4), a member of the TGFβ superfamily of intercellular signaling proteins (Hogan 1996; Waldrip et al. 1998). Most mouse embryos homozygous for a null mutation in Bmp4 die around gastrulation (∼E6.5) (Winnier et al. 1995). On some genetic backgrounds, however, a proportion of the mutant embryos survive until the early somite stage and show severe defects, particularly in the extraembryonic mesoderm (Winnier et al. 1995). In this paper, we exploit this late phenotype to show that PGC formation absolutely requires Bmp4 signaling. In addition, the size of the founding population of PGCs is significantly reduced in heterozygous mutant embryos. By using a Bmp4–lacZ reporter allele, we have definitively localized Bmp4 expression before gastrulation in the extraembryonic ectoderm and in mid- to late- primitive streak stage embryos in the extraembryonic mesoderm. Thus, Bmp4 is expressed at the right time and in the right place to play a role both in the quantitative induction of PGC precursors in the proximal epiblast and in their allocation to the germ cell lineage in the extraembryonic mesoderm. Furthermore, by analyzing genetic chimeras, we have clearly established a role for Bmp4 in the induction of PGC precursors and demonstrate for the first time that a secreted signal from the extraembryonic ectoderm is required for the normal development of the epiblast.
Results
Phenotypic abnormalities in Bmp4tm1 homozygous null mutants
On both the (129/SvEv × Black Swiss) and (C57BL/6 × CBA) genetic backgrounds, many Bmp4tm1 homozygous embryos develop up to and beyond the early somite stage. An example of a 20 somite (S) stage homozygous embryo is shown in Figure 1B. Among the late surviving homozygous mutants, several consistent abnormalities are observed. First, they are developmentally delayed in comparison to their wild-type and heterozygous littermates (Fig. 1A,B). Significantly for this study, all completely lack an allantois (Fig. 1B,D), and many show severe posterior defects, including disorganized posterior ectoderm (Fig. 1G,H), overgrowth and endothelialization of the somatopleure (Fig. 1, cf. E with F and G), with extension of endothelial cells into the amnion in the most severe mutant phenotypes (Fig. 1H), and small and poorly vascularized yolk sacs.
Figure 1.
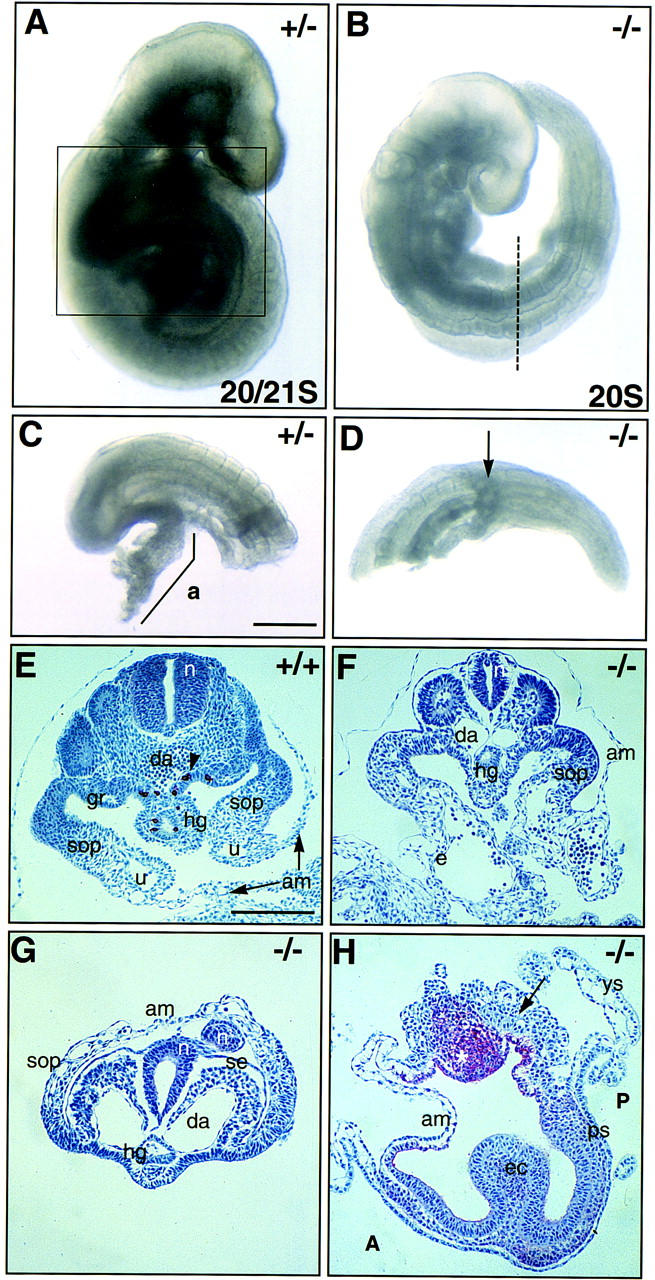
Phenotypes of advanced Bmp4tm1 (129/SvEv × Black Swiss) mutant embryos. (A) Bmp4tm1/+ embryo at the early forelimb bud stage showing wild-type morphology. (B) Bmp4tm1/Bmp4tm1, littermate of A showing delayed development, incomplete turning, irregular somites and kinked neural tube, uncharacteristic looping of the tail to the left, and absence of allantois. (C) Posterior of embryo in A (boxed region) with allantois (a). (D) No allantois in homozygous mutant (arrow). The broken line in B marks the level of dissection for D. (E–H) Sections of wild-type and homozygous null Bmp4tm1 (129/SvEv × Black Swiss) embryos showing posterior phenotype. AP and haemalum staining. (E) Wild type. Transverse section (TS) of posterior region of an E9.5 embryo with 27 somites. The umbilical vein (u) demarcates the junction between somatopleure (sop) and amnion (am). PGCs (arrowhead) are migrating from the hindgut (hg) into the genital ridges (gr). (F) TS of the posterior region of a −/− sibling to the embryo in E. This embryo had 23 somites and an external morphology similar to the embryo in B. There was no external allantois, but the region between the amnion and the somatopleure was heavily endothelialized (e). (G) TS of the posterior region of another E9.5 −/− sibling with 14 somites and more severe posterior defects. The endothelialized somatopleure has reflected dorsally, forming a posterior pocket that becomes continuous with the amnion. A dorsal extension (n′) of the caudally disorganized neurectoderm (n) surrounded by surface ectoderm (se) is contained within the pocket. (H) Sagittal section of an E8.5 −/− embryo showing a severe mutant phenotype. The embryonic portion contains convoluted ectoderm (ec) and limited mesoderm extending rostrally from the primitive streak (ps). The amnion is normal rostrally, but is filled caudally with mesoderm (arrow), which is continuous with the primitive streak. In addition, there is an accumulation of AP-positive amnion ectoderm (*). (A) Anterior; (da) dorsal aorta; (n) neural tube; (P) posterior; (ys) visceral yolk sac. Scale bars in C for A–D, 200 μm; in E for E–H, 200 μm.
The absence of an allantois in all homozygous null Bmp4 mutants strongly suggested that they would also have a deficiency of PGCs, because the precursors of the two cell types reside in similar positions in the proximal epiblast before gastrulation. Embryos of different stages were therefore assayed for the presence of PGCs by AP staining.
Dosage effect of Bmp4tm1 on PGC number
Comparison of littermates of Bmp4tm1/+ intercrosses between E7.2 and E7.75 showed firstly that homozygous null mutants contained no PGCs [12 embryos from 7 (C57BL/6 × CBA) matings], and secondly that the incidence of heterozygous embryos with recognizable PGCs lagged behind that of the wild type until after the headfold stage on both the (C57BL/6 × CBA) and (129/SvEv × Black Swiss) backgrounds (Fig. 2). More detailed quantitative analysis at E7.5 is not informative because PGCs are still emerging from the cluster of AP-positive cells (Ginsburg et al. 1990), and the population is not yet expanding exponentially (Lawson and Hage 1994).
Figure 2.

Incidence of wild-type and heterozygous embryos with recognizable PGCs at E7.2–E7.75 from Bmp4tm1/+ (C57BL/6 × CBA) intercrosses (7 females, 40 embryos) and ICR × Bmp4lacZneo/+ matings (4 females, 38 embryos) examined in whole mount. (Open columns) Wild type; (hatched columns) heterozygotes; sample size in parentheses. The same trend was found in both groups (not shown): The pooled data show that the proportion of embryos with PGCs was smaller in the heterozygotes in combined stages up to, and including, the headfold (HF) stage (χ2 test: P < 0.05). (ES/MS) Early streak/midstreak; (LS) late streak; (NP) neural plate; (HF) headfold; (S) somite.
The whole-mount AP staining technique described here allows the quantitation of PGCs in situ in the embryo at more advanced stages. For example, as shown in Figure 3, PGCs are clearly present in the hindgut of wild-type and heterozygous embryos (Fig. 3A–C; see also Fig. 1E), but are completely absent from the homozygous mutants (Fig. 3D; see also Fig. 1F–H). This absence was true for both genetic backgrounds (C57BL/6 × CBA: 29 homozygous mutant embryos from 23 females; 129/SvEv × Black Swiss: 8 homozygous mutant embryos from 5 females) and at all stages examined. The most advanced mutant (C57BL/6 × CBA) embryo at E9.5 had 17 somites, and one (129/SvEv × Black Swiss) embryo was fully turned with 23 somites.
Figure 3.
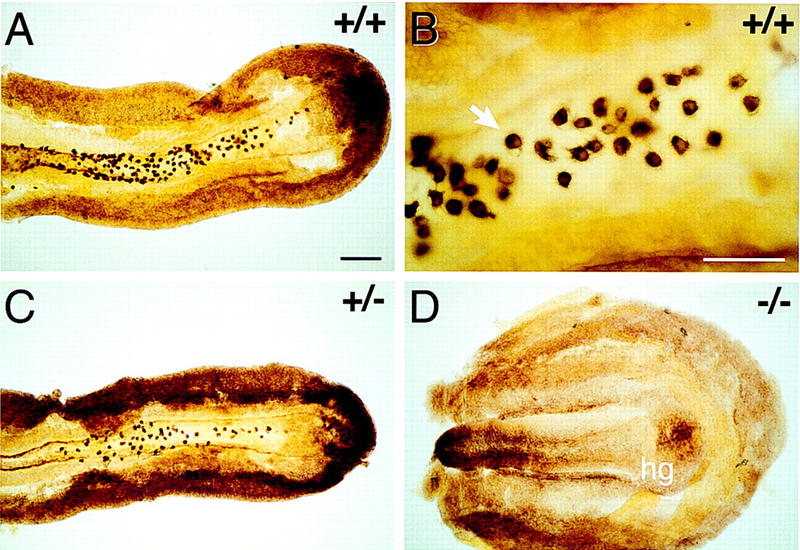
PGCs in posterior (hindgut) pieces from E8.5 sibling embryos from a Bmp4tm1/+ (C57BL/6 × CBA) intercross mating. Alkaline phosphatase staining, dorsal view. (A) Wild type, 15S embryo. (B) High power of part of A showing individual PGCs (arrow) in the hindgut. (C) Heterozygote, 15S embryo. There are fewer PGCs compared with the wild-type sibling in A. (D) Homozygous null, 8S embryo. Although a hindgut is present (hg), PGCs are entirely absent. Scale bars in A for A, C, and D, 200 μm; in B, 100 μm. (+/+) Wild type; (+/−) heterozygote; (−/−) homozygous null.
Heterozygous embryos, although indistinguishable from their wild-type littermates in terms of overall size and morphological features, including the allantois, had reduced numbers of PGCs on both genetic backgrounds (Fig. 3, cf. A with C; for the one exception concerning the allantois, see footnote to Fig. 4). In addition, PGCs were absent in 9% of the heterozygous (C57BL/6 × CBA) embryos (Fig. 4A). Although the heterozygous embryos had fewer PGCs, the regional distribution of PGCs in heterozygous and wild-type littermates did not differ, with PGCs spreading from the ventral hindgut through the dorsal mesentery and into the genital ridges by E9.5.
Figure 4.


Linear regression analysis of PGC number (counted in whole mount) vs. somite number in embryos from Bmp4tm1/+ intercrosses. (A) Bmp4tm1 (C57BL/6 × CBA). (B) Bmp4lacZneo (129/SvEv × Black Swiss). (○, broken line) Wild type; (●, solid line) heterozygote; (▵) homozygous null. The values in the regression equation, Y = a + bX, for log PGC (Y) on somite (X) number at the mean values of X and Y with each set of data were in A, wild type, 2.124 = 1.684 + 0.0286 (15.4); heterozygote (PGC values >0), 1.647 = 1.268 + 0.0275 (13.8); B, wild type, 2.305 = 1.878 + 0.0288 (14.8); heterozygote, 2.089 = 1.541 + 0.0298 (18.4). Identification of genotype in B was by β-gal staining and phenotype. In A, the 25/26S heterozygote with 23 PGCs resembled an advanced homozygous null embryo (as in Fig. 1B) and completely lacked an allantois.
To determine at which stage the difference in the size of the PGC population arose, PGC number estimated on whole mounts was plotted against somite number. The regression line of log PGC number on somite number fitted to all values greater than zero for the heterozygotes was parallel to that for the wild type, but had reduced elevation (P < 0.001) (Fig. 4A,B). The parallel regression lines indicate that the rate of expansion of the PGC population is the same in wild-type and heterozygous embryos. Assuming an average of one somite pair formed every 90 min (Tam 1981), the slope gives a population doubling time of 15.8 hr, which is consistent with previous data (Tam and Snow 1981; Lawson and Hage 1994). In contrast, the difference in elevation of the two regression lines suggests that the size of the founding population of PGCs is smaller in the heterozygotes. Wild-type embryos on the (C57BL/6 × CBA) background have a mean founding population of 45 (Lawson and Hage 1994); extrapolation of the regression line for the wild type to this value, and comparison with that for the heterozygotes at the same stage, gives a mean PGC founding population in the heterozygotes of 17 (a 62% reduction). The slopes of the regression lines of PGCs numbers on the (129/SvEv × Black Swiss) (Fig. 4B) and (C57BL/6 × CBA) backgrounds were indistinguishable. However, the elevation of the lines for both wild type and heterozygotes was higher in the (129/SvEv × Black Swiss) embryos compared with their (C57BL/6 × CBA) counterparts (P < 0.001). This is consistent with a mean founding population of 66 in the wild type and 30 in the heterozygote (129/SvEv × Black Swiss) (a 55% reduction).
The extrapolation of the regression line of the wild type (C57BL/6 × CBA) in Figure 4A reaches the expected founding population size of 45 at −1.2S, instead of the expected allocation time equivalent to approximately −8S (12 hr before the 0S stage). This discrepancy suggests that PGC number is consistently underestimated in whole mounts, but it does not affect the relative difference in PGC number between wild type and heterozygotes, nor the inference that the size of the founding population is reduced by >50% in the heterozygotes. If the lower number of PGCs in the heterozygotes were due solely to a delay in PGC allocation or to delayed onset of PGC proliferation, rather than to a smaller founding population, the length of the delay implied by the difference in elevation of the regression lines would be 22 hr (14.7 somite equivalents). The data do not support this interpretation. An alternative possibility, which cannot be distinguished from a direct effect on the number of cells allocated, is that more than half of the PGC founders in the heterozygotes die before the first division after allocation.
In summary, whereas one active allele of Bmp4 is sufficient for normal maintenance, proliferation, and the initiation of migration of the PGCs, the size of the founding population, which is normally allocated at about E7.2 at the late midstreak/late streak stage, is Bmp4 dosage dependent.
Temporal and spatial pattern of Bmp4 expression during early mouse development
Because Bmp4 is clearly important for PGC formation, it is essential to know its precise temporal and spatial expression before and after gastrulation. To detect Bmp4 expression at this time with high sensitivity and single cell resolution, we used homologous recombination in ES cells to replace the first protein coding exon of the Bmp4 gene with a reporter cassette encoding β-galactosidase (β-gal) with an amino-terminal nuclear localization signal (Fig. 5). Embryos homozygous for the Bmp4lacZneo mutation on the (129/SvEv × Black Swiss) background have the same phenotype as Bmp4tm1 homozygotes (Fig. 6M,N). Moreover, removing the neo cassette has no effect on lacZ expression or mutant phenotype (data not shown).
Figure 5.

Targeted replacement of the Bmp4 gene with a lacZ reporter cassette. (A) Genomic organization of the wild-type and mutated alleles and the structure of the targeting vector. Coding and noncoding exons are represented by solid and shaded rectangles, respectively. The Bmp4lacZneo targeting vector contains 1.6 kb of 5′ homology. The 6.1-kb 3′ homology arm includes the oligonucleotide-interrupted coding exon 4 (open rectangle) from the Bmp4tm1blh targeting vector (Winnier et al. 1995) and is flanked by the herpes virus thymidine kinase cassette (HSV-tk) for negative selection (Soriano et al. 1991). Coding exon three is replaced with both lacZ and neor resistance cassettes; the arrow indicates the direction of neor transcription. loxP sites (▸) flank the neor cassette. The correctly recombined locus produces a fusion transcript between noncoding Bmp4 sequences and lacZ without disrupting the structure of neighboring introns. The 500-bp BamHI–BsmI fragment used as an external 5′ probe is shown above the wild-type Bmp4 locus. In the 12C targeted ES cell line, recombination occurred in the intron between exons 3 and 4, as determined by the PCR strategy described in Winnier et al. (1995). (B) Southern blot analysis of progeny from a representative backcross of the Bmp4lacZneo allele. By use of the 5′ external probe and SpeI digestion, the wild-type and targeted loci generate 6.3 and 11.1 hybridizing bands, respectively. (B) BamHI; (Bs) BsmI; (C) ClaI; (E) EcoRI; (H) HindIII; (N) NotI; (P) PstI; (Sf) SfiI; (Sm) SmaI; (Sp) SpeI; (X) XbaI. (+/+) Wild type; (+/−) heterozygote.
Figure 6.
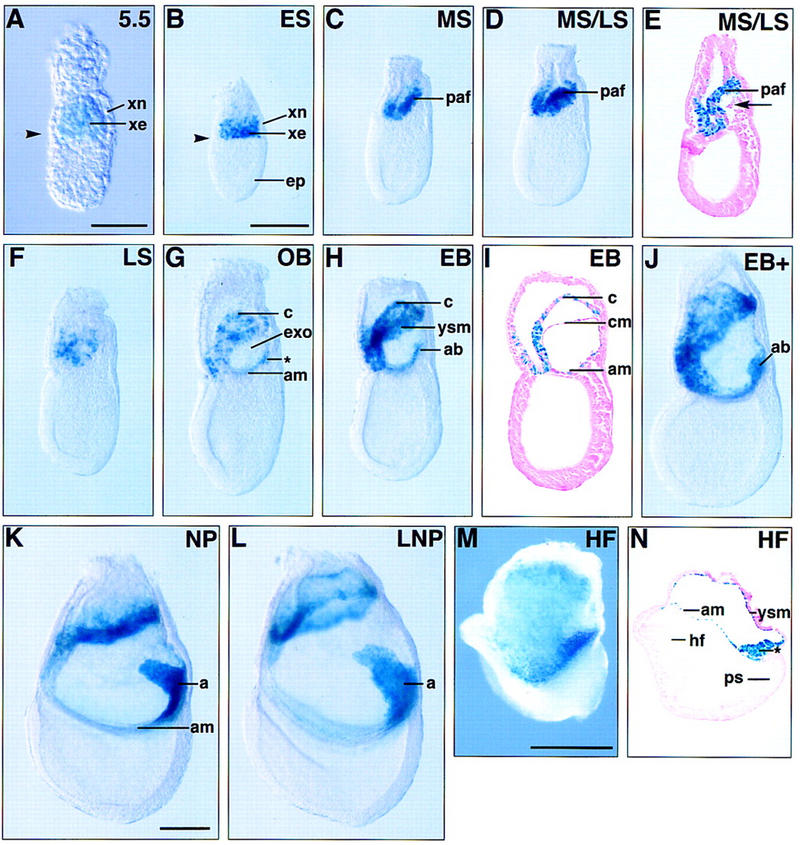
Bmp4lacZneo expression in the early mouse embryo. (A) An E5.5 embryo viewed under Nomarski optics. Low levels of β-gal activity are first detected throughout the uncavitated extraembryonic ectoderm (xe). (Arrowhead) Junction between embryonic and extraembryonic regions. (B) At the onset of gastrulation (early streak, ES), Bmp4lacZneo expression continues in the extraembryonic ectoderm, in a ring that abuts the epiblast (ep). (C,D) As gastrulation proceeds, Bmp4lacZneo expression within the extraembryonic ectoderm persists and is particularly evident between the mid-streak (MS) to late-streak (LS) stages within the posterior amniotic fold (paf). (E) Sagittal section through a MS/LS embryo. Low levels of β-gal activity within the extraembryonic mesoderm (arrow) are first detected at this stage, as the exocoelom (exo) begins to form. (F) Late-streak (LS) stage embryo. (G–L) Bmp4 expression during allantois development. lacZ expression is detected in the posterior accumulation of extraembryonic mesoderm that precedes overt allantois formation (asterisk in G) and within the allantoic bud (ab) and allantois (a) as it extends through the exocoelomic cavity. Expression also persists in the extraembryonic mesodermal components of the amnion (am), yolk sac (ysm), and chorion (cm) that line the exocoelom. (M,N) Bmp4lacZneo homozygous null embryo at the headfold (HF) stage. (M) Whole mount, lateral view. (N) Parasagittal section of M. Strong β-gal activity is detected in the amnion and yolk sac mesoderm, as well as in the accumulation of extraembryonic mesoderm (*) posterior to the primitive streak (ps). Anterior (A) is to the left in B–N. (c) Chorion; (xn) extraembryonic endoderm; (ES) early streak; (OB) no bud; (EB) early bud; (NP) neural plate; (LNP) late neural plate. Scale bars in A, 100 μm; in B for B–J, 200 μm; in K for K and L, 100 μm; in M for M and N, 200 μm.
To determine the onset of Bmp4 expression in vivo, Bmp4lacZneo heterozygous embryos were analyzed for β-gal activity from E3.5 onwards. Positive cells could not be detected in intact blastocysts or in E4.5 embryos even after prolonged staining (data not shown). At E5.5, low levels of Bmp4lacZneo expression are first detected throughout the uncavitated extraembryonic ectoderm, including those cells that abut the epiblast (Fig. 6A). By ∼E6.0, just prior to overt streak formation, the highest levels of lacZ expression become localized to the region of the extraembryonic ectoderm immediately adjacent to the epiblast (Fig. 6B; see also Waldrip et al. 1998). As gastrulation begins, these β-gal-positive extraembryonic cells are displaced proximally by the encroaching extraembryonic mesoderm and subsequently contribute to the chorion (Fig. 6C–F). Bmp4lacZneo expression is detected in newly formed extraembryonic mesoderm at the midstreak stage, as the exocoelom begins to form (Fig. 6E). It is then expressed with increasing intensity in the allantois and mesodermal components of the developing amnion, chorion, and visceral yolk sac (Fig. 6G–L). No expression is seen in the primitive streak at this time. Double staining for β-gal and AP activity shows that Bmp4 is expressed in cells in the vicinity of the PGCs, but is clearly excluded from them (Fig. 7A,C,D). The area posterior to the streak at the base of the initiating allantoic bud in which PGCs can be first identified is consistently larger in wild-type embryos than in heterozygotes (Fig. 7A,B).
Figure 7.
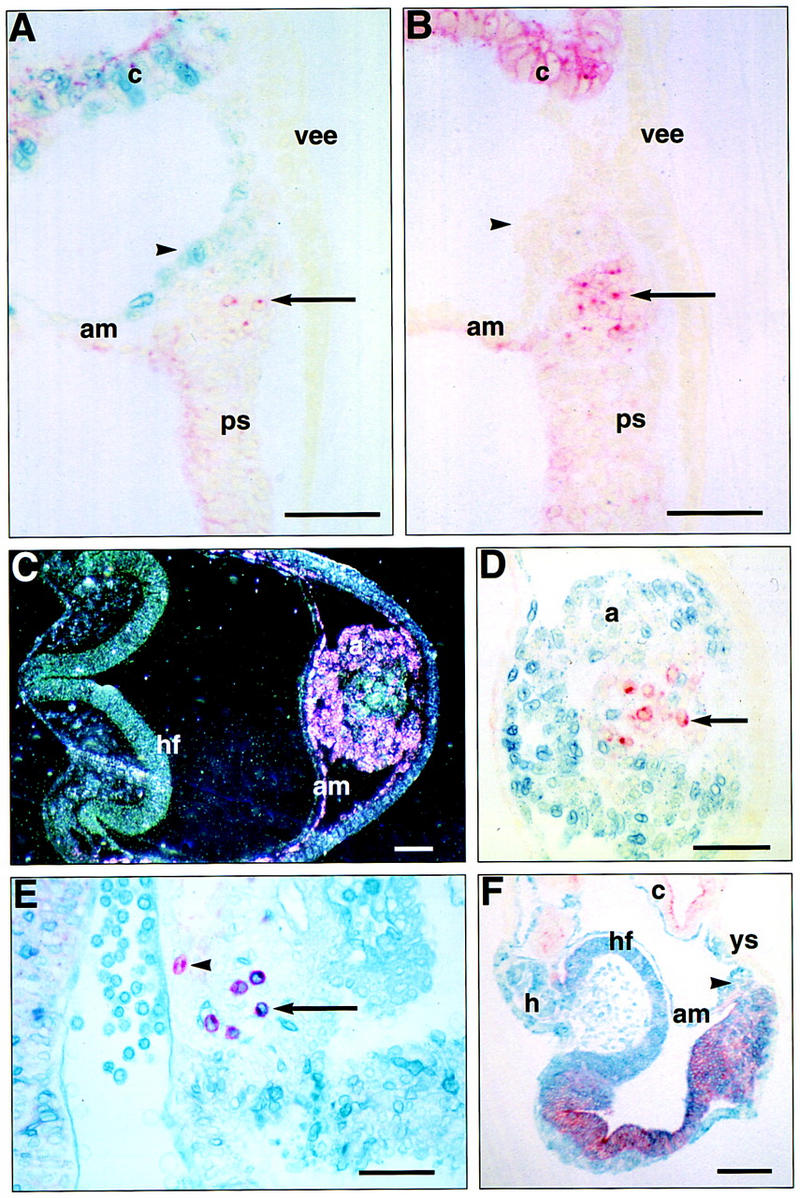
(A–D) Sections of embryos from ICR × Bmp4lacZneo/+ matings stained for β-gal and AP activity. (A) Heterozygote, late streak (LS) stage. Sagittal section of posterior region at embryonic/extraembryonic junction. β-gal staining (arrowhead), representing Bmp4 expression, is present in mesothelial cells lining the exocoelom. Three AP-positive PGCs (arrow) (of a total of seven in this embryo) lie internal to the β-gal staining region and do not stain blue. (B) Wild type, late streak stage, sibling of embryo in A, sagittal section as in A. The cluster of 11 PGCs (arrow) at the base of the incipient allantois (arrowhead) is larger than in the heterozygote. There were 33 identifiable PGCs in this embryo. (C) Heterozygote, headfold (hf) stage. Transverse section at the level of the headfold (hf) and base of the allantois (a). (Dark field) β-Gal staining appears pink. There is strong β-gal activity in the periphery of the allantois but not in its core. (D) High power, bright-field view of part of C. β-Gal staining peripherally at the base of the allantois, but not in the AP-positive PGCs (arrow) lying more centrally. (E,F) Sections of R26.1 ES ↔ Bmp4tm1/+ × Bmp4tm1/+ chimeras stained for β-gal and AP activity: Wild-type ES cells stain blue. (E) Hindgut of a 75% chimeric wild-type embryo showing β-gal-positive PGCs (arrow) derived from the ES cells and a recipient-derived, β-gal-negative, PGC (arrowhead). (F) Sagittal section of 4S stage >95% chimeric homozygous null embryo on the (C57BL/6 × CBA) background. The epiblast derived cells are of wild-type, ES cell origin and have no detectable contribution from the mutant cells that are confined to the chorion ectoderm (c) and visceral yolk sac endoderm (ys). The phenotype is characteristically homozygous null with no allantois (arrowhead), no PGCs, small visceral yolk sac and defective yolk sac vascularization. AP staining in the embryonic ectoderm and chorionic ectoderm is independent of phenotype (cf. with A and B). (am) Amnion; (c) chorion; (h) heart; (ps) primitive streak; (vee) visceral extraembryonic endoderm. Scale bars in A–E, 50 μm; in F, 100 μm.
Bmp4 produced by the extraembryonic ectoderm may be required for the induction of Bmp4 expression in the extraembryonic mesoderm derivatives of the proximal epiblast. To explore this possibility, Bmp4 expression was monitored in Bmp4lacZneo homozygous null embryos by β-gal staining. At the headfold stage, strong β-gal activity is detected in the extraembryonic mesoderm lining the exocoelom, as well as in cells accumulating near the junction of the amnion with the posterior primitive streak, in the position normally occupied by the developing allantois (Fig. 6M,N). Bmp4 expression in the epiblast derivatives is therefore independent of Bmp4 expression in the extraembryonic ectoderm.
Chimera analysis indicates a role for extraembryonic ectoderm Bmp4
The temporal and spatial expression pattern described above is compatible with a role in PGC allocation for Bmp4 secreted by either the extraembryonic ectoderm, the extraembryonic mesoderm, or both. To distinguish between these possibilities, we have exploited the fact that ES cells almost exclusively colonize the epiblast when injected into blastocysts or aggregated with morulae (Beddington and Robertson 1989). In contrast, the recipient embryo forms the trophectoderm and extraembryonic endoderm derivatives and can contribute to the epiblast. A chimera with 100% ES-derived epiblast would then have ES-derived extraembryonic mesoderm and PGCs and recipient-derived extraembryonic ectoderm. In the experiment here, ROSA 26.1 ES cells that are genetically marked with a ubiquitously expressed lacZ reporter gene were either injected into blastocysts or aggregated with morulae from Bmp4tm1 heterozygous intercrosses. The resulting embryos were recovered at nominal E8.5, genotyped, and analyzed for degree of chimerism and PGC number on histological sections.
Between 32% (C57BL/6 × CBA; n = 72) and 50% (129/SvEv × Black Swiss; n = 80) of the embryos recovered were chimeric: The ES cell contribution tended to be stronger in the aggregation chimeras, with 39% of the chimeric embryos showing >95% chimerism in the epiblast derived tissues (Table 1). Generally, chimerism was fine grained throughout the embryos, but in 12/40 blastocyst injection chimeras and 5/23 aggregation chimeras, the extraembryonic mesoderm, the posterior part of the embryo, and sometimes the anterior surface ectoderm were distinctly less chimeric. This result could be expected from the fate map of the epiblast (Lawson et al. 1991) if there had been incomplete cell mingling in the epiblast prior to gastrulation. Chimerism in the PGCs (Fig. 7E) was well correlated with the roughly estimated degree of posterior somatic chimerism in both wild-type embryos and heterozygotes (Table 2), indicating that there was no positive or negative selection for germ cell fate on the basis of the genotype of the recipient embryo or on ES cell origin.
Table 1.
Chimeras of R26.1 ES cells with embryos from Bmp4tm1 × Bmp4tm1matings
|
Recipient genotype
|
Total embryos
|
Mean somite number (range)
|
Percentage chimerism
|
|||||
|---|---|---|---|---|---|---|---|---|
|
0
|
≤25
|
>25–50
|
>50–75
|
>75–95
|
>95
|
|||
| Morula aggregation (C57BL/6 × CBA) | ||||||||
| Wild type | 19 | 8.4 (0–15) | 14 | 0 | 1 | 0 | 2 | 2 |
| +/− | 40 | 8.1 (0–15) | 30 | 3 | 1 | 2 | 0 | 4 |
| −/− | 13 | 2.8 (0–6) | 5 | 0 | 1 | 2 | 2 | 3 |
| Blastocyst injection (129/SvEv × Black Swiss) | ||||||||
| Wild type | 13 | 13.7 (0–21) | 10 | 1 | 1 | 1 | 0 | 0 |
| +/− | 43 | 15.4 (0–26) | 15 | 10 | 7 | 8 | 2 | 1 |
| −/− | 24 | 5.3 (0–14) | 15 | 5 | 1 | 3 | 0 | 0 |
Table 2.
Percent chimerism in PGCs related to the extent of posterior somatic chimerism
|
Genotype
|
Percent chimerism (posterior)
|
||||
|---|---|---|---|---|---|
|
≤25
|
>25–50
|
>50–75
|
>75–95
|
>95
|
|
| Wild type | 1.6 (1) | 35.2 ± 0.3 (2) | 73.6 (1) | 72.0 ± 32.5 (2) | 94.5 ± 4.9 (2) |
| Bmp4tm1/+ | 4.1 ± 6.7 (12) | 20.7 ± 12.8 (14) | 47.1 ± 33.1 (5) | 83.4 ± 6.3 (2) | 95.0 ± 4.9 (5) |
Chimerism in PGCs [mean ± s.d. (n)].
The number of PGCs in the heterozygotes was unaffected by the size of the wild-type population in the epiblast-derived tissues (Fig. 8A,B): There was no indication in chimeras on either genetic background of an increase in PGC number above the nonchimeric level towards the wild-type level, even in chimeras with no detectable heterozygous contribution to the epiblast-derived tissues. The smaller size of the PGC population in heterozygotes is therefore due to reduced Bmp4 from the extraembryonic ectoderm, and cannot be compensated by Bmp4 from wild-type extraembryonic mesoderm.
Figure 8.


PGCs (estimated from histological sections) in chimeras of R26.1 ES cells with wild-type and Bmp4tm1/+ embryos. (A) Aggregation chimeras with (C57BL/6 × CBA) recipients. (B) Blastocyst injection chimeras with (129/SvEv × Black Swiss) recipients. (Open symbols, broken line) Wild-type recipients; (solid symbols, solid line) heterozygous recipients; (circles) nonchimeric; (squares) ≤25% chimeric; (triangles) >25%–50% chimeric; (diamond) >50%–75% chimeric; (four-pointed star) >75%–95% chimeric; (five pointed star) >95% chimeric. The number of PGCs in chimeric embryos falls within the distribution of the nonchimeric embryos of the same genotype, irrespective of the degree of chimerism. The plotted regression lines are for combined chimeric and nonchimeric embryos. The values in the regression equation (see legend to Fig. 4) are in A, (wild type) 2.165 = 1.876 + 0.0361 (8.0); (heterozygote) 1.631 = 1.205 + 0.0483 (8.8); B, (wild type) 2.364 = 1.976 + 0.0283 (13.7); (heterozygote) 2.155 = 1.775 + 0.0246 (15.4).
Wild-type ES cells in combination with homozygous null embryos were unable to rescue the mutant phenotype: Neither allantois nor PGCs were present even when the epiblast-derived component of the conceptus contained no detectable mutant cells (>95% wild-type ES cell contribution) (Table 3; Fig. 7F). Therefore, Bmp4 produced by the extraembryonic ectoderm is required by the epiblast to generate an allantois and PGCs, and cannot be substituted by Bmp4 produced by wild-type extraembryonic mesoderm.
Table 3.
Chimeras of R26.1 ES cells with Bmp4−/− embryos
|
|
Percent chimerism (%)
|
n
|
Somites
|
Allantois
|
PGCs
|
|---|---|---|---|---|---|
| Morula aggregation | 0 | 5 | 0–6 | 0 | 0 |
| (C57BL/6 × CBA) | <95 | 5 | 2–4 | 0 | 0 |
| >95 | 3 | 0–4 | 0 | 0 | |
| Blastocyst injection | 0 | 15 | 0–14 | 1a | 1? |
| (129/SvEv × Black Swiss) | ≤75 | 9 | 0–10 | 1b | 0? |
This nonchimeric embryo had a severely abnormal headfold and a well elongated allantois. One dubious PGC was scored at the base of the allantois.
This embryo was a normal looking 6/7 somite embryo with a well-developed allantois and was 75% chimeric. AP activity was virtually absent throughout the embryo, so no firm conclusion about the absence of PGCs can be drawn.
Discussion
It has been long established that all the fetal lineages, both somatic and germ line, are derived exclusively from the epiblast set aside at about the time of implantation. The earlier allocated extraembryonic cell lineages, that is, trophectoderm and primitive endoderm, contribute no descendants to the fetus, but provide the tissues required for implantation and nutrition of the conceptus (for review, see Rossant 1986). Evidence is now emerging that, in addition to their support functions, these extraembryonic lineages play more intimate roles in embryonic development. For example, early events in anterior neural patterning require specific gene expression in the adjacent visceral embryonic endoderm, a derivative of the primitive endoderm (for review, see Beddington and Robertson 1998). The results reported here demonstrate that the initiation of both the germ line and the allantois is dependent on a signal from the first established extraembryonic lineage, the trophectoderm.
Models for the specification of PGCs and allantois formation in the mouse embryo
In this paper we report three independent sets of observations that together suggest possible models in which Bmp4 produced by extraembryonic cells quantitatively regulates the fate of PGC precursors in the epiblast and the size of the founding population of PGCs in the embryo. These models underscore the importance of cell–cell interactions in the formation of the mammalian germ line (Tam and Zhou 1996), and open up the molecular analysis of the signaling pathways and genes involved.
The first set of observations is that mouse embryos with no functional Bmp4 gene completely lack both PGCs and an allantois, cell types that arise from precursors located before gastrulation in the proximal epiblast (Lawson and Hage 1994). In addition, heterozygous Bmp4tm1 embryos have fewer PGCs than wild type, although the allantois appears normal. From the regression analysis of PGC number against developmental stage (Fig. 4), this difference can be clearly attributed to a smaller founding population in the heterozygotes, and not to a lower proliferation rate.
The second set of findings is that Bmp4 is expressed before gastrulation in the extraembryonic ectoderm, at highest levels in cells at the junction with the proximal epiblast. This expression pattern is particularly evident when assayed with a β-gal reporter inserted into the endogenous Bmp4 allele. Bmp4 is later expressed in the extraembryonic mesoderm, including the allantois, and in cells in the vicinity of the first identifiable PGCs. However, Bmp4 does not appear to be expressed in the PGCs themselves (Fig. 7A,D). In addition, the presence of β-gal activity in the extraembryonic mesoderm of homozygous Bmp4lacZneo embryos implies that Bmp4 in the extraembryonic ectoderm is not required to initiate Bmp4 expression in the extraembryonic mesoderm (Fig. 6M,N).
The third set of observations is that the PGC-and-allantois-deficient phenotype of Bmp4 mutant embryos cannot be rescued by wild-type ES cells injected into blastocysts or aggregated with morulae. In the resulting chimeras, the wild-type ES cells contribute only to the epiblast-derived tissues, whereas the extraembryonic ectoderm and endoderm are derived from mutant cells. Even chimeras with apparently 100% wild-type cells in the epiblast derivatives show the mutant phenotype and lack PGCs. Similarly, the number of PGCs in chimeras with heterozygous embryos is not influenced by the degree of chimerism: Chimeras with only wild-type epiblast cells have the smaller number of PGCs characteristic of heterozygous embryos.
Model I: Extraembryonic ectoderm Bmp4 is the only signal
The simplest model suggested by the data for the role of Bmp4 in regulating PGC formation is as follows: Bmp4 secreted by the extraembryonic ectoderm acts in a concentration dependent manner to regulate cell fate in the epiblast. Cells in the proximal epiblast that are nearest to the extraembryonic ectoderm receive the highest Bmp4 signal. Among these cells a proportion, <50%, become precursors of both PGCs and part of the allantoic population (and other extraembryonic derivatives). Cells more distant from the extraembryonic ectoderm receive a lower Bmp4 signal and will contribute to all types of extraembryonic mesoderm, including allantois, but do not contribute to PGCs. Only a few descendants of a PGC precursor in the epiblast actually become PGCs at the time of allocation (an average of 2.6 descendants after 3.7 generations from an E6 precursor and 1.5 descendants after 1.6 generations from an E6.5 precursor; Lawson and Hage 1994). The cell mingling that follows cell division in the epiblast (Lawson et al. 1991; Gardner and Cockcroft 1998) could ensure that only some descendants remain close enough to the source of Bmp4 to receive sufficient signal for PGC formation. Alternatively, the signal gradient could take time to establish. In either case, the critical concentration would only be achieved shortly before PGC allocation.
The precise local level of active Bmp4 protein and the time during which epiblast cells are exposed to it will depend on multiple factors, for example the level of proteins that can bind Bmp4 and prevent its interaction with receptors such as BmpRII and BmpR1A (Alk3) present in the epiblast (Mishina et al. 1995; Roelen et al. 1997). The genes encoding the antagonists cerberus-like (mCer-1) and follistatin are first expressed respectively in the anterior visceral endoderm (Belo et al. 1997; Biben et al. 1998; Shawlot et al. 1998) and posterior streak (Albano et al. 1994; Feijen et al. 1994) early in gastrulation. The availability of Bmp4 protein may also be regulated by the activity of proteases that cleave these binding proteins, for example proteases belonging to the astacin family that includes Bmp1 and tolloid (Cho and Blitz 1998; Mullins 1998).
Although the observations on PGCs are compatible with a morphogen gradient set up from the extraembryonic ectoderm, the rest of the Bmp4tm1 phenotype is not. The presence and amount of yolk sac mesoderm and yolk sac vascularization vary in Bmp4 null embryos according to the genetic background (Winnier et al. 1995), but the allantois fails to develop irrespective of the genetic background, and is also absent in chimeras with wild-type ES cells, indicating that extraembryonic ectoderm Bmp4 is an absolute requirement for allantois formation. The presence of a normal allantois in heterozygotes suggests that a lower threshold Bmp4 concentration than that required for PGC formation allows the development of an allantois. This is supported by lineage analysis that has shown that the allantois is derived not only from the most proximal epiblast, but also from epiblast cells further from the junction with the extraembryonic ectoderm where the Bmp4 concentration would be expected to be lower (Lawson and Pedersen 1992; Lawson and Hage 1994). In the heterozygotes, fewer epiblast cells would be exposed to this lower concentration than in the wild type, and the allantois would be expected to be smaller, or the onset of its formation would be delayed. We have found no evidence of this.
Model II: Two signals are required to generate PGCs and allantois
As noted above, there is an inconsistency between the apparently normal allantois phenotype of Bmp4 heterozygotes and the simple model of Bmp4 acting as a morphogen and specifying PGCs and allantois at different threshold concentrations. One explanation for this could be that the allantois cells that are closely lineage related to the PGCs, that is, those that are descended from the same precursors most proximal in the epiblast, and closest to the source of Bmp4, are crucial for initiating the process of allantoic bud formation. Therefore, we suggest that the highest Bmp4 concentration is required not to specify PGCs as in Model I, but rather to specify a group of cells whose descendants, after traversing the streak, will either become the putative allantois initiator cells or PGCs (Fig. 9A,B). The size of this population will be related to both the number of cells in the most proximal epiblast and the strength and duration of the extraembryonic Bmp4 signal to which they are exposed.
Figure 9.
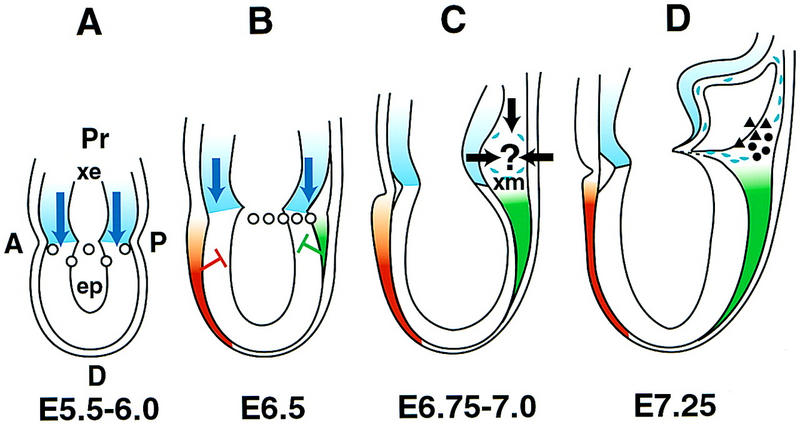
Two-signal model of Bmp4 regulation of PGC allocation. (A) Preprimitive streak stage. Bmp4 is produced by the extraembryonic ectoderm (xe) adjacent to the proximal epiblast (ep) and a gradient (blue arrows) is set up to which the proximal epiblast cells respond and become directed toward an allantois initiator/PGC fate (○). (A) Anterior; (P) posterior; (Pr) proximal; (D) distal. (B) Early primitive streak stage. Bmp4 continues to be produced by the extraembryonic ectoderm. The gradient can be steepened by the presence of the extracellular antagonists mCer-1 (red) anteriorly and follistatin (green) posteriorly. These may also limit the temporal window within which Bmp4 can act in the epiblast. Along with other epiblast cells, the allantois initiator/PGC progenitors divide with a generation time of 6.5–7.0 hr, and the progeny align toward and begin to move through the posterior streak. (C) Midstreak stage. Part of the newly formed extraembryonic mesoderm (xm) is derived from the most proximal epiblast and is specified to respond to the putative second signal (black arrows). This coincides with the onset of Bmp4 expression in the extraembryonic mesoderm. (D) Midstreak/late streak stage. By ∼E7.2, precursors have separated into allantois initiator (▴) and PGC (●) lineages.
After the precursor population has been established, the cells must be directed into either the allantois initiator pool or into the PGC lineage. This is most likely to be in response to a second local signal, either before or after the cells have traversed the primitive streak (Fig. 9C,D). We currently favor the second scenario because previous clonal analysis suggests that the time of PGC allocation is at ∼E7.2, when the PGCs first become identifiable in a cluster at the base of the incipient allantois. Allocation is said to have occurred when cells no longer enter or leave the population (McLaren 1976), that is, the population has become lineage restricted and self-perpetuating. Allocation is unlikely to occur in the epiblast because, on average, 1.6 cell cycles of 6.8 hr in the early streak embryo, and 3.7 cycles in the prestreak embryo, intervene before PGC lineage restriction (Lawson and Hage 1994).
The precise nature and location of the second signal are unknown. However, several lines of evidence lead us to speculate that the response to the second signal operates in favor of generating enough cells to initiate an allantois, a structure that is absolutely required for the development of a placental mammal, and leaving the remainder of the population available for allocation to the PGC lineage. The number of PGCs finally allocated will therefore depend on the size of the precursor pool and that proportion of it directed into forming an allantois. All current findings on the PGCs are compatible with this model, that is, (1) the presence of a normal allantois, but reduced numbers of PGCs in the heterozygotes, (2) the absence of PGCs, but a normal allantois in a small minority of heterozygotes on the (C57BL/6 × CBA) background, (3) differences in the size of the PGC founding population between wild type (C57BL/6 × CBA) and (129/SvEv × Black Swiss), and (4) delayed appearance of PGCs in heterozygotes (Fig. 2) together with the smaller size of the region in which PGCs are first identifiable (Fig. 7A,B). The two-signal model does not require that the extraembryonic ectoderm Bmp4 is functional at the time of PGC allocation.
If this two-signal model is correct, a prediction is that embryos bearing a mutation in a gene that affects allantoic phenotype, but that allows the development of an abnormal allantois, may have PGCs, but that phenotypes specifically lacking an allantois will not. In support of this prediction, homozygous eed (Faust et al. 1995), T (Brachyury) (V. Wilson and R. Beddington, pers. comm.) and Otx2 mutants (K. Lawson, unpubl.) all show abnormal allantois development but have cells with an AP-staining pattern characteristic of PGCs. Nothing is known of the nature or source of the second signal. The possibility that it is Bmp4 produced by the early extraembryonic mesoderm will, in the future, be tested by chimera analysis with homozygous Bmp4 mutant ES cells.
Bmp4 may act indirectly and/or in synergy with other signaling factors
In the model proposed above, we have assumed that Bmp4 secreted by the extraembryonic ectoderm acts directly on the epiblast. However, we cannot at this time exclude the possibility that Bmp4 acts indirectly, for example by regulating the production of another signaling molecule(s) by the extraembryonic ectoderm and/or endoderm. It is also possible that Bmp4 acts in synergy with another factor(s) made by the extraembryonic ectoderm or epiblast and that PGC precursor fate, is determined by a combination of factors. In the future, these possibilities may be tested by incubating distal epiblast in culture with different combinations of extraembryonic tissues or signaling factors and assaying for the appearance of PGCs in vitro. Moreover, if Bmp4 acts in synergy with other obligatory factors to specify PGC cell fate, it is possible that null mutants in genes encoding these factors will have a complete deficiency, or reduced number, of PGCs. In contrast, embryos lacking genes that antagonize Bmp4 function might be expected to have more PGCs and extraembryonic tissues. In this regard, it would be interesting to assay for PGC number in null mutants of Smad2 that have extraembryonic mesoderm but little embryonic mesoderm (Waldrip et al. 1998).
Model III: Bmp4 controls growth and cell movement
An alternative possibility to the above models is that Bmp4, rather than regulating PGC/allantois precursor cell fate, instead controls the growth of proximal epiblast cells and their translocation toward and through the posterior streak into the extraembryonic region. According to this model, epiblast precursors of the PGCs and their descendants in Bmp4 null embryos may translocate abnormally from the proximal epiblast into the anterior part of the streak. If already fully specified, they would then become PGCs ectopically: These have not been found. If specification and allocation normally occur after traversing the streak, the originally proximal cells could be influenced by signals in the anterior part of the streak and contribute to the embryonic mesoderm being formed at that time. We cannot exclude this possibility because, although development anterior to the node can be relatively normal in Bmp4 null embryos, interpretation is confounded by the general overall reduction in growth that becomes apparent at the onset of gastrulation in the mutants. One way of testing this model in the future would be clonal analysis of the proximal epiblast in the mutants.
Materials and methods
Mouse strains
The following genetic backgrounds for the Bmp4tm1blh null mutation (Winnier et al. 1995) were used in the present study. C57BL/6–Bmp4tm1 males (Dunn et al. 1997) were mated with (C57BL/6 × CBA)F1 females. The progeny were intercrossed for one generation and the line maintained by backcrossing heterozygous males to (C57BL/6 × CBA)F1 females. This line was used for PGC analysis and for morula aggregation chimeras. For generating embryos for blastocyst injection, the Bmp4tm1 mutation was maintained on a (129/SvEv × Black Swiss) background by intercrossing. Bmp4lacZneo was maintained on the (129/SvEv × Black Swiss) background and embryos for PGC and expression pattern analysis obtained from heterozygous matings and matings with ICR females.
Construction of the lacZ knock-in targeting vector
Detailed information on the construction of the Bmp4lacZneo targeting vector and Cre-mediated excision of the neo cassette can be found at http://www.mc.vanderbilt.edu/vumcdept/cellbio/hogan.html. Briefly, most of exon 3, from nucleotides 6807–7178 (Kurihara et al. 1993), including the translation initiation ATG and sequences encoding amino acids 29–124 of the pro region, is entirely replaced with a β-gal cassette from pPD1.27, which encodes bacterial β-gal with SV40 nuclear localization and polyadenylation signals (Fire et al. 1990) (Fig. 5A). The cassette also contains a loxP-site-flanked positive selection MC1-neor cassette (a gift from Steve O’Gorman, Salk Institute, La Jolla, CA). After recombination, the targeted Bmp4lacZneo allele will generate a fusion transcript between 5′ UTR of Bmp4 and lacZ. Note that this construction was deliberately designed to maintain all potential regulatory elements within the Bmp4 locus, including introns.
Electroporation, selection, and identification of targeted ES cells
A total of 19 × 106 TL1 ES cells were electroporated with 150 μg of NotI-digested targeting vector DNA and subjected to positive and negative selection (Winnier et al. 1995). DNA from doubly resistant clones was digested with SpeI for Southern blot analysis using the 500-bp 5′ external BsmI–BamHI probe (Fig. 5A,B) and internal lacZ and neor probes (data not shown). One correctly targeted line, 12C, in which the 3′ homologous recombination occurred within the intron between coding exons 3 and 4, was injected into C57BL/6NHsd (Harlan Sprague Dawley) blastocysts; resulting male chimeras were mated with outbred Black Swiss (Taconic) females. F1 Bmp4lacZneo heterozygotes were serially backcrossed onto Black Swiss. Bmp4lacZneo heterozygotes were routinely identified by PCR analysis for the neo (Dunn et al. 1997) or lacZ sequences (see below) within the targeted allele.
Chimera generation and retrospective genotyping
Injection chimeras
Injection chimeras were generated as described (Bradley 1987; Hogan et al. 1994). Blastocysts from Bmp4tm1/+ (129/SvEv × Black Swiss) intercrossings were injected with 12–15 ROSA26.1 (R26.1) ES cells (kindly provided by Elizabeth Robertson; Varlet et al. 1997). Following transfer, the embryos were recovered between E8.5 and 9.5, fixed, and processed for double β-gal and AP staining. The genotype of the host blastocyst was determined retrospectively by PCR analysis of enzymatically isolated yolk sac endoderm (Hogan et al. 1994). Potentially contaminating mesoderm was monitored in the endoderm DNA preparations by PCR analysis for the lacZ gene with the following primer sequences: lacZ 1, 5′-TCTGCTTCAATCAGCGTGCC-3′ and lacZ 2, 5′-GCCGTCTGAATTTGACCTGA-3′.
Aggregation chimeras
Aggregation of eight-cell stage embryos with ES cells was basically as described (Nagy and Rossant 1993). Briefly, R26.1 ES cells were cultured on mouse embryonic fibroblast feeder cells. For aggregation, ES cells were trypsinized and the fibroblasts were allowed to reattach to the tissue culture plastic for 30 min. Subsequently, the ES cells were transferred to a smaller volume for 2 hr to form aggregation clumps. Eight-cell stage embryos were collected at E2.5 from Bmp4tm1/+ matings on the (C57BL/6 × CBA) background. The zona pellucida was removed with acid Tyrode’s solution and single embryos aggregated with clumps of 10–15 ES cells in aggregation wells in 20 μl droplets of M16 medium and cultured overnight at 37°C in 5% CO2 (Zwijsen et al. 1999). Embryos were transferred the following day into E2.5 pseudopregnant (C57BL/6 × CBA)F1 recipients. The embryos were recovered at nominal E8.5 and further processed and genotyped as described above. Very retarded embryos were genotyped on the parietal endoderm of Reichert’s membrane.
Developmental index
The stage of embryo development as judged by a score of morphological features (modified from Brown 1990), or the number of somite pairs, was very variable between and within litters of the same nominal gestational age. Morphological score was linearly correlated with somite number up to 20 somite pairs, and the relationship was the same in wild type and heterozygotes on the (C57BL/6 × CBA) background (data not shown). Somite pairs are laid down on average every 90 min during normal development, at least up to 30 somites (Tam 1981). Somite number was therefore used as a measure of the developmental age of individual embryos.
β-Gal staining
Bmp4lacZneo embryos and decidua were fixed in 4% paraformaldehyde in PBS at 4°C for 30 min with rocking, washed twice for 10 min in PBS at 4°C, transferred into freshly prepared X-gal solution and stained overnight (or longer) at 37°C (Hogan et al. 1994). After rinsing with PBS, embryos were post-fixed in 4% paraformaldehyde. Some embryos were cleared in 80% glycerol in PBS.
For histological analysis, stained decidua were dehydrated into 100% isopropanol, washed twice with 1:1 isopropanol/paraffin wax, embedded in wax, and 7-μm sections lightly counterstained with eosin.
Detecting and counting PGCs
Whole mounts
Embryos between E7.5 and E9.5 were dissected from the decidua and Reichert’s membrane reflected. The yolk sac was separated from the ectoplacental cone of embryos that were in the process of, or had completed, turning. Both yolk sac and amnion were reflected but left attached to the embryo. The embryos were fixed in 4% paraformaldehyde in PBS for 2 hr at 4°C. The embryos were washed three times in PBS, during which time they were further dissected according to size. Embryos up to ∼6S (early hind gut) were left intact; embryos between ∼7S and ∼11S were transected at the level of S4/5 into an anterior and posterior portion; the yolk sac of still older embryos was trimmed and the embryos then transected at the level of the anterior intestinal portal or, when forelimb buds were present, at the level of S10. The posterior portion of these older embryos was then split longitudinally along the line of the dorsal aorta to yield two curved strips, one consisted of the hindgut, allantois, intermediate, and lateral plate mesoderm, and reflected yolk sac and amnion; the other, dorsal, piece contained the neural tube, somites, and presomitic mesoderm. All fragments were retained and treated with 70% ethanol for at least 1 hr at 4°C. After washing three times with distilled water, they were stained with α-naphthyl phosphate/fast red TR (Ginsburg et al. 1990) for 13 min at room temperature. They were then rinsed in water and cleared in 70% glycerol. Still intact embryos (up to ∼6S) were split into an anterior half and a posterior half containing the PGCs; yolk sac not containing PGCs was trimmed off. Obscuring neural tube and paraxial mesoderm in ∼7 to ∼11S stages, and the allantois plus posterior ventral mesoderm in older stages, were separated from the hindgut. The stained pieces from the posterior portion of the embryo were slightly flattened in 70% glycerol under a coverslip and the PGCs identified and counted using a 25× objective lens in a compound microscope. The anterior portion of the embryo was retained for genotyping.
Sections
Embryos were fixed in 4% paraformaldehyde as above, rapidly dehydrated through a cold ethanol series to 96% ethanol, infiltrated with cold glycol methacrylate (Technovit 8100) for 1–2 hr. The plastic was then polymerized at 4°C. Serial sections cut at 7 μm were stained for AP activity with ASMX/Fast Red TR (Sigma) for 30–90 min according to the manufacturer’s instructions. The sections were counterstained with Mayer’s haemalum and mounted in Aquamount (Gurr). PGCs were counted on the basis of the densely staining AP-positive cytoplasmic spot, using a 25× objective lens (Ginsburg et al. 1990; Lawson and Hage 1994).
Combined β-gal and AP staining
Embryos were fixed in 4% paraformaldehyde for 2 hr as above and stained for β-gal at 37°C for 4 hr (chimeras with R26.1 ES cells) or 8 hr (Bmp4lacZneo embryos). They were then dehydrated, embedded in Technovit 8100, sectioned, and stained for AP activity as above without counterstaining.
Statistics
Regression analysis and comparison of regression lines were performed as described, using the F test to compare variances (Snedecor and Cochran 1967).
Acknowledgments
We thank Drs. Jacqueline Deschamps, David Greenstein, Anthony Mahowald, Christine Mummery, David Threadgill, and Lilianna Solnica-Krezel for discussions and critical comments on the manuscript; Dr. Lucy Liaw and Linda Hargett for help in establishing the Bmp4lacZneo line; Marie-José Goumans, Marga van Rooijen, and Dr. Elizabeth Robertson for invaluable advice on making chimeras. We also thank Angela D. Land-Dedrick for assistance in manuscript preparation and Dominic Doyle for the illustration of Figure 9. N.R.D. was supported by a grant from the National Institutes of Health (HD 28955) to B.L.M.H., who is an Investigator of the Howard Hughes Medical Institute.
The publication costs of this article were defrayed in part by payment of page charges. This article must therefore be hereby marked ‘advertisement’ in accordance with 18 USC section 1734 solely to indicate this fact.
Footnotes
E-MAIL brigid.hogan@mcmail.vanderbilt.edu; FAX (615) 343-2033.
E-MAIL lawson@niob.knaw.nl; FAX 31 (30) 2516464.
References
- Albano RM, Arkell R, Beddington RSP, Smith JC. Expression of inhibin subunits and follistatin during postimplantation mouse development: Decidual expression of activin and expression of follistatin in primitive streak, somites and hindbrain. Development. 1994;120:803–813. doi: 10.1242/dev.120.4.803. [DOI] [PubMed] [Google Scholar]
- Beddington RSP, Robertson EJ. An assessment of the developmental potential of embryonic stem cells in the midgestation mouse embryo. Development. 1989;105:733–737. doi: 10.1242/dev.105.4.733. [DOI] [PubMed] [Google Scholar]
- ————— Anterior patterning in the mouse. Trends Genet. 1998;14:277–284. doi: 10.1016/s0168-9525(98)01499-1. [DOI] [PubMed] [Google Scholar]
- Belo JA, Bouwmeester T, Leyns L, Kertesz N, Gallo M, Follettie M, De Robertis EM. Cerberus-like is a secreted factor with neuralizing activity expressed in the anterior primitive endoderm of the mouse gastrula. Mech Dev. 1997;68:45–57. doi: 10.1016/s0925-4773(97)00125-1. [DOI] [PubMed] [Google Scholar]
- Biben C, Stanley E, Fabri L, Kotecha S, Rhinn M, Drinkwater C, Lah M, Wang CC, Nash A, Hilton D, Ang SL, Mohun T, Harvey RP. Murine cerberus homologue mCer-1: A candidate anterior patterning molecule. Dev Biol. 1998;194:135–151. doi: 10.1006/dbio.1997.8812. [DOI] [PubMed] [Google Scholar]
- Bradley A. Production and analysis of chimaeric mice. In: Robertson E, editor. Teratocarcinomas and embryonic stem cells: A practical approach. Oxford, UK: IRL Press; 1987. pp. 113–151. [Google Scholar]
- Brown NA. Routine assessment of morphology and growth: Scoring systems and measurements of size. In: Copp AJ, Cockroft DL, editors. Postimplantation mammalian embryos: A practical approach. New York, NY: Oxford University Press; 1990. pp. 93–108. [Google Scholar]
- Buehr M. The primordial germ cells of mammals: Some current perspectives. Exp Cell Res. 1997;232:194–207. doi: 10.1006/excr.1997.3508. [DOI] [PubMed] [Google Scholar]
- Chiquoine AD. The identification, origin and migration of primordial germ cells in the mouse embryo. Anat Rec. 1954;118:135–146. doi: 10.1002/ar.1091180202. [DOI] [PubMed] [Google Scholar]
- Cho KWY, Blitz IL. BMPs, Smads and metalloproteases: Extracellular and intracellular modes of negative regulation. Curr Opin Genet Dev. 1998;8:443–449. doi: 10.1016/s0959-437x(98)80116-0. [DOI] [PubMed] [Google Scholar]
- Dunn NR, Winnier GE, Hargett LK, Schrick JJ, Fogo AB, Hogan BLM. Haploinsufficient phenotypes in Bmp4 heterozygous null mice and modification by mutations in Gli3 and Alx4. Dev Biol. 1997;188:235–247. doi: 10.1006/dbio.1997.8664. [DOI] [PubMed] [Google Scholar]
- Faust C, Schumacher A, Holdener B, Magnuson T. The eed mutation disrupts anterior mesoderm production in mice. Development. 1995;121:273–285. doi: 10.1242/dev.121.2.273. [DOI] [PubMed] [Google Scholar]
- Feijen A, Goumans MJ, van den Eijnden-van Raaij AJM. Expression of activin subunits, activin receptors and follistatin in postimplantation mouse embryos suggests specific developmental functions for different activins. Development. 1994;120:3621–3637. doi: 10.1242/dev.120.12.3621. [DOI] [PubMed] [Google Scholar]
- Fire A, Harrison SW, Dixon D. A modular set of lacZ fusion vectors for studying gene expression in Caenorhabditis elegans. Gene. 1990;93:189–198. doi: 10.1016/0378-1119(90)90224-f. [DOI] [PubMed] [Google Scholar]
- Gardner RL, Cockroft DL. Complete dissipation of coherent clonal growth occurs before gastrulation in mouse epiblast. Development. 1998;125:2397–2402. doi: 10.1242/dev.125.13.2397. [DOI] [PubMed] [Google Scholar]
- Ginsburg M, Snow MHL, McLaren A. Primordial germ cells in the mouse embryo during gastrulation. Development. 1990;110:521–528. doi: 10.1242/dev.110.2.521. [DOI] [PubMed] [Google Scholar]
- Hahnel AC, Rappolee DA, Millan JL, Manes T, Ziomek CA, Theodosiou NG, Werb Z, Pedersen RA, Schultz GA. Two alkaline phosphatase genes are expressed during early development in the mouse embryo. Development. 1990;110:555–564. doi: 10.1242/dev.110.2.555. [DOI] [PubMed] [Google Scholar]
- Hogan B, Beddington R, Constantini F, Lacy E. Manipulating the mouse embryo. Cold Spring Harbor, NY: Cold Spring Harbor Laboratory Press; 1994. [Google Scholar]
- Hogan BLM. Bone morphogenetic proteins: Multifunctional regulators of vertebrate development. Genes & Dev. 1996;10:1580–1594. doi: 10.1101/gad.10.13.1580. [DOI] [PubMed] [Google Scholar]
- Kurihara T, Kitamura K, Takaoka K, Nakazato H. Murine bone morphogenetic protein-4 gene: Existence of multiple promoters and exons for the 5′-untranslated region. Biochem Biophys Res Commun. 1993;192:1049–1056. doi: 10.1006/bbrc.1993.1523. [DOI] [PubMed] [Google Scholar]
- Lawson KA, Pedersen RA. Early mesoderm formation in the mouse embryo. In: Bellairs R, Sanders EJ, Lash JW, editors. Formation and differentiation of early embryonic mesoderm. 1992. , NATO ASI Series A231, pp. 33–46. Plenum Press, New York, NY. [Google Scholar]
- Lawson KA, Hage WJ. Clonal analysis of the origin of primordial germ cells in the mouse. Ciba Found Symp. 1994;182:68–91. doi: 10.1002/9780470514573.ch5. [DOI] [PubMed] [Google Scholar]
- Lawson KA, Meneses JJ, Pedersen RA. Clonal analysis of epiblast fate during germ layer formation in the mouse embryo. Development. 1991;113:891–911. doi: 10.1242/dev.113.3.891. [DOI] [PubMed] [Google Scholar]
- MacGregor GR, Zambrowicz BP, Soriano P. Tissue non-specific alkaline phosphatase is expressed in both embryonic and extraembryonic lineages during mouse embryogenesis but is not required for migration of primordial germ cells. Development. 1995;121:1487–1496. doi: 10.1242/dev.121.5.1487. [DOI] [PubMed] [Google Scholar]
- McLaren A. Mammalian chimeras. Cambridge, UK: Cambridge University Press; 1976. [Google Scholar]
- Mishina Y, Suzuki A, Ueno N, Behringer RR. Bmpr encodes a type I bone morphogenetic protein receptor that is essential for gastrulation during mouse embryogenesis. Genes & Dev. 1995;9:3027–3037. doi: 10.1101/gad.9.24.3027. [DOI] [PubMed] [Google Scholar]
- Mullins MC. Holy Tolloido: Tolloid cleaves SOG/Chordin to free DPP/BMPs. Trends Genet. 1998;14:127–129. doi: 10.1016/s0168-9525(98)01431-0. [DOI] [PubMed] [Google Scholar]
- Nagy A, Rossant J. Production of completely ES cell-derived fetuses. In: Joyner AL, editor. Gene targeting: A practical approach. Oxford, UK: IRL Press; 1993. pp. 147–179. [Google Scholar]
- Roelen BA, Goumans MJ, van Rooijen MA, Mummery CL. Differential expression of BMP receptors in early mouse development. Int J Dev Biol. 1997;41:541–549. [PubMed] [Google Scholar]
- Rossant J. Development of extraembryonic cell lineages in the mouse embryo. In: Rossant J, Pedersen RA, editors. Experimental approaches to mammalian embryonic development. Cambridge, UK: Cambridge University Press; 1986. pp. 97–120. [Google Scholar]
- Shawlot W, Deng JM, Behringer RR. Expression of the mouse cerberus-related gene, Cerr1, suggests a role in anterior neural induction and somitogenesis. Proc Natl Acad Sci. 1998;95:6198–6203. doi: 10.1073/pnas.95.11.6198. [DOI] [PMC free article] [PubMed] [Google Scholar]
- Snedecor GW, Cochran WG. Statistical methods. Ames, IA: Iowa State University Press; 1967. [Google Scholar]
- Soriano P, Montgomery C, Geske R, Bradley A. Targeted disruption of the c-src proto-oncogene leads to osteopetrosis in mice. Cell. 1991;64:693–702. doi: 10.1016/0092-8674(91)90499-o. [DOI] [PubMed] [Google Scholar]
- Tam PPL. The control of somitogenesis in mouse embryos. J Embryol Exp Morphol. 1981;65:103–128. [PubMed] [Google Scholar]
- Tam PPL, Snow MHL. Proliferation and migration of primordial germ cells during compensatory growth in mouse embryos. J Embryol Exp Morphol. 1981;64:133–147. [PubMed] [Google Scholar]
- Tam PPL, Zhou SX. The allocation of epiblast cells to ectodermal and germ-line lineages is influenced by the position of the cells in the gastrulating mouse embryo. Dev Biol. 1996;178:124–132. doi: 10.1006/dbio.1996.0203. [DOI] [PubMed] [Google Scholar]
- Varlet I, Collignon J, Robertson EJ. Nodal expression in the primitive endoderm is required for specification of the anterior axis during mouse gastrulation. Development. 1997;124:1033–1044. doi: 10.1242/dev.124.5.1033. [DOI] [PubMed] [Google Scholar]
- Waldrip WR, Bikoff EK, Hoodless PA, Wrana JL, Robertson EJ. Smad2 signaling in extraembryonic tissues determines anterior-posterior polarity of the early mouse embryo. Cell. 1998;92:797–808. doi: 10.1016/s0092-8674(00)81407-5. [DOI] [PubMed] [Google Scholar]
- Winnier G, Blessing M, Labosky PA, Hogan BLM. Bone morphogenetic protein-4 is required for mesoderm formation and patterning in the mouse. Genes & Dev. 1995;9:2105–2116. doi: 10.1101/gad.9.17.2105. [DOI] [PubMed] [Google Scholar]
- Zwijsen, A., M.J. Goumans, K.A. Lawson, M.A. van Rooijen, and C.L. Mummery. 1999. Ectopic expression of the transforming growth factor β type II receptor disrupts mesoderm organization during mouse gastrulation. Dev. Dyn. (in press). [DOI] [PubMed]