Abstract
Differential detergent fractionation (DDF) is frequently used to partition fresh cells and tissues into distinct compartments. We have tested whether DDF can reproducibly extract and fractionate cellular protein components from frozen tissues. Frozen kidneys were sequentially extracted with three different buffer systems. Analysis of the three fractions with LC-MS/MS identified 1,693 proteins, some of which were common to all fractions and others unique to specific fractions. Normalized spectral index values (SIN) obtained from these data were compared in order to evaluate both the reproducibility of the method as well as the efficiency of enrichment. SIN values between replicate fractions demonstrated a high correlation, confirming the reproducibility of the method. Correlation coefficients across the three fractions were significantly lower than those for the replicates, supporting the capability of DDF to differentially fractionate proteins into separate compartments. Subcellular annotation of the proteins identified in each fraction demonstrated a significant enrichment of cytoplasmic, cell membrane and nuclear proteins in the three respective buffer system fractions. We conclude that DDF can be applied to frozen tissue to generate reproducible proteome coverage discriminating subcellular compartments. This demonstrates the feasibility of analyzing cellular compartment specific proteins in archived tissue samples with the simple DDF method.
Keywords: Differential detergent fractionation, Normalized spectral index, Frozen tissue, Subcellular location
INTRODUCTION
A comprehensive, quantitative understanding of protein levels in tissues and cells facilitates our knowledge of the roles of various proteins in regulating biological processes. Recent developments in mass spectrometry have shown great promise in broadening the base of this global knowledge, supported by improvements in high resolving power, mass accuracy, and sensitivity. However, inefficient extraction and signal suppression from abundant proteins often prevent the detection of low abundance proteins, whose differential expression upon alteration of experimental stimuli or in disease states is of great interest.1 Efforts to overcome these limitations involve employing multiple fractionation steps of proteins or peptides, which may require a large amount of sample in order to compensate for the lower detection efficiency of less abundant proteins. Furthermore, specialized chromatographic or other separation devices may be needed. This can be a major hurdle for experimental biologists seeking to obtain proteomics information as well as for clinicians with specimens for diseases archived in freezers, often in extremely limited amounts. Another disadvantage of global shotgun proteomics is a loss of information about subcellular localization of proteins. Separation of organelles combined with proteomics has shown significant success in obtaining spatial information2, 3 that would be ideal for correlating to histological information of archival specimens. Yet, this approach usually requires an amount of fresh tissue considered unreasonable, or laboratory expertise not readily at hand.
A large number of archived, often frozen, patient tissue samples exist annotated with detailed longitudinal clinical information and other experimental data. Validation of user-friendly methods should remove barriers for proteomic studies of these valuable experimental and clinical samples. Simple and reliable sample preparation is a key issue for any proteomic strategy, contributing to the reproducibility of results. We tested a simple method to increase the number of proteins detected by MS and provide cell compartmental information using limiting amounts of frozen tissue. This approach employs a commercially available, differential detergent fractionation (DDF) technique to produce multiple fractions for proteomic analysis. DDF represents an alternative method of fractionation that employs sequential extraction of cells or tissues with detergent-containing buffers.4, 5 They partition cellular proteins into structurally and functionally distinct compartments such as cytosol, membrane/organelle, and nucleus. Applying DDF to frozen tissues raises the concern that ice crystal formation around frozen cells might disrupt cellular integrity,6 which may inhibit subcellular enrichment with this method. However, DDF depends not only on cellular integrity but also on the physical properties of the detergents used for extraction. These alone may achieve satisfactory subcellular enrichment.
In this study, we employed DDF to extract proteins from frozen tissues and tested its efficiency in enrichment and reproducibility using LC-MS/MS. The goal of this study was to establish a simple method to cover the widest proteome possible in a reproducible manner and to obtain subcellular information, when only small amount of frozen tissue is available. To assess the utility of the DDF method to achieve this goal, comprehensive analysis and comparison of the protein components identified from each DDF fraction were performed.
MATERIALS AND METHODS
Animals
C57Bl/6J mice were purchased from the Jackson Laboratory and used under approved animal protocols (Einstein IACUC 20060801). At 6 months of age, the mice were sacrificed and kidneys harvested. Each kidney was washed twice with ice cold PBS, quick frozen in liquid nitrogen, and stored at −80 °C until further analysis. 15N metabolically labeled mice were prepared as previously described.7 Briefly, a 15N-labeled specifically fortified diet (Research Diets, Inc., New Brunswick NJ) using 15N-labeled spirulina (Cambridge Isotope Laboratories) was fed to mice immediately after weaning (21 days of age) for a total of 12 weeks. Metabolic labeling efficiency was monitored non-invasively through the analysis of urine sediment while the labeling process was ongoing. Kidney proteins were labeled at >90%.
Sample Preparation
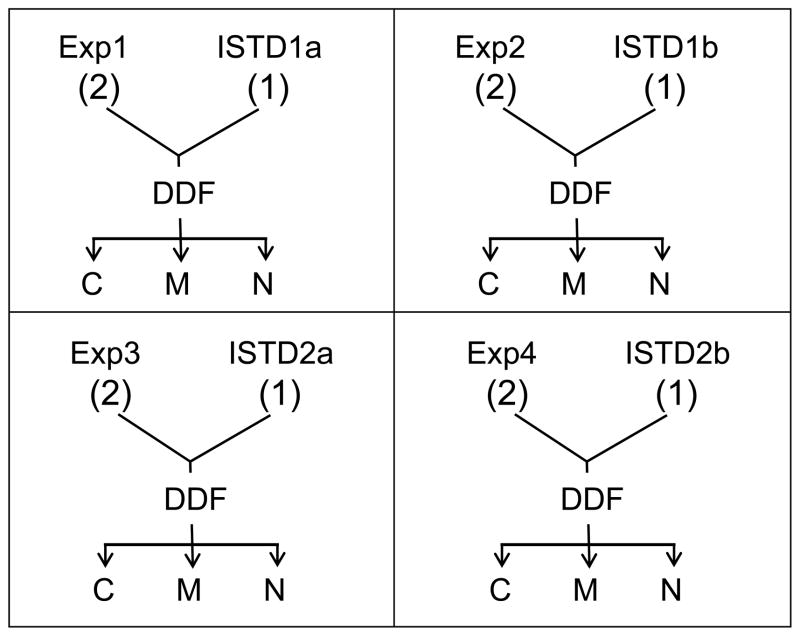
There were four different experimental sets as is shown in the scheme 1 (the number of mice used is indicated in parentheses in scheme 1). About one eighth of each kidney from two mice (Exp) was pooled together with about one fourth of a kidney from one wild type 15N metabolically labeled (ISTD) mouse in each experimental set. Sections of one ISTD kidney was used for Exp1 and Exp2, and designated as ISTD1a and ISTD1b. Exp3 and Exp4 used another ISTD kidney which was assigned as ISTD2a and ISTD2b. They were pooled as is described in Scheme 1 and fractionated to 3 different fractions, termed C, M, and N. Thus, ISTD1a and ISTD1b are technical replicates of ISTD1 and Exp1, Exp2, Exp3, and Exp4 are biological replicates. In addition, ISTD1 and ISTD2 are biological replicates since kidney tissue from different ISTD mice were used in each group.
Scheme 1.
A scheme showing each experimental set (the number of mice used for the study indicated in the parenthesis) and the resulting fractions. One eighth of a kidney from two independent Exp mice and one fourth of a kidney from 15N labeled ISTD mice used for experiments. Portion of the same ISTD mouse were used for Exp1 and Exp2; and denoted as ISTD1a and ISTD1b. The same scheme applies to Exp3 and 4 as well. Pooled tissues were fractionated with DDF to produce three fractions C, M, and N)
Differential Detergent Fractionation (DDF)
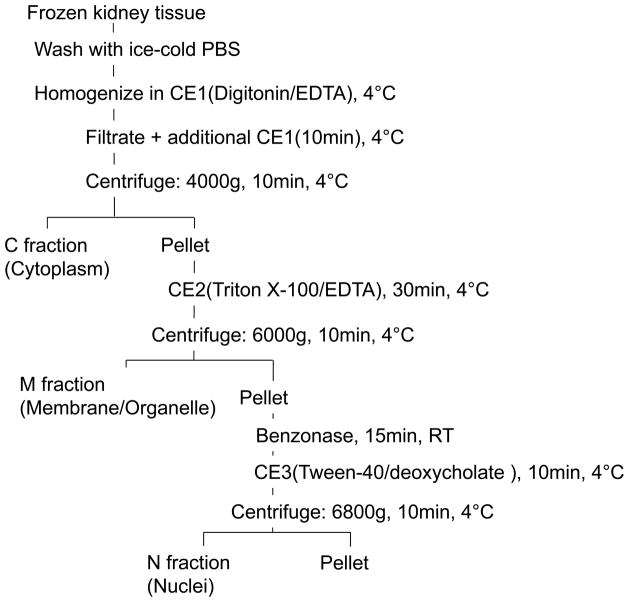
About 100 mg of combined frozen tissue was processed by DDF using the Qproteome Cell Compartment Kit from QIAGEN following the company protocols. This protocol involves the sequential extraction of cells or tissues with three detergent-containing buffers; CE1: Digitonin(0.015%)/EDTA (5mM); CE2: Triton X-100 (0.5%)/EDTA (5mM); and CE3: Tween-40 (1%)/deoxycholate (0.5%).4 The workflow of the DDF is illustrated in Scheme 2. Precut tissue pieces were placed in a 2 ml microcentrifuge tube and washed twice with 100 μl PBS. Then, 0.5ml of the first extraction buffer (CE1) was added. All of the extraction buffers are supplemented with protease inhibitor cocktail from the kit. The tissue was homogenized with a Tekmar Tissumizer (Tekmar Company, Cincinnati, OH) for 5 seconds at 8,000 rpm. Lysates were filtered through a QIAshredder homogenizer, and the filtrates were mixed with an additional 0.5 ml of CE1 solution. Samples were incubated for 10 min at 4 °C with agitation and centrifuged at 4,000 g for 10 min at 4°C. Supernatants were saved (fraction C; i.e. cytoplasm) and the pellets resuspended in 1 ml of the second extraction buffer (CE2) and incubated for 30 min at 4 °C with agitation. The suspensions were centrifuged at 6,000 g for 10 min at 4°C. The supernatants (fraction M, i.e. membrane/organelle) were saved and the pellets incubated with benzonase nuclease for 15 min at room temperature. Samples were resuspended in 500 μl of the third extraction buffer (CE3) and incubated for 10 min at 4°C with agitation. Insoluble materials were removed by centrifuging at 6800 g for 10 min at 4°C and supernatants (fraction N, i.e. nuclear) were recovered.
Scheme 2.
Workflow of the differential detergent fractionation of frozen tissue. Major subcellular locations of proteins expected from enrichment are indicated under each fraction
Extracted proteins from each fraction were precipitated with acetone and resuspended in 1% SDS, 25 mM Tris-Cl pH 6.8 and protein concentrations were measured with the BCA assay (Pierce Chemicals, Rockford, IL). Fifty μg each of extracted proteins from 3 fractions were separated with SDS-PAGE. Complete lanes were excised using disposable grid cutters (The Gel company, San Francisco, CA) to produce 40 bands each, band slices were placed in 96 well plates and in-gel digested8 using an Ettan Digester (GEHealthcare,Piscataway, NJ). Digested peptides from 2–3 bands were pooled before MS analysis.
LC- MS/MS analysis
The Agilent 1100 Series Nano HPLC interfaced to a QStar XL mass spectrometer (AB Sciex, Ontario, Canada) was used for analysis. Samples were loaded onto a ZORBAX 300SB-C18 trap column (5μm, 300 Å, 0.3 mm) at a flow rate of 8 μl/min with 2% CH3CN/0.1% trifluoroacetic acid and delivered to an Acclaim 300 (C18, 3 μm, 300 Å, 75 μm i.d. × 15 cm, Dionex Coorporation, CA) nanocolumn by a switching mechanism. Peptides were eluted from the nanocolumn at a flow rate of 250 nl/min with 2% CH3CN/0.1% formic acid (solvent A) and 90% CH3CN/0.1% formic acid (solvent B). The gradients used were: 0–30 min, 5% B (desalting); 30–80 min, 5–25% B; 80–95 min, 25–90% B; 95–110 min, 90% B; 110–120 min, 90–5% B; 120–130 min, 5% B.
A nanospray voltage in the range of 2000–2400 V was optimized daily. All nanoLC MS/MS data were acquired in data-dependent acquisition mode in Analyst QS 1.1 (AB Sciex, Ontario, Canada). TOF MS survey scans with a range of 300–1600 m/z for 1 s, followed by a product ion scan with a range of 50–1600 m/z for 2 s each. Collision energy was automatically controlled by the IDA CE Parameters script.
MS Data Analysis
Once obtained, peak lists were generated from MS/MS spectra using mascot.dll in AnalystQS 1.1 and searched against IPI-mouse database ver. 3.73 using Mascot (Matrix Science) ver. 2.3 with a decoy. Fixed modification of cysteines to S-carbamidomethyl derivatives; and variable oxidation(M) and deamidation(NQ) were defined for the database search. One missed cleavage was allowed with trypsin, mass tolerance was set to 1.2 Da for precursor ions and 0.3 Da for fragment ions. 15N metabolic quantitation option was selected for each search to identify proteins originated from Exp or ISTD mice separately. Protein hits were filtered to include only those that were identified with at least two unique peptides with less than 1% false discovery rate. All proteins detected from mouse kidneys are summarized in Supplementary Table 1. The results were saved in html files and proteins identified from Exp, or ISTD were classified separately.
Quantitative Comparison among Fractions Using Normalized Spectral Index
All LC-MS/MS data were merged within each fraction depending on their experimental groups and searched with the Mascot program. Mascot search reports were exported as DTASelect.txt files to extract peptide count, spectral count and fragment-ion (tandem MS or MS/MS) intensity. The normalized spectral index values (SIN) 8 were calculated as proxies for the concentration of proteins in each sample, using the following formula:
where L = protein length, n = the number of proteins in the sample, and SI is defined as:
where pn=peptide number, sc=spectral count of the peptide k, i=fragment ion intensity of peptide k, and j=jth spectral count of sc total spectral counts for peptides identified for that protein.
Calculated SIN values were used to correlate replicates and fractions (Table 1.) and to visualize enrichment as a heat map (Figure 1.). All SIN numbers are reported as log values and those of proteins detected in each of the fractions are summarized in Supplementary Table 2.
Table 1.
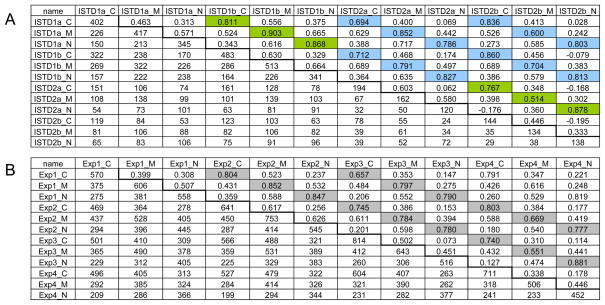
Cross correlation among fractions calculated from (A) replicates of 15N labeled kidneys. (ISTD) Technical replicates are highlighted in green and biological ones are in pale blue. (B) Multiple replicates of different Exp groups. Biological replicates are highlighted in gray. Values above the diagonal indicate Pearson correlation coefficients and below displays the number of common proteins.
|
Figure 1.
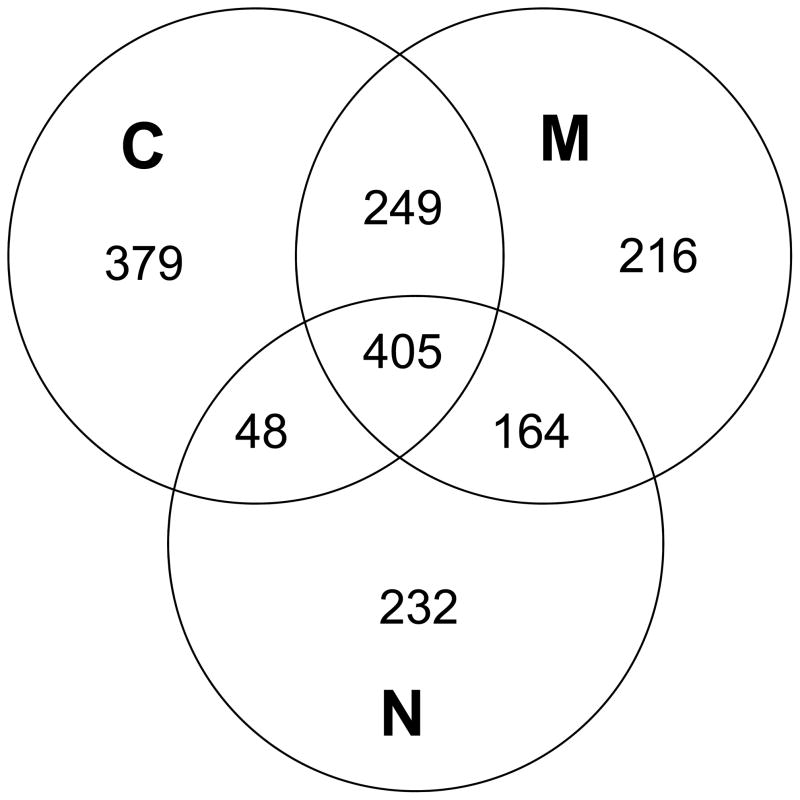
Number of proteins identified from each fraction of all groups and replicates. Common and unique proteins are divided in the Venn diagram.
Annotation of Subcellular Location
The DDF technique has been reported to enrich proteins in subcellular compartments.6, 9 To assess this enrichment effect, a new predictor called “Euk-mPLoc 2.0” was used to classify the subcellular location of the proteins identified from fractions C, M and N.10 This predictor utilizes gene ontology information, functional domain information, and sequential evolutionary information through three different modes of pseudo amino acid composition. Euk-mPLoc 2.0 classifies eukaryotic proteins into 22 different locations. In many cases, proteins are not limited to a single location and can simultaneously exist at, or move between, two or more locations. This predictor provides multiple candidate locations, which can be linked to relocation of particular proteins under different experimental conditions. Identified protein lists were uploaded to http://www.csbio.sjtu.edu.cn/bioinf/euk-multi-2/ for analysis. Subcellular location information is summarized in Supplementary Table 2. Although this predictor identifies 22 subcellular locations, we focused on the three main locations of cytoplasmic, cell membrane and nuclei to evaluate the enrichment provided by DDF fractionation of frozen tissue. Non-annotated proteins are included among the “Other” proteins which are not cytoplasmic, nuclear, or cell membrane, when calculating the percentages of subcellular location.
RESULTS AND DISCUSSION
Reproducibility of Proteomic Data from DDF-Fractionated Frozen Tissue
The number of proteins identified in all replicates from all fractions and their correlations are shown in Table 1. The SIN values were calculated to quantify the relative differences in detected proteins. SIN combines three MS abundance features: peptide count, spectral count and fragment-ion (tandem MS or MS/MS) intensity. As suggested by Schnitzer and coworkers,8 SIN largely eliminates variances between replicate MS measurements, permitting quantitative assessment of reproducibility in replicate MS measurements of the same and distinct samples. If the SIN values of proteins identified in two fractions show a high degree of correlation, this suggests that the two fractions contain similar relative concentrations of these proteins. On the other hand, a lower correlation can result from a significantly different relative concentration of proteins. Pearson correlation coefficients (r) were calculated using SIN and the number of proteins common to adjacent fractions (Table 1). There are two tables describing the results utilizing the technical replicates (ISTD 1a and 1b; or ISTD 2a and 2b -Table 1A) and the biological replicates (Exps in Table 1B). Kidney tissue from different ISTD mice were used in different iterations of the experiments shown in Scheme 1, and as such are biological replicates of each other, i.e. ISTD 1 and ISTD 2.
Technical variability was addressed based on the correlation between proteins identified in each of the two experiments (noted as ISTD 1a and 1b; or ISTD 2a and 2b in Table 1A). The r values in Table 1A reflect the technical variability, average r (<r>)= 0.790 in all three fractions (highlighted with green), suggesting that the DDF method has relatively good reproducibility. The repeat experiment employed a different ISTD kidney from the first group, adding to the assessment of biological variability. The correlation coefficients between ISTD1 and ISTD2 (highlighted with pale blue) are slightly lower than the technical replicates (<r>=0.773), but still show good reproducibility for the DDF method.
Reproducibility among the other biological replicates was also assessed with Pearson correlation coefficients (Table 1B). Most of the proteins were detected somewhat evenly across all experimental, biological, and technical replicates. This resulted in an average r value of 0.765 (highlighted in grey), substantiating the reproducibility of the method.
The correlation among different fractions is significantly lower than that of replicates for each fraction. For C vs. M, M vs. N, and C vs. N fractions, the average <r> values are 0.464, 0.508, and 0.204, respectively. This suggests that relative protein concentration and protein distributions, as measured by SIN, are significantly different across fractions.
Overall, this analysis permits us to conclude that DDF applied to frozen kidneys is clearly capable of reproducibly separating proteins among fractions. Extracting proteins from samples reproducibly is critical for subsequent differential proteomic studies. As reported by Butt and coworkers, manual homogenization often does not reproducibly extract proteins into solutions from frozen tissues.11 DDF provides a simple but reproducible alternative over automated mechanical disruption which can improve proteomic analysis.
The Enrichment Effect of DDF
To evaluate the efficiency of the method in fractionating components, the number of proteins detected in each fraction and their overlaps are plotted as Venn diagrams. As seen in figure 1, 1081, 1034, and 849 proteins were detected in the C, M, and N fractions, respectively. Of the 1,693 proteins detected, 24% (405) were present in all fractions, additional 27% (461) proteins were identified in two fractions, and almost half of the proteins (827) were detected in only one fraction. These results are consistent with the report by Murray and coworkers,12 who attempted to isolate nuclear proteins from frozen tissues by DDF and compared this to density gradient separation. They found that DDF was somewhat limited for isolating nuclear proteins (10–12%), though our results show a slightly higher nuclear enrichment.
In order to determine whether the proteins extracted in each fraction correspond to distinct subcellular compartments, all proteins detected were assigned to subcellular locations using a prediction algorithm called “Euk-mPLoc 2.0”.10 This method combines existing gene ontology information with sequence information. Many of the proteins detected in this study are located in multiple sites, but our analysis focused only on cytoplasmic, cell membrane and nuclear locations. 1,054 out of 1,693 proteins were annotated and are shown with their SIN values in Supplementary Table 2.
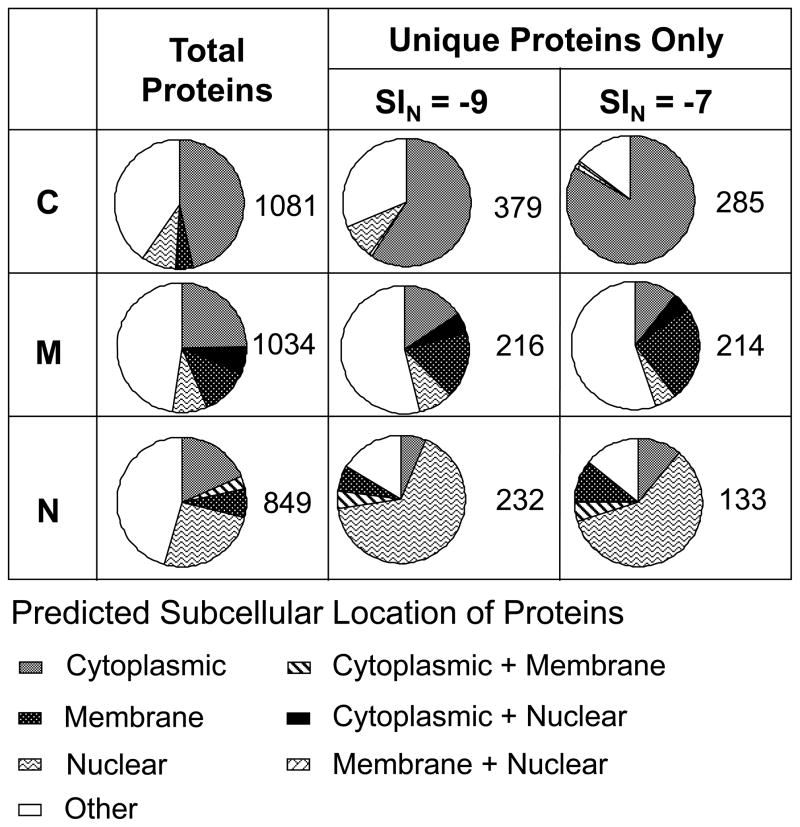
A summary of the subproteome in each fraction based on predicted subcellular location is displayed in figure 2 (first column- total proteins). To evaluate the compartmental enrichment effect, any proteins with multiple predicted locations which includes cytoplasmic localization was assigned to cytoplasm for C; those with membrane localization to membrane for M; and those with nuclear localization to nuclear for N. As is shown in Figure 2, 47% of proteins in C fraction belong to cytoplasmic location, 12% of M fraction to cell membrane, and 26% of N fraction to nuclear. Looking at the overall analysis of each fraction, enrichment is present, but is not remarkable. To further understand the differences in the cellular annotation of the three fractions, we examined the most abundant proteins found in all fractions and the proteins unique to each fraction.
Figure 2.
Relative subcellular distributions of identified proteins in each fraction are shown as pie charts. First column displays total proteins in each fraction and the second and third column illustrate the changes upon applying SIN cutoff of −9 and −7. Unique proteins were obtained by removing all the proteins detected in more than one fraction from each fraction. Numbers of corresponding proteins are displayed next to each pie chart. Higher cutoff increases percentages of cytosolic proteins in C and Membrane proteins in M.
Subcellular Annotation and enrichment of the 175 Most Abundant Proteins Common to All Fractions
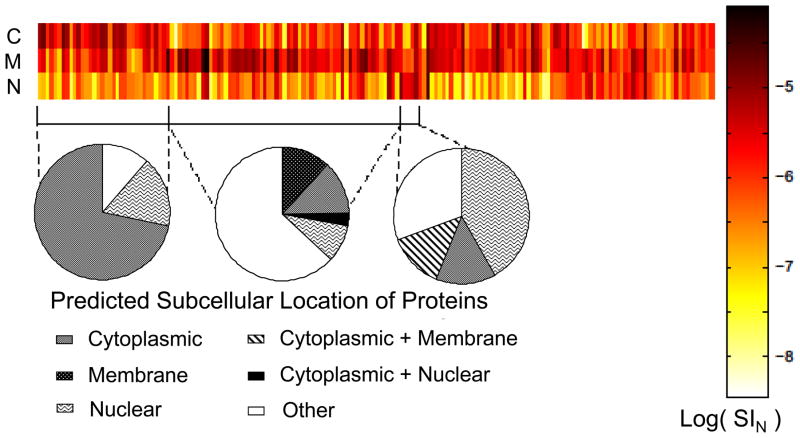
Among the annotated proteins, the 175 most abundant proteins detected in all replicates and fractions were compared. To perform this comparison, a heat-map was constructed of the SIN values across the fractions (Fig. 3). All the replicates were pooled together in the map, resulting in one bar for each of the 3 fractions. As is shown in the heat map (Fig. 3.), C, M and N all show enrichment of a specific group of proteins. This strengthens the findings deduced from correlation studies in Table 1. Areas of enrichment in each fraction are bracketed below the heat map. Relative subcellular distributions are displayed as pie charts under each bracket to evaluate the subcellular location of enriched proteins. Enrichment of cytosolic proteins in C (71%) is the most obvious trend, followed by nuclear protein enrichment in N(42%). Even though 12% of enriched proteins in M are identified to be from cell membranes, a significant number of proteins are assigned to others, with 34% being mitochondrial in origin (deduced from the Supplementary table 2). This indicates a notable enrichment effect among high abundance proteins and shows the extent of enrichment in extracting different subcellular compartments with DDF. Only a small number of nuclear proteins are enriched among the most abundant proteins described in the heatmap. It does not necessarily mean that the nuclear proteins are not enriched. Rather, this indicates that the proteomic profile of N is unique and that the nuclear proteins detected are primarily among the less abundant proteins.
Figure 3.
Heat map visualizing the relative distribution of the 175 most abundant proteins detected in all three fractions of all groups and replicates. C, M, and N fractions show selective enrichment. Relative subcellular distributions are shown as pie charts under each bracketed area of enrichment. All biological replicates were pooled.
Subcellular Annotation of Proteins Unique To Each Fraction
1,693 proteins were detected from mouse kidneys in this study. (Supplementary Table 1). Many of these proteins were detected in multiple fractions due to partial separation as well as possible coexistence in several compartments. In contrast, there were many proteins identified in only a single fraction. The capability of DDF to enrich distinctive subcellular proteins is more obvious among these uniquely identified proteins. As is shown in Figure 2(See the middle column under SIN=−9), 59% of proteins uniquely identified from C are located in the cytoplasm, 17% of the proteins in M were designated as cell membrane proteins, and 66% of proteins in N as nuclear proteins.
In some cases, the unique detection could have been due to the complexity of the samples which may lead to difficulties in replication of data dependent acquisition.13 In general, low abundance proteins are more prone to this irreproducible replication. However, it should be noted that many of these single fraction proteins had relatively high SIN values, which signifies their high abundance, and may indicate that the unique detection was not an artifact due to their low abundance. This effect can be visualized as pie charts made with different SIN cutoffs (Figure 2). If one assumes that all uniquely detected proteins in this diagram are artifacts due to their low abundance, then removing low abundance proteins should not affect the relative subcellular distributions of uniquely identified proteins. However, filtering out low abundance proteins by raising the SIN cutoffs from −9 to −7 (Fig. 2) clearly demonstrates an opposite trend. Distribution of the subcellular annotation changed noticeably among the uniquely identified proteins in each fraction. The C fraction underwent the most apparent change and increased relative distribution of cytoplasmic proteins to 83%. In addition, mitochondrial proteins in “other” category among the M unique proteins (214) also rose from 20% to 25% (Deduced from Supplementary table 2), similar to what was observed in a pie chart under M enriched proteins in Figure 3. This may have been facilitated by selective mitochondrial membrane permeabilization and extracting proteins anchored on mitochondrial membrane. Relative distribution of nuclear proteins decreased slightly but still stayed significantly enriched. Some other unique proteins that survived SIN filtering in Fig. 3B are also known to be localized in specific subcellular locations. For example, many histone family proteins, the major component of chromatin localized in nuclei, are detected only in the N fraction, which strengthens the observation that N is enriched in nuclear proteins.14 Interestingly, some TIM proteins,15 mitochondrial import inner membrane translocases, known to be attached to mitochondrial membranes were identified with high SIN values in M fractions only. Overall, the results confirm that DDF shows reasonable enrichment from different cellular compartments. Some of these unique proteins, specific to certain compartments and with relatively low abundance would likely not have been detected in whole cell extracts without DDF, because their signals would be largely suppressed by those of more abundant proteins, particularly cytosolic proteins.
Successful separation of proteins from any samples for proteomic analysis can be evaluated by its reproducibility and efficiency to separate out a group of related proteins. The results described above support the reproducibility and efficiency of the DDF method applied to frozen tissues. As long as the location information is assessed within the limits of the method, it is possible to extend this experimental approach to the extraction of any tissue type in a reproducible manner. To achieve this, all fractions from target tissues need to be subjected to the analysis to define unique proteins in each fraction.
CONCLUSION
In this study, we demonstrated that DDF of frozen tissue combined with proteomic investigation can provide robust subcellular information and improve the dynamic range of proteomic analysis. Its high degree of reproducibility is supported by extensive bioinformatic analysis of multiple data sets. The capability of DDF to enrich proteins depending on their subcellular locations has been supported by utilizing a prediction system combined with GO annotation. This approach opens up the exciting possibility of global proteomic studies of archival frozen tissue from many patients or archived biological samples. Many archival frozen tissues from patients are directly connected to disease states. Often such archival tissues are available in very limited amounts, making extensive multiple fractionation methods unfeasible. The present method provides a quick and simple alternative to reliance solely on fractionation of proteins or peptides digested from solubilized tissue. In addition, it provides data on subcellular location, which can be linked to immunohistochemical information. Global proteomic information with annotation of subcellular compartments linked to histopathological information can provide a powerful method for understanding the biological processes involved in disease. In addition, many proteins are known to coexist in multiple subcellular locations and relocalize depending on disease state or a variety of other stimuli. For example, many heat shock proteins are known to change their subcellular location in response to stress without changing their expression level.16–18 It would be difficult to make this type of observation based only on proteomic data obtained from whole cell extracts. DDF of frozen tissue can be a practical tool to investigate this type of situation without losing the advantages of global proteomics.
Supplementary Material
Complete list of all proteins identified from this study
List of all proteins with subcellular annotation and SIN values
Acknowledgments
This work was supported by National Institute on Drug Abuse (P20DA026149-03), National Institute of Allergy and Infectious Diseases (AI31788) and National Institute of Diabetes and Digestive and Kidney Diseases (P01DK041918-19).
Footnotes
Supporting Information Available: List of all proteins detected and proteins with subcellular annotation and quantitation information. The data associated with this manuscript may be downloaded from ProteomeCommons.org Tranche using the following hash:
qI6ETC6jzWWwB9aF2jjEwPfoq35c7JmpzTkse81uHGVr3e6wDFpnuwiDulZshgPZ79LYj4r9wTgkWIdwgoPTweOFfKQAAAAAAACtIA==
Publisher's Disclaimer: This is a PDF file of an unedited manuscript that has been accepted for publication. As a service to our customers we are providing this early version of the manuscript. The manuscript will undergo copyediting, typesetting, and review of the resulting proof before it is published in its final citable form. Please note that during the production process errors may be discovered which could affect the content, and all legal disclaimers that apply to the journal pertain.
References
- 1.Qian WJ, Jacobs JM, Liu T, Camp DG, Smith RD. Advances and challenges in liquid chromatography-mass spectrometry-based proteomics profiling for clinical applications. Molecular & Cellular Proteomics. 2006;5(10):1727–1744. doi: 10.1074/mcp.M600162-MCP200. [DOI] [PMC free article] [PubMed] [Google Scholar]
- 2.Taylor SW, Fahy E, Ghosh SS. Global organellar proteomics. Trends in Biotechnology. 2003;21(2):82–88. doi: 10.1016/S0167-7799(02)00037-9. [DOI] [PubMed] [Google Scholar]
- 3.de Hoog CL, Mann M. Proteomics. Annual Review of Genomics and Human Genetics. 2004;5:267–293. doi: 10.1146/annurev.genom.4.070802.110305. [DOI] [PubMed] [Google Scholar]
- 4.Ramsby ML, Makowski GS. Differential Detergent Fractionation of Eukaryotic Cells: Analysis by Two-Dimensional Gel Electrophoresis. In. Methods in Molecular Biology. 1998:53–66. doi: 10.1385/1-59259-584-7:53. [DOI] [PubMed] [Google Scholar]
- 5.Lee YH, Tan HT, Chung MCM. Subcellular fractionation methods and strategies for proteomics. Proteomics. 2010;10(22):3935–3956. doi: 10.1002/pmic.201000289. [DOI] [PubMed] [Google Scholar]
- 6.van den Berg BHJ, Harris T, McCarthy FM, Lamont SJ, Burgess SC. Non-electrophoretic differential detergent fractionation proteomics using frozen whole organs. Rapid Communications in Mass Spectrometry. 2007;21(23):3905–3909. doi: 10.1002/rcm.3287. [DOI] [PubMed] [Google Scholar]
- 7.Wu CC, MacCoss MJ, Howell KE, Matthews DE, Yates JR. Metabolic labeling of mammalian organisms with stable isotopes for quantitative proteomic analysis. Analytical Chemistry. 2004;76(17):4951–4959. doi: 10.1021/ac049208j. [DOI] [PubMed] [Google Scholar]
- 8.Griffin NM, Yu JY, Long F, Oh P, Shore S, Li Y, Koziol JA, Schnitzer JE. Label-free, normalized quantification of complex mass spectrometry data for proteomic analysis. Nature Biotechnology. 2010;28(1):83–U116. doi: 10.1038/nbt.1592. [DOI] [PMC free article] [PubMed] [Google Scholar]
- 9.Bernocco S, Fondelli C, Matteoni S, Magnoni L, Gotta S, Terstappen GC, Raggiaschi R. Sequential detergent fractionation of primary neurons for proteomics studies. Proteomics. 2008;8(5):930–938. doi: 10.1002/pmic.200700738. [DOI] [PubMed] [Google Scholar]
- 10.Chou KC, Shen HB. A New Method for Predicting the Subcellular Localization of Eukaryotic Proteins with Both Single and Multiple Sites: Euk-mPLoc 2.0. Plos One. 2010;5(3) doi: 10.1371/journal.pone.0009931. [DOI] [PMC free article] [PubMed] [Google Scholar]
- 11.Butt RH, Coorssen JR. Pre-extraction sample handling by automated frozen disruption significantly improves subsequent proteomic analyses. Journal of Proteome Research. 2006;5(2):437–448. doi: 10.1021/pr0503634. [DOI] [PubMed] [Google Scholar]
- 12.Murray CI, Barrett M, Van Eyk JE. Assessment of ProteoExtract subcellular fractionation kit reveals limited and incomplete enrichment of nuclear subproteome from frozen liver and heart tissue. Proteomics. 2009;9(15):3934–3938. doi: 10.1002/pmic.200701170. [DOI] [PMC free article] [PubMed] [Google Scholar]
- 13.Domon B, Aebersold R. Options and considerations when selecting a quantitative proteomics strategy. Nature Biotechnology. 2010;28(7):710–721. doi: 10.1038/nbt.1661. [DOI] [PubMed] [Google Scholar]
- 14.Jenuwein T, Allis CD. Translating the histone code. Science. 2001;293(5532):1074–1080. doi: 10.1126/science.1063127. [DOI] [PubMed] [Google Scholar]
- 15.Neupert W, Herrmann JM. Translocation of proteins into mitochondria. Annual Review of Biochemistry. 2007;76:723–749. doi: 10.1146/annurev.biochem.76.052705.163409. [DOI] [PubMed] [Google Scholar]
- 16.Parsell DA, Lindquist S. The function of heat-shock proteins in stress tolerance - degradation and reactivation of damaged proteins. Annual Review of Genetics. 1993;27:437–496. doi: 10.1146/annurev.ge.27.120193.002253. [DOI] [PubMed] [Google Scholar]
- 17.Dempsey NC, Leoni F, Ireland HE, Hoyle C, Williams JHH. Differential heat shock protein localization in chronic lymphocytic leukemia. Journal of Leukocyte Biology. 2010;87(3):467–476. doi: 10.1189/jlb.0709502. [DOI] [PMC free article] [PubMed] [Google Scholar]
- 18.de Miguel N, Echeverria PC, Angel SO. Differential subcellular localization of members of the Toxoplasma gondii small heat shock protein family. Eukaryotic Cell. 2005;4(12):1990–1997. doi: 10.1128/EC.4.12.1990-1997.2005. [DOI] [PMC free article] [PubMed] [Google Scholar]
Associated Data
This section collects any data citations, data availability statements, or supplementary materials included in this article.
Supplementary Materials
Complete list of all proteins identified from this study
List of all proteins with subcellular annotation and SIN values


