

Abstract
S-nitrosylated proteins are biomarkers of oxidative damage in aging and Alzheimer’s disease (AD). Here, we report a new method for detecting and quantifying nitrosylated proteins by capillary gel electrophoresis with laser induced fluorescence detection (CGE-LIF). Dylight 488 maleimide was used to specifically label thiol group (SH) after switching the S-nitrosothiol(S-NO) to SH in cysteine using the “fluorescence switch” assay. In vitro nitrosylation model-BSA subjected to S-nitrosoglutathione(GSNO) optimized the labeling reactions and characterized the response of the LIF detector. The method proves to be highly sensitive, detecting 1.3 picomolar (pM)concentration of nitrosothiols in nanograms of proteins, which is the lowest limit of detection of nitrosothiols reported to date. We further demonstrated the direct application of this method in monitoring protein nitrosylation damage in MQ mediated human colon adenocarcinoma cells. The nitrosothiol amounts in MQ treated and untreated cells are 14.8±0.2 and 10.4±0.5 pmol/mg of proteins, respectively. We also depicted nitrosylated protein electrophoretic profiles of brain cerebrum of 5-month-old AD transgenic (Tg) mice model. In Tg mice brain, 15.5±0.4 pmol of nitrosothiols/mg of proteins was quantified while wild type contained 11.7±0.3 pmol/mg proteins. The methodology is validated to quantify low levels of S-nitrosylated protein in complex protein mixtures from both physiological and pathological conditions.
Keywords: S-nitrosylation, Fluorescence switch assay, CGE-LIF, Alzheimer’s disease transgenic mice model
1. Introduction
S-nitrosylation (also referred to as nitrosation) of protein is a post translational modification (PTM) of thiols on cysteines [1]. It is essential in cellular function and signaling regulation [2–6] and serves as biomarkers in many diseases including Alzheimer’s disease, Parkinson’s disease, Huntington’s disease, diabetes, and stroke[7–11]. There are four major mechanisms to potentially form the nitrosothiol (SNO) group in a biological system: (1) Nitric oxide (NO) can react with O2 to form dinitrogen trioxide (N2O3), which is considered to be the main S-nitrosylating species due to its powerful electrophilicity [2]. (2) Peroxynitrite (ONOO−), the product between NO and superoxide (O2−), can react with thiols to form S-nitrosothiols [5,12]. (3) Transnitrosylaton between glutathione (GSH) and RSNO, leads to the formation of S-nitrosoglutathione (GSNO)[5,13,14]. (4) S-Nitrosothiols can be formed from the reaction of nitrous acid (HONO) with thiols in an acidic environment, potentially occurring in the gastro-intestinal tract[15,16]. However, it is not clear which of these mechanisms more closely resemble in vivo physiological S-nitrosylation [17].
Currently, a number of “indirect” methods are used for quantitative measurement of nitrosothiols, which either require cleavage of the S-NO bond followed with NO level measurement or replacement of the S-NO with another detectable tag. One widely utilized method is the colorimetric Saville assay[18]. NO+ is displaced from the thiol by mercuric chloride in the presence of sulphanilamide and then reacts with N-(1-naphyl)-ethylenediamine. The reaction product, a colored azo dye, can be detected spectrophotometrically at 540nm [21]. This method has a limit of detection (LOD) around 500 nM[19]. However, this LOD is above physiological levels of nitrosothiols, which limits the technique’s application to quantitative studies of nitrosothiols from biological samples.
Chemiluminescence assay has also been developed for S-NO measurement [20]. After cleavage of the S-NO bond through either photolysis or chemical reduction, the released NO reacts with ozone to form the NO2*, which decays to NO2 with production of light. This method has good sensitivity with an LOD of 2 picomoles[20]. However, the technical challenges lie on equal mixing of the test gas flow with the ozone[19]. Additionally, although the photolysis method consistently gives quantitative measures, the NO yields by chemical tri-iodide reduction chemiluminescence assay are generally low and difficult to reproduce[21].
A fluorescence method for the indirect detection of SNOs spectrofluorometryto measure the status of NO has also been reported[22,23]. The S-NO bonds are cleaved with HgCl2 and the newly formed NO is monitored from its reaction with 4, 5-diaminofluorescein (DAF) to yield a fluorescent triazolofluoroscein(excitation/emission=485/520 nm)[20]. The LOD of this method reaches 5nM [22].
Accurate and sensitive methods to detect and quantify low levels of S-nitrosylated proteins in complex protein mixtures from both physiological and pathological conditions are required in order to fully understand the range and extent of this modification. In this paper, we develop a new quantitative method to detect SNOs by capillary gel electrophoresis with laser induced fluorescence detection (CGE-LIF). Among the commercial detection modes developed for CE,
LIF is one of the most sensitive detection techniques [24]. Here, a “fluorescence switch” method derived from the “biotin switch assay” is used to label the nitrosothiols [25,26]. The procedure consists of the derivatization of nitrosothiols into free sulfhydryl groups followed by specific labeling of sulfhydryl-containing proteins with Dylight 488 maleimide (Ex/Em = 493/528 nm). The derivatization process includes alkylation with methyl-methanethiosulfonate (MMTS) to block all sulfhydryl groups followed by the reduction of nitrosothiols to newly formed sulfhydryl groups. Then the Dylight 488 fluorophore labelsnitrosylated proteins, which are monitored using CGE-LIF. This procedure proves to be adequate for analyzing nanogram amounts of protein samples with picomolarlevels of nitrosothiols in less than 15 minutes.
In this study, we also demonstrate the direct application of the abovementioned method in monitoring oxidative protein nitrosylation damage mediated by menadione (MQ), a redox cycling quinone in human colon adenocarcinoma cells (HT29). MQ has the redox-cycling capacity to acrylate cellular nucleophiles such as DNA and proteins, with mitochondrion considered as the main redox site. MQ can mediate apoptosis through formation of the toxic species, the semiquinone (SQ.) radical, which is formed by mitochondrial NADPH-ubiquinone oxidoreductase (ubQO) through one-electron metabolism. The SQ. can then participate in redox cycling through reaction with O2 to generate the superoxide anion (O2.−) and concomitantly regenerate MQ[27–29]. Our electropherogram results indicated that a wide distribution of molecular weight (MW) of proteins were nitrosylated. In addition, it is observed that exposure to MQ caused an increase in protein nitrosylation damage.
We also examined the nitrosylation level in a minuscule amount of brain cerebrum tissue from an Alzheimer’s disease (AD) transgenic mice model (B6Cg-Tg). Carrying both the Swedish amyloid precursor protein mutation (APP) and exon 9 deletion of the PSEN1 gene, the B6Cg-Tg mouse is a valuable model to study the pathological alterations in AD. It develops amyloid plaques at 6–7 months of age. Our results not only depicted an electrophoretic profile of nitrosylated proteins in brain tissue, but also proved a capability of analyzing very minuscule amount of tissue using the CGE-LIF method.
2. Material and methods
2.1. Materials and reagents
2-[4-(2-hydroxyethyl)piperazin-1-yl]ethanesulfonic acid(HEPES), sodium dodecyl sulfate (SDS), tris (hydroxymethyl)-aminomethane, tricine, (+)-sodium L-ascorbate, ethylenediaminetetraacetic acid (EDTA), albumin bovine serum (BSA), methanol, sodium hydroxide, hydrochloric acid, neocuproine, S-methyl methanethiosulfonate (MMTS), dextran from Leuconostocmesenteroides(average MW 64,000–76,000), trichloroacetic acid (TCA) were all purchased from Sigma. Amicon ultra-4 (MW cutoff of 3000 Da) was from Millipore. DyLight 488 Maleimide and dimethyl sulfoxide (DMSO) was from Thermo Scientific. Ultra Trol Dynamic Pre-Coat LN was obtained from Target Discovery. Sulphanilamide was purchased from Alfa Aesar. N-1-Naphthylethylenediamine hydrochloride was obtained from TCI. S-Nitrosoglutathione(GSNO) was purchased from Calbiochem. The bicinchoninic acid (BCA) assay was from Pierce. HEN buffer was composed of 250mM HEPES, 1 mM EDTA, and 0.1 mM neocuproine at pH 7.7. HENS buffer was prepared in HEN buffer with the addition of 1% SDS. The separation buffer consisted of 20mM Tris, 20mM Tricine, 0.5% SDS at pH 8. The sieving matrix buffer was prepared in the separation buffer with 15% dextran.
2.2. Capillary electrophoresis with laser induced fluorescence detection
A commercial capillary electrophoresis instrument, Beckman Coulter P/ACE MDQ system (Fullerton, CA) was used for the analysis of protein nitrosylation. For excitation, the LIF detector used an argon-ion laser (488nm line, 3 MW) that was directed to a detector window in the capillary using fiber optics. A 520DF20 bandpass filter (~510–530 nm) was used to select the Dylight 488 fluorescence before the photo-multiplier tube (PMT). The PMT output signals were sampled at 4 Hz.
Separations were carried out using a 31-cm-long, 50-μm-i.d., 361-μm-outer-o.d. fused-silica capillary. UltraTrol LN, a class of linear polyacrylamide made of N-substituted acrylamide copolymers, was used for precoating the capillary walls. This procedure decreases the electroosmotic flow (EOF) and inhibits protein binding to the inner wall of the capillary. The sample was injected hydrodynamically at 11 kPa for 4 seconds into the capillary containing the sieving matrix buffer. Separations were performed at −570 V/cm. The capillary was reconditioned between consecutive runs with sequential pressure-driven flushes (20 psi) of 0.5 M sodium hydroxide for 5 min, H2O for 3 min, the dynamic coating reagent UltraTrol LN for 2 min, the separation buffer for 2 min, and the sieving matrix buffer for 4 min[30,31].
2.3. In vitro nitrosylation of BSA and SNO quantification by Saville-Griess assay
GSNO can react with thiol groups to yieldnitrosothiols. Briefly, BSA solution (7.5mg/mL) was incubated with the NO donor GSNO (500μM) in darkness for 30 minutes with constant rotating [32]. Nitrosylated protein level from the in vitro BSA test model was quantified using Saville-Griess assay. Briefly, mercury displacement of NO from nitrosylated BSA was achieved by 10 min of incubation with 100 μM mercury chloride. The remaining GSNO was removed via dialysis. Nitrite levels were determined spectrophotomically after reaction with 100 μL of Griess reagent (1:1 mixture of 3% sulfanilamide in 0.4M HCl and 0.1% N-(1-naphthyl)ethylenediamine in 0.4M HCl) and quantified using absorbance at 540 nm and extinction coefficient of 51 mM−1cm−1[33,34].
2.4. Cell culture and incubation with MQ
The human colon epithelial adenocarcinoma cell line HT-29, was purchased from the American Type Culture Collection (Manassas, VA, USA). HT-29 cells were grown in McCoy’s medium supplemented with 10% fetal bovine serum, penicillin (100 units/mL), and streptomycin (100 units/mL). HT-29 cells were maintained at 37°C in 5% CO2 humidified incubator. One day prior to experimentation, HT-29 cells were plated in T75 flasks and exposed to 200μM MQ for 30min in serum-free DMEM (Dulbecco’s Modified Eagle’s medium). Thereafter, cells were washed and scrapped into cold-PBS. The resulting pellet obtained upon centrifugation at 1000rpm was immediately frozen in liquid nitrogen and used for further analysis of nitrosylated proteins.
2.5. Protein extraction from MQ treated cells
HT-29 cells were washed five times with phosphate-buffered saline (PBS) and resuspended in 100 μL water. The cells were sonicated for 20 s in the power level of 4 (550 Sonic Dismembrator from Fisher Scientific). The suspension was centrifuged at 600×g for 10 min. A 40μL aliquot of the supernatant was then used for “fluorescence switch” assay. The untreated HT-29 cells followed the same procedure. The protein concentration was measured by the BCA assay.
2.6. Isolation of brain cerebrum from AD transgenic mice model
The cerebrum was isolated from the brain of 5-month old transgenic mice (B6Cg-Tg) and its age-matched wild type (WT) control. Briefly, the cerebrum was minced with scissors and suspended in isolation buffer (320mM Sucrose, 10mMHepes, 1mM EDTA). The minced tissue was homogenized and 100μL homogenate of each sample (Tg and WT) was added with 40μL 20% TCA followed with incubation for 10 min at 4°C. After that, the solution was centrifuged at 10000×g for 5 min at 4°C and the supernatant was discarded. The protein pellet was mixed with 50μL HENS buffer.
2.7. Fluorescence switch assay
This procedure consists of the derivatization of SNOs into free sulfhydryl groups followed with highly sensitive specific labeling of sulfhydryl-containing proteins with Dylight 488 maleimide (as shown in Figure 1). As the S-NO bond is light sensitive all the experimental procedures were conducted in the dark[5,32,35]. Briefly, for the labeling reaction, a volume of 5μL nitrosylated BSA prepared in vitro was incubated with 20μL blocking buffer (9 volumes of HEN buffer, 1 volume of 25% SDS, 0.1 volumes of 2 M MMTS stock solution in N, N-dimethylformamide) at 50°C for 30 min with frequent rotating. To remove the excess MMTS, an Amicon Ultra-4 centrifugal filter unit (3000MW cut-off) was used. The sample was centrifuged for three times at 4500×g for 20 min with the washing solvent, HEN buffer. The final volume after wash was around 60μL. Then 2μL freshly prepared 50m Mascorbate was added to reduce the nitrosothiol groups to thiols and the incubation lasted for 1 hour at room temperature. For labeling the newly reduced free thiol groups generated from the last reduction step, 4μL of 12.5mM Dylight 488 maleimide was added into the solution and the reaction proceeded overnight at room temperature. To remove the unreacted Dylight 488 maleimide dye from the sample, the sample was centrifuged for a total of six times at 4500×g for 20 min using the Amilcon filter with 3000 MW cut-off [36,37]. The washing solvent was the CE separation buffer. After removal of excessive dye, 5μL of 20% SDS in separation buffer was added into a final volume around 100μL to saturate proteins. The derivatized and fluorophore labeled solution was then diluted to 1, 0.5, 0.25, and 0.1 of the original concentration with separation buffer.
Figure 1.
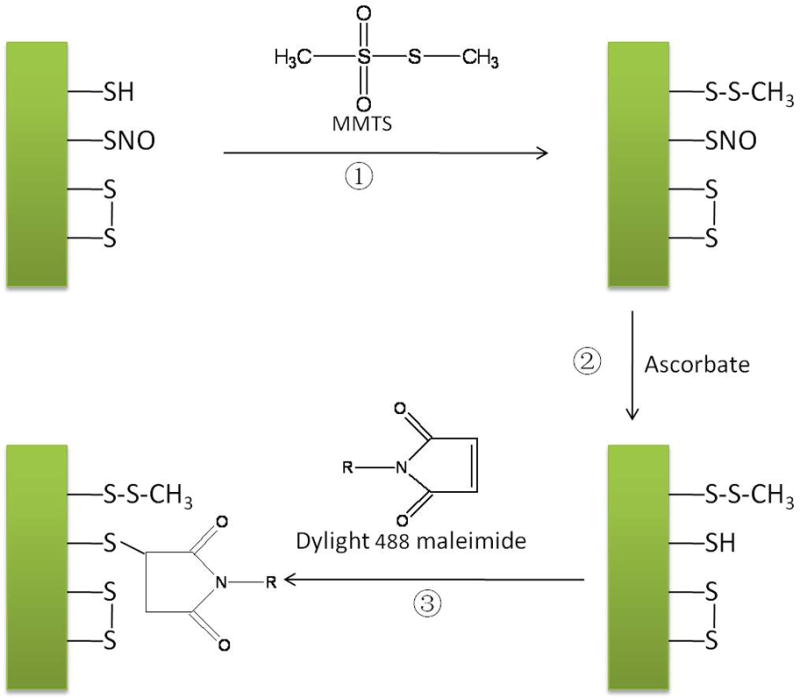
(A) Schematic of fluorescence switch assay coupled with CGE-LIF for detecting and quantifying S-nitrosylated proteins. Fluorescence switch assay (Steps 1–3) includes blocking thiol group by MMTS, reducing nitrosothiol group with ascorbate and labeling reduced free thiol by Dylight 488 maleimide. Finally, labeled proteins are separated and analyzed by CGE-LIF.
The procedure for nitrosylation labeling in HT-29 cells and B6Cg-Tg mice with Dylight 488 maleimide was basically the same as the nitrosylated BSA, except for the use of 40μL of from both HT-29 cells and B6Cg-Tg mice cerebrum. The selectivity of labeling nitrosothiols using this “fluorescence switch assay” was studied by incubating nitrosylated BSA with mercury chloride to displace the NO group prior to the procedure of the assay. Also, fluorescence switch assay without proteins and untreated BSA as a negative control was performed individually with “fluorescence switch assay” and CGE-LIF to validate the specificity of the assay to SNOs.
2.8. Data analysis for CE
In this report, we used Igor Pro software (Wavemetrics, Lake Oswego, OR) to analyze electropherograms, which provides intensity values at each migration time point. The integrated fluorescence peak areas were measured to calculate the nitrosylated protein amounts using the in-house-written Igor procedure, Wide Peak Analysis [30].
2.9. Validation of nitrosylated proteins CE peaks using proteomics
The biotin switch assay was performed as described by Jaffrey and Snyder[36]. Briefly, the protein concentration was adjusted to 0.8 μg/μL using HEN Buffer(250 mMHepes/NaOH pH 7.7, 1 mM EDTA, 0.1 mMneocuproine) and then incubated at 50 °C for 30 min in blocking buffer (9 volumes of HEN buffer, 1 volume of SDS (25% w/v in H2O) and MMTS added to a final concentration of 20 mM) with frequent vortexing. Acetone precipitation was performed to remove MMTS. The protein pellet was resuspended in 0.1 mL HENS solution (HEN Buffer in 1% SDS) per mg protein, followed by incubation with 2mM biotin-HPDP and 2 m Mascorbate for 1h at 25 °C. After biotinylation to label S-nitrosylated proteins, biotin-HPDP was removed by acetone precipitation and centrifugation, and the pellet was resuspended in HENS buffer as above. The proteins were then trypsin digested overnight and the resulting peptides were desalted in a mixed-mode cation exchange column (MCX; Waters) followed by Sep-Pak reverse-phase extraction prior to LC-electrospray ionization (ESI) MS/MS analysis[38].
For identifying nitrosylated proteins, the sample was divided into three equal portions and analyzed by LC-MS/MS. Peptide mixtures were first separated on an Agilent 1200 Capillary Series liquid chromatograph (Agilent Technologies, Palo Alto, California, CA), and identified via μLC-ESI MS/MS on a hybrid linear ion trap-Orbitrap mass spectrometer (LTQ-Orbitrap XL; Thermo Electron, San Jose, CA). MS/MS spectra were acquired in a data-dependent acquisition mode that automatically selected and fragmented the 5 most intense peaks by higher-energy collisional dissociation (HCD) from each MS spectrum generated.
MS/MS spectra were searched human International Protein Index protein sequence data base (version 3.74, 39,906 protein sequences; European Bioinformatics Institute). The dataset, built from the Swiss-Prot, TrEMBL, Ensembl and RefSeq databases, offers complete nonredundant data sets representing the human proteomes[39]. The database searching was performed using Proteome Discovery (version 1.0, Thermo Fisher, San Jose, CA) and Mascot (version 2.2.02, Matrix Science, London, UK) with the following parameters: trypsin as digestion enzyme, Methylthiolation (C), Oxidation (M) and Biotin-HPDP (C) were set as variable modifications.
3. Results and discussion
3.1. Fluorescence switch assay coupled with CGE-LIF
The Dylight 488 maleimide was used to label the reduced nitrosothiol group after blocking the free thiols in the nitrosylated proteins. The mechanism of this method resembles “Biotin Switch Assay”, which is widely used in the study of nitrosylation proteomics using mass spectrometry [36]. One possible question in “fluorescence switch assay” is the possibility of nonspecific reduction of SNOs by ascorbate. In this regard, Giustarini et al. have expressed concern that the ascorbate treatment may reduce 5,5’-dithiobis (2-nitrobenzoic acid) (DTNB)and the protein mixture, giving rise to a significant false-positive signal[40]. However, most recently Forrester et al. challenged this opinion with the following reasons: first, DTNB is not representative of biological disulfides since its disulfide bonds are highly electrophilic. The high electrophilic bonds can be facilitated by ascorbate[41]. Second, ascorbate could not reduce intramolecular protein disulfides under denaturing conditions, even if protein mixture disulfides may be cleaved by ascorbate[40]. Third, the reduction of disulfide bonds by ascorbate is highly thermodynamically unfavorable since the oxidation-reduction potential of cysteine (CSH)/cystine (CSSC) is found to be −220 mV and that of the ascorbic acid is 70 mV[42,43]. Lastly, Giustarini et al. did not perform the biotin switch assay. However, Forrester et al. revealed that the reduction of ascorbate to the S-NO bond is unique among Cys oxidation products after biotin switch and the authors conclude that this reaction confers specificity to the biotin switch assay[44], as evidenced by previous reports [3,41]. Therefore, ascorbate does not significantly influence the selectivity of this method. In addition, ascorbate is unstable, and the dehydroascorbate that forms by oxidation rapidly decompose to small sugars, such as trioses. Hence, freshly prepared ascorbate solution was used to remove the nitrosothiols for sample preparation [45].
We also performed a simple calculation to check whether derivatization would cause any significant change in the protein mobility. After derivatization, Dylight 488 maleimide was labeled to the nitrosylated proteins, causing only an 800 Da molecular weight (MW) shift due to the MW of the dye. The mobility will not be altered much with this minimum MW shift when considering the average molecular weights of proteins such as BSA (MW = 63 kDa).
In order to distinguish the peaks of the fluorescence dye itself from those of the nitrosylated proteins, the electropherogram of the Dylight 488 maleimide alone, which exhibits multiple peaks appearing from 200s to 400s, is shown in Figure 2(bottom trace 1). More than one fluorescence peak was observed since this reagent is an isomeric mixture.
Figure 2.

CGE-LIF separation of nitrosylated BSA labeled with Dylight 488 maleimide. Separation, -570V/cm; hydrodynamic injection, 11kpa, 4s; sieving matrix, 20mM Tris, 20mM Tricine, 0.5% SDS, 15% dextran (65.5kDa), pH 8. Top trace and middle trace are offset on the y-axis for clarity. * — Dylight 488 maleimide, ^ — nitrosylated BSA.
In vitro nitrosylated BSA was used as a model to test the reactivity of Dylight 488 maleimide toward SNOs in treated BSA. After the “Fluorescence Switch” assay and removal of excessive dye, a representative electropherogram of nitrosylated BSA was shown in trace 2 of Figure 2. It depicts that the nitrosylated BSA appears approximately at 690s. A series of peaks (200–400 s) occurring before the nitrosylated BSA is attributed to the residual Dylight 488 maleimide. However, the control of just the dye (trace 1 in Fig. 2) has 3 well defined peaks in this range, whereas the nitrosylated BSA derivatized with the dye has a wide range of peaks in this window. In order to validate that the wide range of peaks are indeed from residual dye instead of SNOs, and further understand why this visual disparity exists, we used various controls including untreated BSA, mercury chloride treated nitrosylated BSA, and the fluorescence switch assay with no protein.
3.2. Selectivity and specificity of the fluorescence switch assay
After the derivatization of untreated BSA with the fluorescence switch assay and injecting the samples to CE, a significantly smaller peak was detected around 690 s for SNOs. It was initially expected that no peak for SNOs in the commercial BSA would be detected. The fluorescence switch S-nitrosylation assay is based on the assumption that only the S-nitrosylated cysteine residues will be derivatized and fluorescently labeled. If the free thiols of the cysteine residues have not all been successfully blocked with MMTS, then the nonblockedcysteines may produce a fluorescence signal in the electropherogram. To rule out this possibility, MMTS with a high concentration of 100 mM was used for blocking. Hence, we believe that the little peak (trace 3 in Figure 2) was from the SNOs in the commercial BSA, which were previously indicated in other studies[46,47].
The primary structure of BSA has 35 cysteines. Among them, 34 cysteine residues form disulphide bridges and only one ‘free’ cysteine residue, Cys34 exists [48]. Consistently, thiol group in native untreated BSA measured by Ellman’s assay showed average values of 0.55 free -SH per mol of BSA instead of one –SH group as expected[47]. This suggested that commercially available BSA is already oxidized at residue Cys34[46,47]. They could form a disulfide bond with several compounds like cysteine or glutathione, or undergo nitrosylation of Cys34 by nitric oxide [49]. Hence, this significantly smaller peak compared with the one from nitrosylated BSA, indicates a small fraction of SNO in commercial BSA.
The selectivity of labeling nitrosothiols using Dylight 488 maleimide was also studied by incubating nitrosylated BSA with mercuric chloride before the fluorescence switch procedure. Mercuric chloride (HgCl2) can break the S-NO bond, and the newly formed nitrosonium ion (NO+) can undergo rapid hydration to produce NO2− at neutral pH [10]. So it was reasonable to see the decreased intensity of the SNOs signal for the HgCl2 treated nitrosylated BSA. In fact, no obvious peak was observed in trace 4 in Figure 2, confirming the selective Dylight 488 maleimide labeling of nitrosylated BSA after derivatization.
Additionally, the fluorescence switch assay was conducted using a sample without proteins. No peaks at 690 s in the protein migration time window were observed, while the same wide peaks existed ranging from 200 to 400s (shown in trace 5 of Figure 2). Altogether, these studies further validate that these wide peaks were neither protein nor SNOs based. Currently we speculate that this wide range of peaks preceding the protein peak might be due to hydrolysis of Dylight 488 maleimide.
3.3. Calibration of CGE-LIF method with nitrosothiol BSA standard
BSA subjected to RSNO was used as a test model to optimize the derivatization and labeling procedures and to characterize the response of the LIF detector. The standard curve was made by a series of dilutions of nitrosylated BSA using CGE-LIF (Figure 3). The NO donor, GSNO, created 76 pmolnitrosothiol/mg of BSA determined by Saville assay. This result is in close agreement with the published data [50].
Figure 3.

Electropherograms of a series of dilution (1-, 2-, 4-, 10-fold) of nitrosylated BSA labeled with Dylight 488 maleimide. Other conditions are the same as in Fig.2. *—Dylight 488 maleimide, ^—nitrosylated BSA.
Four dilutions of Dylight 488 labeling nitrosylated BSA were run in CGE-LIF in triplicate. The injection volume is 1.1 nL (11kpa, 4s) of each sample. The calibration curve was made by the fluorescence peak area (y) of nitrosothiols on BSA and the corresponding moles of nitrosothiol (x), given by the following equation.
| (1) |
In the above calibration curve generated from nitrosothiol BSA standard, the slope has 13% error; and the error in the intercept is not significant for quantifying nitrosothiols amount because the slope is to the nineteenth power. The Saville assay can detect 500 nM of nitrosothiol proteins.21 So far, the lowest reported limit of nitrosothiol detection based on DAF fluorescence assay was 5nM[22]. The limit of detection (LOD) in this CGE-LIF method determined by equation (1) was 1.3pM, which is lowest LOD reported to date. Speculatively, we propose that the dynamic range can reach 4.2 pM (limit of quantification) at the lowest limit. Theoretically, the upper limit of range occurs when signals are sufficient enough to saturate detectors. However, biological samples do not typically have high levels of SNO, so this value is ignored.
3.4. Monitoring nitrosylation in MQ-mediated cells
The direct application of this CGE-LIF method in biological systems was demonstrated in the nitrosylation profiling of MQ-treated HT-29 cells. After extracting the proteins from the MQ-treated HT-29 cells, the proteins were treated with “fluorescence switch assay” prior to labeling with Dylight 488 maleimide. Figure 4 shows the electropherograms resulting from the hydrodynamic injection of Dylight 488 maleimide labeled proteins of MQ-treated HT-29 cells (upper trace) and untreated samples (bottom trace). The labeled HT-29 cell proteins were detected between 420 and 880s, which are denoted by “a” and “b” in Figure 4. This indicates a wide MW range of proteins that are susceptible to nitrosylation.
Figure 4.

Electropherograms of extracted proteins from HT29 cells after fluorescence switch assay. Top and bottom traces represent MQ treated and untreated, respectively. All the experimental conditions are the same as in Fig 2. Top trace is offset in the y-axis for the clarity. *—Dylight 488 maleimide; migration window between a and b indicated nitrosylated proteins.
Based on Eq. (1), the total nitrosothiol content detected in each electropherogram for MQ-treated and untreated HT-29 cells (cf. Figure 4) were 65.5 ± 0.9 amoland 45.9 ± 2.4 amol (average ± SD; 3 injections), respectively. Based on the BCA analysis of the same preparation (4.04 mg protein/mL for the MQ treated HT29 cells and 3.92 mg protein/mL for the untreated one) and a 1.1 nL injection (11 kPa, 4 s) per electropherogram, the total protein content were 4.44 ng for the MQ treated HT 29 cells and 4.31 ng for the untreated one. Therefore, the untreated cells contained a low level of SNO (10.4±0.5 pmolnitrosothiol/mg protein), and treatment with MQ resulted in a 1.5-fold increase in SNO content 14.8±0.2 pmolnitrosothiol/mg protein). Our results are consistent with other reported values (from 100 nmol/mg of protein to 10 pmol/mg of protein) for nitrosothiols in various biological tissues [51–53].
3.5. Monitoring nitrosylation in AD Tg mice brain
Another direct biological application of this CGE-LIF method was demonstrated in analyzing nitrosylation in very small amounts of the cerebrum of 5-month-old AD transgenic B6Cg-Tg mice. Figure 5 shows eletropherograms of 5-month-old B6Cg-Tg mice cerebrum labeled with Dylight 488 maleimide. The fluorescence of Dylight 488 maleimide-labeled SNOs was detected between 500 and 1248s (indicated by “a” and “b”, respectively) in both Tg and WT cerebrum. The region between a and b were included in the calculation of the total area for nitrosothiol determination.
Figure 5.

Electropherograms of cerebrum from 5-month-old transgenic (upper trace) and wild type (bottom trace) mice brain tissue. All the experimental conditions are the same as in Fig 2. Top trace is offset in the y-axis for the clarity. *—Dylight 488 maleimide; migration window between a and b indicated nitrosylated proteins.
Based on Eq. (1), the total nitrosothiol content detected in each electropherogram for Tg and WT (cf. Figure 5) were 71.2±2 and 62.3±1.7 amol (average ± SD; 3 injections), respectively. The total injected protein contents were 4.58 ng and 5.38 ng for Tg and WT, respectively based on injected volume of 1.1 nL. Thus, the concentration of nitrosylated protein in the 5-month-old transgenic B6Cg-Tg mice was 15.5 ± 0.4 (average±SD; 3 injections)pmol/mg, while WT cerebrum was 11.7 ±0.3 (average ± SD; 3 injections)pmol/mg. This preliminary result of just one animal pair indicates a small difference in brain SNOs expression at 5 months old, a time stage right before the amyloid plaque onset in this AD B6Cg mice model. Although we cannot make conclusive assessment of the S-nitrosothiols abundance in this Tg mice based on this initial application, we have demonstrated the capability of this CGE-LIF method for monitoring nitrosylation electrophoretic profiles in AD Tg mouse brain. We propose this assay will be valuable in further studies for (i) characterizing SNO MW profiling in various brain tissues and other biological tissues, such as blood plasma; and (ii) monitoring longitudinal SNO changes in AD progression.
This newly developed CE-LIF method monitoring nitrosylated proteins in analysis of biological samples has several advantages, such as its low LOD, fast analysis time, high accuracy, and potential for pattern classification. Currently, many assay techniques for measuring biological SNOs are used near the limit of detection [19]. Our developed method allowed only nanogram amount of protein and it reached the limit of SNO detection of 1.3 pM, which is 105 fold less than the conventional Saville assay. This CGE-LIF adds great advantages for detecting low abundance of nitrosothiols in complex biological samples.
Additionally, the results from biological samples indicate a wide MW range of proteins that are susceptible to nitrosylation. Although individual protein types were not fully resolved by CGE, a profile of nitrosylated proteins was obtained under 15 min, much faster than SDS-PAGE requiring 6 h of analysis. This short analysis time makes this method potentially useful as a prescreening tool in proteomics studies aimed at discovering proteins susceptible to nitrosylation.
Also, because CGE can separate samples by size, it can distinguish the interfering residual fluorescent dye from the SNOs peaks. This further eliminates the false positive signals from excessive dye and enhances accuracy compared with other spectrofluorometric assays.
CE-LIF also helps to obtain a molecular weight distribution profile of nitrosylated proteins. In future studies based on the data points from electropherograms, this work can be potentially used to investigate genotype-related and age-dependent changes in protein nitrosothiols in mice AD brain using chemometric techniques such as principal component analysis [30].
3.6. Detection of S-nitrosylated proteins in HT-29 cells
To prove the selectivity of CGE-LIF method, we also confirmed the desired peaks in the electropherograms. S-nitrosylated proteins in HT-29 cells were detected and identified using the biotin-switch assay developed by Jaffrey et al. which is based on the labeling of S-nitrosylated cysteine on targeted proteins with a biotin moiety[36]. This method contains three essential steps: blocking the free thiols with a thiol-specific methylthiolating reagent (MMTS), reducing the S-nitrosothiols to free thiols specifically by ascorbate, and labeling the thiols from the previous step with biotin-HPDP. Detection of biotinylated proteins was performed by liquid chromatography and electrospray ionization tandem mass spectrometry (LC-ESI MS/MS) analysis after a series of purification steps. The result from HT29 cells (Figure 2) indicates a wide molecular weight (Mw) range of proteins peaks (from 420 s to 880 s) that are susceptible to nitrosylation. Although the individual protein peaks were not fully resolved by CGE-LIF method, the nitrosylated proteins from the wide Mw range of peaks were identified by the LC-electrospray ionization (ESI) MS/MS. The supplementary data in Table 1 shows 24 nitrosylated proteins were identified in HT 29 cells and the wide Mw range of the identified proteins was from 11 kDa to 300 kDa. These proteins include cell membrane proteins, nucleus proteins, cytoskeleton proteins, cell cycle proteins, signaling proteins, redox-related proteins, and folding-related proteins. The representative MS/MS peptide spectra of nucleolin and isoform 1 of vinculin are shown in Figure 1 of supplementary information.
3.7. Repeatability and precision of CGE-LIF
The repeatability and precision of the method was determined by performing injection repeatability and analysis repeatability in replicate (n=5) injection of the BSA standard solutions[54]. Injection repeatability was measured by performing five replicate injections of the BSA standard solutions; analysis repeatability was measured by injection of five different samples prepared by the same sample preparation procedure. The relative standard deviation (RSD) values for migration time and peak area were 0.3 and 4.2 %, respectively. The RSD values for migration time and peak area were 0.4 and 1.4 % in the measurement of analysis repeatability.
The precision of the method was determined by performing intra-day and day-to-day assays by replicate (n=5) injection of the mixed standard solution. Intra-day assay precision was done by measuringthe BSA standard solutions during the same day, whereas day-to-day precision measured the same BSA standard solutions for 5 consecutive days. For intra-day precision, the RSD values of migration time and peak area was 0.2 and 3.2 %, respectively; for day-to-day precision, the corresponding values were 0.2 and 2.7 %. These results demonstrate that CGE-LIF method can be regarded as repeatable and precise since the RSD values for the migration time and peak areas are all < 5.0%.
4. Conclusions
In this paper, a method for detection and quantification of nitrosylated proteins using fluorescence switch assay coupled with CGE-LIF was developed. This method can detect 1.3 pM concentration of nitrosylated proteins in nanogram amounts of proteins, which is the lowest LOD reported to date. This method also demonstrated its capability in monitoring nitrosylation in both cell culture and tissue systems. Due to the small sample need, we envision that the method can be extended to investigate protein nitrosylation profiles in minuscule brain tissues and/or blood plasma in the disease progression of AD transgenic mouse models.
Supplementary Material
Acknowledgments
This work was supported by the National Institutes of Health and the National Center for Research Resources Grant P20RR016456 and NIH grant # DK44510. Special thanks to Dr. Edgar Arriaga’s group for providing their house written Wide Peak analysis software in our study. We thank Bryant Hollins for providing a grammatical review of this manuscript.
Footnotes
Publisher's Disclaimer: This is a PDF file of an unedited manuscript that has been accepted for publication. As a service to our customers we are providing this early version of the manuscript. The manuscript will undergo copyediting, typesetting, and review of the resulting proof before it is published in its final citable form. Please note that during the production process errors may be discovered which could affect the content, and all legal disclaimers that apply to the journal pertain.
References
- 1.Broillet MC. Cell Mol Life Sci. 1999;55:1036. doi: 10.1007/s000180050354. [DOI] [PMC free article] [PubMed] [Google Scholar]
- 2.Martinez-Ruiz A, Lamas S. Cardiovasc Res. 2004;62:43. doi: 10.1016/j.cardiores.2004.01.013. [DOI] [PubMed] [Google Scholar]
- 3.Jaffrey SR, Erdjument-Bromage H, Ferris CD, Tempst P, Snyder SH. Nat Cell Biol. 2001;3:193. doi: 10.1038/35055104. [DOI] [PubMed] [Google Scholar]
- 4.Huber SC, Hardin SC. Curr Opin Plant Biol. 2004;7:318. doi: 10.1016/j.pbi.2004.03.002. [DOI] [PubMed] [Google Scholar]
- 5.Spickett CM, Pitt AR, Morrice N, Kolch W. Biochim Biophys Acta. 2006;1764:1823. doi: 10.1016/j.bbapap.2006.09.013. [DOI] [PubMed] [Google Scholar]
- 6.Hess DT, Matsumoto A, Kim SO, Marshall HE, Stamler JS. Nat Rev Mol Cell Biol. 2005;6:150. doi: 10.1038/nrm1569. [DOI] [PubMed] [Google Scholar]
- 7.Mangialasche F, Polidori MC, Monastero R, Ercolani S, Camarda C, Cecchetti R, Mecocci P. Ageing Res Rev. 2009;8:285. doi: 10.1016/j.arr.2009.04.002. [DOI] [PubMed] [Google Scholar]
- 8.Foster MW, McMahon TJ, Stamler JS. Trends Mol Med. 2003;9:160. doi: 10.1016/s1471-4914(03)00028-5. [DOI] [PubMed] [Google Scholar]
- 9.Riederer IM, Schiffrin M, Kovari E, Bouras C, Riederer BM. Brain Res Bull. 2009;80:233. doi: 10.1016/j.brainresbull.2009.04.018. [DOI] [PubMed] [Google Scholar]
- 10.Hara MR, Thomas B, Cascio MB, Bae BI, Hester LD, Dawson VL, Dawson TM, Sawa A, Snyder SH. Proc Natl Acad Sci U S A. 2006;103:3887. doi: 10.1073/pnas.0511321103. [DOI] [PMC free article] [PubMed] [Google Scholar]
- 11.Lipton SA. Curr Drug Targets. 2007;8:621. doi: 10.2174/138945007780618472. [DOI] [PubMed] [Google Scholar]
- 12.Christen S, Cattin I, Knight I, Winyard PG, Blum JW, Elsasser TH. Exp Biol Med (Maywood) 2007;232:309. [PubMed] [Google Scholar]
- 13.Hogg N. Anal Biochem. 1999;272:257. doi: 10.1006/abio.1999.4199. [DOI] [PubMed] [Google Scholar]
- 14.Liu Z, Rudd MA, Freedman JE, Loscalzo J. J Pharmacol Exp Ther. 1998;284:526. [PubMed] [Google Scholar]
- 15.Stamler JS, Simon DI, Osborne JA, Mullins ME, Jaraki O, Michel T, Singel DJ, Loscalzo J. Proc Natl Acad Sci U S A. 1992;89:444. doi: 10.1073/pnas.89.1.444. [DOI] [PMC free article] [PubMed] [Google Scholar]
- 16.Singh RJ, Hogg N, Joseph J, Kalyanaraman B. J Biol Chem. 1996;271:18596. doi: 10.1074/jbc.271.31.18596. [DOI] [PubMed] [Google Scholar]
- 17.Kettenhofen NJ, Broniowska KA, Keszler A, Zhang Y, Hogg N. J Chromatogr B Analyt Technol Biomed Life Sci. 2007;851:152. doi: 10.1016/j.jchromb.2007.02.035. [DOI] [PMC free article] [PubMed] [Google Scholar]
- 18.Saville B. The Analyst. 1958;83:670. [Google Scholar]
- 19.Gow A, Doctor A, Mannick J, Gaston B. J Chromatogr B Analyt Technol Biomed Life Sci. 2007;851:140. doi: 10.1016/j.jchromb.2007.01.052. [DOI] [PMC free article] [PubMed] [Google Scholar]
- 20.Doctor A, Platt R, Sheram ML, Eischeid A, McMahon T, Maxey T, Doherty J, Axelrod M, Kline J, Gurka M, Gow A, Gaston B. Proc Natl Acad Sci U S A. 2005;102:5709. doi: 10.1073/pnas.0407490102. [DOI] [PMC free article] [PubMed] [Google Scholar]
- 21.Hausladen A, Rafikov R, Angelo M, Singel DJ, Nudler E, Stamler JS. Proc Natl Acad Sci U S A. 2007;104:2157. doi: 10.1073/pnas.0611191104. [DOI] [PMC free article] [PubMed] [Google Scholar]
- 22.Kojima H, Nakatsubo N, Kikuchi K, Kawahara S, Kirino Y, Nagoshi H, Hirata Y, Nagano T. Anal Chem. 1998;70:2446. doi: 10.1021/ac9801723. [DOI] [PubMed] [Google Scholar]
- 23.Itoh Y, Ma FH, Hoshi H, Oka M, Noda K, Ukai Y, Kojima H, Nagano T, Toda N. Anal Biochem. 2000;287:203. doi: 10.1006/abio.2000.4859. [DOI] [PubMed] [Google Scholar]
- 24.Yu CJ, Chang HC, Tseng WL. Electrophoresis. 2008;29:483. doi: 10.1002/elps.200700217. [DOI] [PubMed] [Google Scholar]
- 25.Santhanam L, Gucek M, Brown TR, Mansharamani M, Ryoo S, Lemmon CA, Romer L, Shoukas AA, Berkowitz DE, Cole RN. Nitric Oxide. 2008;19:295. doi: 10.1016/j.niox.2008.07.007. [DOI] [PMC free article] [PubMed] [Google Scholar]
- 26.Tello D, Tarin C, Ahicart P, Breton-Romero R, Lamas S, Martinez-Ruiz A. Proteomics. 2009;9:5359. doi: 10.1002/pmic.200900070. [DOI] [PubMed] [Google Scholar]
- 27.Circu ML, Rodriguez C, Maloney R, Moyer MP, Aw TY. Free Radic Biol Med. 2008;44:768. doi: 10.1016/j.freeradbiomed.2007.09.011. [DOI] [PMC free article] [PubMed] [Google Scholar]
- 28.Okouchi M, Okayama N, Aw TY. Curr Neurovasc Res. 2009;6:267. doi: 10.2174/156720209789630348. [DOI] [PMC free article] [PubMed] [Google Scholar]
- 29.Circu ML, Moyer MP, Harrison L, Aw TY. Free Radic Biol Med. 2009;47:1190. doi: 10.1016/j.freeradbiomed.2009.07.032. [DOI] [PMC free article] [PubMed] [Google Scholar]
- 30.Feng J, Navratil M, Thompson LV, Arriaga EA. J Gerontol A Biol Sci Med Sci. 2008;63:1277. doi: 10.1093/gerona/63.12.1277. [DOI] [PMC free article] [PubMed] [Google Scholar]
- 31.Feng J, Arriaga EA. Electrophoresis. 2008;29:475. doi: 10.1002/elps.200700262. [DOI] [PubMed] [Google Scholar]
- 32.Han P, Chen C. Rapid Commun Mass Spectrom. 2008;22:1137. doi: 10.1002/rcm.3476. [DOI] [PubMed] [Google Scholar]
- 33.Basu S, Hill JD, Shields H, Huang J, Bruce King S, Kim-Shapiro DB. Nitric Oxide. 2006;15:1. doi: 10.1016/j.niox.2006.01.005. [DOI] [PubMed] [Google Scholar]
- 34.Han P, Zhou X, Huang B, Zhang X, Chen C. Anal Biochem. 2008;377:150. doi: 10.1016/j.ab.2008.03.023. [DOI] [PubMed] [Google Scholar]
- 35.Torta F, Usuelli V, Malgaroli A, Bachi A. Proteomics. 2008;8:4484. doi: 10.1002/pmic.200800089. [DOI] [PubMed] [Google Scholar]
- 36.Jaffrey SR, Snyder SH. Sci STKE. 2001;2001:pl1. doi: 10.1126/stke.2001.86.pl1. [DOI] [PubMed] [Google Scholar]
- 37.Lopez-Sanchez LM, Corrales FJ, De La Mata M, Muntane J, Rodriguez-Ariza A. Methods Enzymol. 2008;440:273. doi: 10.1016/S0076-6879(07)00817-8. [DOI] [PubMed] [Google Scholar]
- 38.Feng J, Xie H, Meany DL, Thompson LV, Arriaga EA, Griffin TJ. J Gerontol A Biol Sci Med Sci. 2008;63:1137. doi: 10.1093/gerona/63.11.1137. [DOI] [PMC free article] [PubMed] [Google Scholar]
- 39.Kersey PJ, Duarte J, Williams A, Karavidopoulou Y, Birney E, Apweiler R. Proteomics. 2004;4:1985. doi: 10.1002/pmic.200300721. [DOI] [PubMed] [Google Scholar]
- 40.Giustarini D, Dalle-Donne I, Colombo R, Milzani A, Rossi R. Nitric Oxide. 2008;19:252. doi: 10.1016/j.niox.2008.07.003. [DOI] [PubMed] [Google Scholar]
- 41.Forrester MT, Foster MW, Benhar M, Stamler JS. Free Radic Biol Med. 2009;46:119. doi: 10.1016/j.freeradbiomed.2008.09.034. [DOI] [PMC free article] [PubMed] [Google Scholar]
- 42.Jocelyn PC. Eur J Biochem. 1967;2:327. doi: 10.1111/j.1432-1033.1967.tb00142.x. [DOI] [PubMed] [Google Scholar]
- 43.Njus D, Kelley PM. FEBS Lett. 1991;284:147. doi: 10.1016/0014-5793(91)80672-p. [DOI] [PubMed] [Google Scholar]
- 44.Forrester MT, Foster MW, Stamler JS. J Biol Chem. 2007;282:13977. doi: 10.1074/jbc.M609684200. [DOI] [PubMed] [Google Scholar]
- 45.Wells WW, Xu DP. J Bioenerg Biomembr. 1994;26:369. doi: 10.1007/BF00762777. [DOI] [PubMed] [Google Scholar]
- 46.Chesne S, Rondeau P, Armenta S, Bourdon E. Biochimie. 2006;88:1467. doi: 10.1016/j.biochi.2006.05.011. [DOI] [PubMed] [Google Scholar]
- 47.Rondeau P, Singh NR, Caillens H, Tallet F, Bourdon E. Free Radic Biol Med. 2008;45:799. doi: 10.1016/j.freeradbiomed.2008.06.004. [DOI] [PubMed] [Google Scholar]
- 48.Oblak M, Prezelj A, Pecar S, Solmajer T. Z Naturforsch C. 2004;59:880. doi: 10.1515/znc-2004-11-1219. [DOI] [PubMed] [Google Scholar]
- 49.Oettl K, Stauber RE. Br J Pharmacol. 2007;151:580. doi: 10.1038/sj.bjp.0707251. [DOI] [PMC free article] [PubMed] [Google Scholar]
- 50.Burgoyne JR, Eaton P. Methods Enzymol. Vol. 473. p. 281. [DOI] [PubMed] [Google Scholar]
- 51.Laver JR, Stevanin TM, Messenger SL, Lunn AD, Lee ME, Moir JW, Poole RK, Read RC. FASEB J. 24:286. doi: 10.1096/fj.08-128330. [DOI] [PMC free article] [PubMed] [Google Scholar]
- 52.Gow AJ, Chen Q, Hess DT, Day BJ, Ischiropoulos H, Stamler JS. J Biol Chem. 2002;277:9637. doi: 10.1074/jbc.C100746200. [DOI] [PubMed] [Google Scholar]
- 53.Zhang Y, Hogg N. Am J Physiol Lung Cell Mol Physiol. 2004;287:L467. doi: 10.1152/ajplung.00350.2003. [DOI] [PubMed] [Google Scholar]
- 54.Chen J, Chen L, Zhang HL, Shi YP. J AOAC Int. 93:1410. [PubMed] [Google Scholar]
Associated Data
This section collects any data citations, data availability statements, or supplementary materials included in this article.