Abstract
During the last few years, Poly(ADP-ribose)Polymerase (PARP) proteins became a very popular target for anti-cancer treatment. Many PARP inhibitors have been generated and tested by pharmacological industry. However, most of them were designed to disrupt the DNA-dependent PARP1 protein activation pathway and were based on a competition with NAD for a binding site on PARP molecule and, therefore, on disruption of PARP-mediated enzymatic reaction. This limitation resulted in a discovery of mainly nucleotide-like PARP1-inhibitors which may target not only PARP, but also other pathways involving NAD and other nucleotides. Here, we describe a strategy for the identification PARP inhibitors that target a different pathway, the histone H4 dependent PARP1 activation. Besides the identification of NAD competitors in a small molecules collection, this approach allows finding novel classes of PARP inhibitors that specifically disrupt H4 based PARP activation.
Keywords: PARP1, PARP1 activation, PARP1 inhibitor, Poly(ADP-ribose), Library of Small Molecule Inhibitors, High-Throughput Colorimetric Assay
1. Introduction
PARP1 is a constitutive component of chromatin, crucial for both DNA repair and transcription. PARP1 takes an active part in DNA repair processes by binding to DNA breaks and catalyzing polymerization of ADP-ribose into long chains on nuclear proteins, such as histones, transcription factors, and PARP1 itself (1, 2). In the past 40 years, many PARP1 inhibitors have been identified. However, confirming the effectiveness of PARP1 inhibitors and identifying their mechanism of action are fundamental to a successful treatment of aggressive and non-responsive tumors, such as triple-negative breast cancer (-BRCA, –HER, -PR) (3). So far, only one pathway of PARP1 activation is vigorously tested by pharmacological industry – DNA-dependent PARP1 activation. Here, we describe an alternative approach based on PARP1 activation by histone H4. This approach, combined with the development of a high-throughput automated PARP1 assay, affords an opportunity to screen relatively large drug libraries for potential inhibitors with different mechanisms of action.
Previously, we have developed an assay confirming that PARP1 can be activated by two distinct pathways: DNA- and histone-dependent. Most known PARP1 inhibitors are “related” to the substrate of PARP1 known as nicotinamide adenine dinucleotide (NAD+). As such, they belong to the groups of monoaryl amides and bi-, tri-, tetracyclic lactams. These inhibitors act as competitive inhibitors because they block NAD-binding domains of PARP1 (4). Our newly developed assay is based on the protein-dependent pathway of activation and can be adapted to screen potential novel inhibitors as well as to determine their mechanism of action. This method provides a basis for determining whether drugs specifically impair PARP1 via gene transcription or DNA repair, thus aiding in the discovery of new drugs with increasing specificity in future treatment protocols.
Our assay is suitable for assessing PARP1 inhibition by a subset of 50,000 drugs within the Fox Chase Cancer Center Translational Research Library. It is an ELISA-like assay where 1) a 96/384-well ELISA plate is coated with protein-activator, 2) PARP reactions are set up in each well, and 3) a product of these reactions – poly-(ADP)-ribose – is quantified (5). Absorbance at 650 or 450 nm is used as an indicator of PARP1 activity. Positive hits from these screens, as well as known PARP1 inhibitors, could then be tested in vivo using Drosophila cell culture, human cell cultures, and Drosophila as a model organism.
2. Materials
2.1. Histone H4 purification
37°C incubator / shaker.
Spectrophotometer.
High-speed centrifuge.
Glass homogenizer: 30 mL.
Sonicator with a large tip, suitable for sonication of 10-20 mL of cell suspension.
AKTA Prime FPLC system and 16/60 Sephadex column (Amersham).
Magnetic stirrer and stir bars.
BL21(DE3)pLysS competent cells (Invitrogen).
pET3/H4 expression plasmid (gift form Zaret lab).
LB agar.
10 cm Petri dishes.
2YT media.
Ampicillin solution: 100 mg/mL.
Chloramphenicol solution: 25 mkg/mL.
Falcon culture tubes: 14 mL.
1 liter flask.
IPTG: 1M.
Histone wash buffer: 50 mM Tris-HCl, pH 7.5, 100 mM NaCl, 1 mM PMSF.
Triton X100 (20% solution in water).
DMSO (Sigma: D6250).
Urea buffer: 7 M Urea, 1 M NaCl, 20 mM Sodium Acetate, pH 5.2, 1 mM EDTA, 5 mM 2-mercaptoethanol, freshly made.
Unfolding buffer: 7 M Guanidine-HCl, 20 mM Tris-HCl, pH 7.5, 10 mM DTT. This buffer can be kept on 4°C for several months; DTT should be added immediately before use.
Collection tubes, 5 mL.
1-3 liter beakers.
Dialysis bags (cut off 7,000; Thermo Scientific) and clips.
1× PARP1 buffer: 50 mM Tris, pH 8.0, 25 mM MgCl2, 0.1% Triton X100.
2.2. PARP assay using multiwell plates
Multichannel (8 or 12) pipette, 20-200 mkL.
Automatic plate washer (BioTek Plate Washer).
Reagent dispenser (Matrix Wellmate).
96/384-well robotic transfer (CyBio Well Vario).
Plate reader with 450 and 650 nm filters (Perkin Elmer Envision Plate Reader).
Centrifuge for plate spinning.
Microcentrifuge.
96-well Nunc Maxisorp plates.
Sealing tape for multiwell plates.
Phosphate buffered saline (PBS): 9g NaCl, 0.726g Na2HPO4-7 H2O, 0.21g K2HPO4; dilution at 1:1 with distilled water.
NAD+: 20 mkM solution in water.
Human PARP1 enzyme (Trevigen).
Histone H4.
1× PARP1 buffer: 50 mM Tris-HCl, pH 8.0, 25 mM MgCl2, 0.1% TritonX100.
DMSO (Sigma).
3-Aminobenzamide (Sigma).
4-Amino-1,8-naphtalimide (Trevigen).
Library of Small Molecule Inhibitors / ICCB Known Bioactives (EnzolifeSciences).
PBST: PBS + 0.1% Tween-20.
Blocking solution: PBST + 5% non-fat dry milk.
Primary antibody: anti-poly(ADP)ribose monoclonal antibody, clone 10H (Tulip Biolabs).
Secondary antibody: HRP-conjugated goat anti-mouse antibody (Perkin Elmer).
SureBlue Reserve Peroxidase substrate (KPL).
Hydrochloric acid 1 M.
2.3. In vitro PARP assay
NAD+: 200 mkM solution.
Human PARP1 enzyme (Trevigen).
Histone H4.
PARP1 buffer: 50 mM Tris-HCl, pH 8.0, 25 mM MgCl2, 0.1% TritonX100.
DMSO (Sigma).
Small Molecule Inhibitors.
4x Laemmli sample buffer.
4-12% Nupage Bis-Tris protein gels.
Nitrocellulose membrane: 0.45 mkM
PBS and PBST.
Blocking solution: PBST + 5% non-fat dry milk.
Primary antibody: anti-poly(ADP)ribose monoclonal antibody, clone 10H (Tulip Biolabs).
Secondary antibody: HRP-conjugated goat anti-mouse antibody (Amersham).
ECL Western blotting detection reagent (Amersham).
Heat block (95°C).
Polyacrylamide gel apparatus (Invitrogen).
Power supply.
Western blotting transfer apparatus.
Film cassette and X-ray film.
Microcentrifuge.
2.4. Cell Culture Assay
BT 474 (ATCC # HTB-20) or HR6 (6) Breast Cancer Cell Lines.
DMEM/F12 cell growth media supplemented with 10% fetal bovine serum, 20 mM L-glutamine, 100 U/mL penicillin and 100 mkg/mL streptomycin.
DMSO (Sigma).
PARP1 Inhibitors.
CO2 tissue culture incubator.
4-12% Nupage Bis-Tris protein gels.
Nitrocellulose membrane: 0.45 mkM
Polyacrylamide gel apparatus (Invitrogen).
Power supply.
Western blotting transfer apparatus.
Film cassette and X-ray film.
Low-speed bench-top centrifuge.
2.5. Protein Electrophoresis and Western Blotting
4x Laemmli sample buffer.
4-12% Nupage Bis-Tris protein gels (Invitrogen).
20X MOPS running buffer (Invitrogen).
20X MES running buffer (Invitrogen).
Nitrocellulose membrane: 0.45 mkM
PBS and PBST.
Blocking solution: PBST + 5% non-fat dry milk.
Primary antibody: anti-poly(ADP)ribose mouse monoclonal antibody, clone 10H (Tulip Biolabs).
Secondary antibody: HRP-conjugated goat anti-mouse antibody (Amersham).
ECL Western blotting detection reagent (Amersham).
3. Methods
3.1 Histone H4 purification (7, 8)
3.1.1. Expression of histone H4
Use 0.05-0.1 mkg of the pET3/H4 plasmid to transform BL21(DE3)pLysS competent cells, and plate them on LB agar plates with chloramphenicol (25 mkg/mL) and ampicillin (100 mkg/mL). Grow overnight in 37°C bacterial incubator.
Next morning, inoculate 5 tubes containing 2 mL of 2YT media with ampicillin / chloramphenicol with single colonies of plasmid bearing cells. Incubate cultures in 37°C shaker until slightly turbid (about 3 hrs).
Transfer cultures from the tubes to a 1liter flask containing 500 mL of prewarmed 2YT media with ampicillin / chloramphenicol, and grow in 37°C shaker to OD600 about 0.3-0.5 (See Note 1).
At this point, induce cells by 0.2 mM IPTG and allow them to grow for two more hrs.
In 2 hrs, collect the cells by centrifugation at RT, resuspend pellet in 20 mL of histone wash buffer and freeze in liquid nitrogen. Frozen cell suspension can be kept at -80°C for several weeks.
3.1.2 Preparation of inclusion bodies
Thaw the cells at 37°C water bath to promote lysis.
Transfer solution to 30 mL homogenizer and homogenize it with 15 strokes of pestle. Then place solution in a centrifuge tube and centrifuge 20 min at 23,000g.
Discard supernatant, add 20 mL of histone wash buffer to the pellet (consisting of inclusion bodies containing H4), and homogenize the pellet with 15 strokes of pestle. After that, sonicate homogenate with 25 impulses (50%, 0.5 settings) on a sonicator using large tip. (See Note 2).
Add Triton X100 to the solution to a final concentration of 0.1%. Then place solution in a centrifuge tube and spin it down for 10 min at 17,000g.
Resuspend resulting pellet in 20 mL of histone wash buffer plus 1% Triton X100; then homogenize with 15 strokes of pestle and centrifuge 10 min at 17,000g.
Repeat Step 5 three more times, the final time without Triton X100.
After the last wash, pelleted inclusion bodies can be frozen at -80°C or processed further.
3.1.3. FPLC purification
Filter 600 mL of freshly made Urea Buffer through 0.4 mkm filter, and equilibrate FPLC column with 240 mL of this buffer at a flow rate of 1.0 mL/min.
While the column is equilibrated, add 280 mkL of DMSO to inclusion bodies pellet and allow pellet to soak in it for 30 min at RT.
Transfer pellet to a small beaker with a stir bar, and while stirring, add dropwise 15 mL of unfolding buffer. Stir for 1h (See Note 3).
Remove undissolved material by centrifugation at 23,000g for 10 min at RT.
Filter solution through 0.4 mkm filter and load it on equilibrated column.
Collect 1 mL fractions corresponding to a second peak and analyze them on protein gel (See Note 4).
Place fractions at -80°C (up to several days) or proceed to dialysis.
3.1.4. Dialysis
Prepare 3 liters of 1x PARP1 buffer + 2 mM 2-mercaptoethanol. Cool down to 4°C.
Pool fractions that contain pure histone H4 together into 15 mL tube.
Cut an appropriate length of dialysis bag so that it can hold H4 fractions plus additional 3-5 cm for clipping.
Secure bottom end of the bag with one clip.
Place pooled fractions in the bag.
Secure top end of the bag with another clip. Leave a small space containing air at the top.
Dialyze fractions with 3 changes of buffer at 4°C. Each step should be at least 2 hrs long; the second or third change should be done overnight.
3.2. PARP1 reaction optimization (See Note 5)
3.2.1. Conditions for a pilot experiment: Plate setup
Falcon 96-well plate #353912.
Histone H4 in PBS 0.5mkg/well (50 mkL).
NAD+ concentrations range: 0 mkM; 0.1 mkM; 1 mkM; 10 mkM and 100mkM.
DNA (0.2 mkg) was used as a positive control for PARP1 activation reaction.
PARP1 enzyme: 0.25 mkL (2.5 U/well).
Positive hit controls: PARP1 inhibitors 3AB (9, 11) and 4ANI (10, 11)
3AB concentration range: 50 mkM, 200 mkM and 800 mkM.
4ANI concentration range: 30 nM, 120nM and 480 nM.
Negative hit control: DMSO.
Negative reaction control: no PARP1 reaction.
See Figure 1a.
Figure 1.
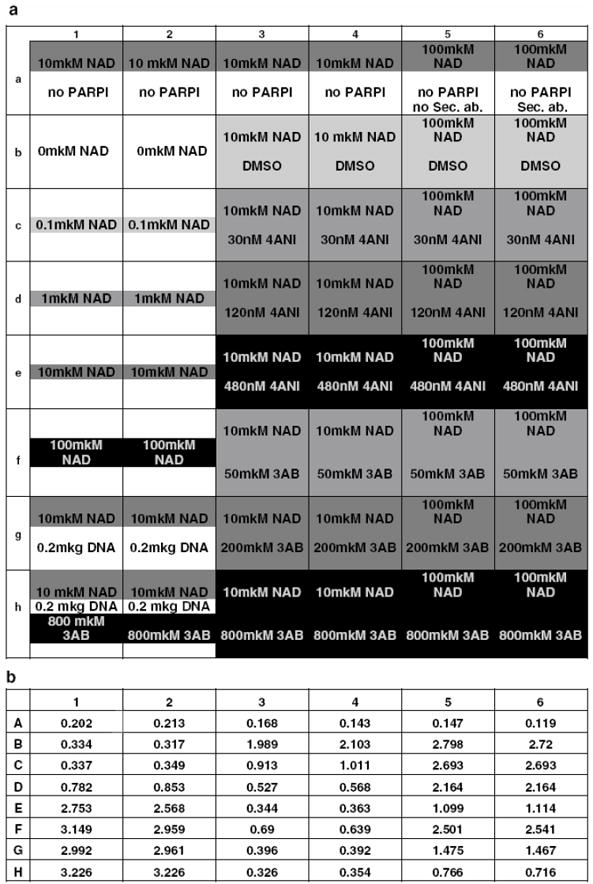
Pilot Experiment
(a) 96 well plate setup for pilot experiment (half of a plate was used). NAD+ titration: columns 1, 2; rows B-F. Row A – negative control; row G – positive control (DNA added); row H – control for inhibition (3AB added). 4ANI concentration used: row C: 30 nM; row D: 120 nM; row E: 480 nM. 3AB concentration used: row F: 50 mkM; row G: 200 mkM; row H: 800 mkM. DMSO: row B.
(b) Absorbance reading at 650 nm.
3.2.2. Conditions for a pilot experiment: Reaction setup
Dilute histone H4 to 100 mkg/mL in PBS.
Coat 96 well plate with 50 mkL/well of H4 solution o/n at RT (See Note 6).
Wash the plate with PBS-T, 200 mkL/well, 2× 5 min.
Block the plate with 200 mkL/well of PBS-T for 2 hrs at RT.
Wash the plate with 1x PARP1 buffer, 200 mkL/well 2× 5 min.
Set up PARP reactions in 50 mkL/well: 25 mkL of 2XNAD+ and inhibitors were added to wells; 25 mkL of 2x PARP1 mix were prepared separately and then distributed to NAD/ inhibitors-containing wells.
Incubate the plate at RT for 1 hr.
Wash the plate with PBS-T, 200 mkL/well 2× 5 min.
Block the plate with 200 mkL/well of PBST/ 5% non-fat milk for 1 hr at RT.
Wash the plate with PBS-T 200 mkL/well 2× 5 min.
Add primary 10H antibodies (1:250 in PBST/milk) to the plate, 50 mkL/well.
Incubate the plate at RT for 1 hr.
Wash the plate with PBS-T, 200 mkL/well 3× 5min.
Add secondary HRP-conjugated goat anti-mouse antibodies (1:250 in PBST/milk), 50 mkL/well.
Incubate the plate at RT for 1 hr.
Wash the plate with PBS-T, 200 mkL/well, 2× 5 min, and with PBS 1× 5 min.
Develop the plate with SureBlue reagent, 50 mkL/well (See Note 7).
Read absorbance at 650 nm.
See Figure 1b.
3.2.3. Histone H4 amount optimization / plate optimization
Two types of plates were chosen for comparison – Falcon 353912 plate and Nunc Maxisorp plate.
Three H4 concentrations were tested: 0.125 mkg/well, 0.25 mkg/well and 0.5 mkg/well.
Three PARP1 concentrations were tested: 0.625 u/well, 1.25 u/well and 2.5 u/well.
Two PARP1 inhibitors were tested: 4ANI and 3AB in concentrations mentioned in 3.2.1.
10 mkM NAD+ was used in reactions.
Reaction was set up as in 3.2.2.
Figure 2.
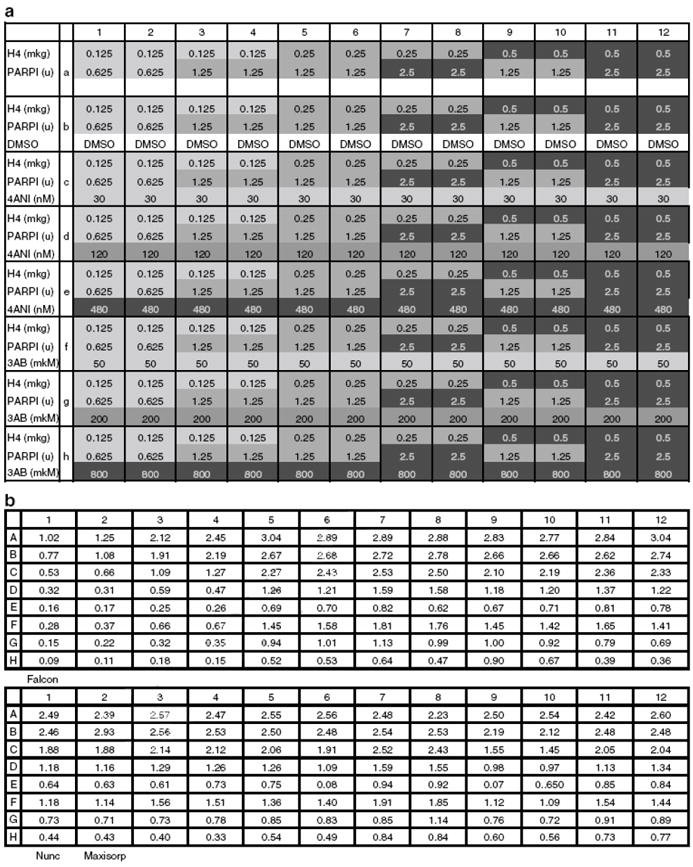
Optimization of H4 Amount and Plate Type
(a) Plate setup for optimization of histone H4 amount and plate type optimization. Amount of PARP used in reaction: columns 1, 2: 0.625 u; columns 3-6 and 9, 10: 1.25 u; columns 7, 8 and 11, 12: 2.5 u. Amount of H4 used to coat one well: columns 1-4: 0.125 mkg; columns 5-8: 0.25 mkg; columns 9-12: 0.5 mkg. 4ANI concentration used: row C: 30 nM; row D: 120 nM; row E: 480 nM. 3AB concentration used: row F: 50 mkM; row G: 200 mkM; row H: 800 mkM. DMSO: row B.
(b) Absorbance reading data.
Figure 3.
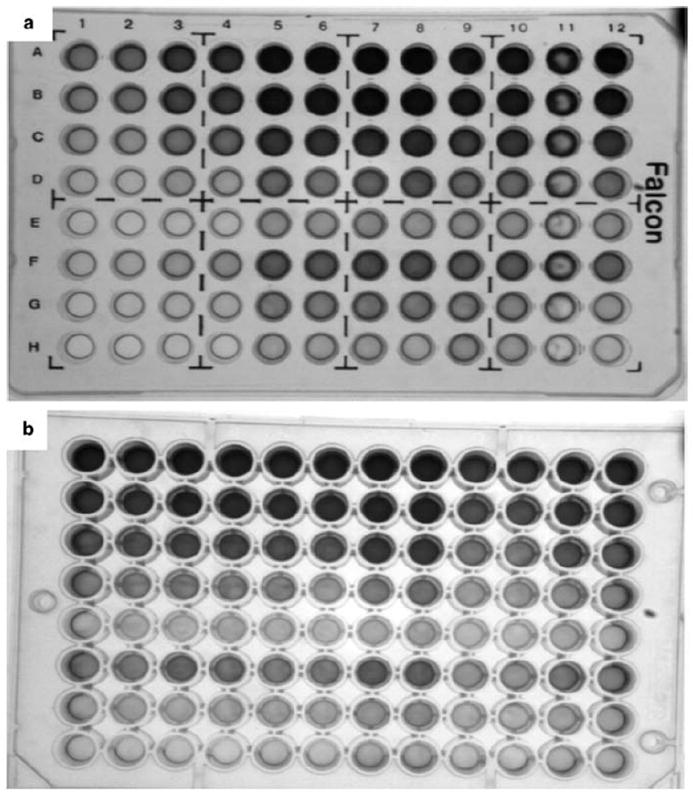
Plate type optimization. Comparison of Falcon 353912 and Nunc Maxisorp plates
(a) Falcon 353912 plate.
(b) Nunc Maxisorp plate. Nunc Maxisorp plate shows much better reading (even at lowest amounts of H4 (0.125 mkg/well) and PARP1 (0.625 u/well)).
Nunc Maxisorp plate had much more sensitivity (even lowest amounts of H4 (0.125mkg/well) and PARP1 (0.625u/well) gave a good reading); therefore, all further experiments were done using this kind of plate.
3.2.4. Further optimization of H4 and PARP1 amounts / increasing the sensitivity by addition of Stop solution
Four H4 concentrations were tested: 0.0156 mkg/well, 0.0312 mkg/well, 0.0625 mkg/well and 0.125 mkg/well.
Two concentrations of PARP1 were tested: 0.312 u/well and 0.625 u/well.
3AB PARP1 inhibitor (800 mkM) was used as a positive hit control.
DMSO was used as a negative hit control.
Reaction not containing 3AB or DMSO was used as a positive control for PARP1 activity.
Reactions were set up as in 3.2.2, developed with Sure Blue HRP substrate reagent, and stopped at different time points with Stop solution (1 N HCl).
See Figure 4. (See Note 8).
Figure 4.
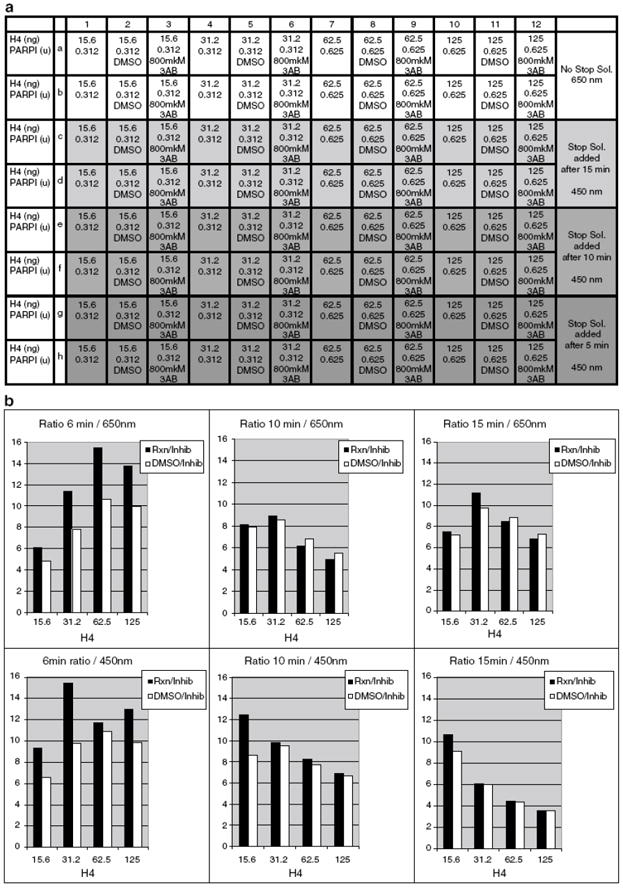
Optimization of H4 and PARP1 amounts. Addition of Stop solution
(a) Plate setup for further optimization of H4 and PARP1 amounts. Addition of Stop solution. Rows A, B – no Stop solution; rows G, H – Stop solution added after 5 min; rows E, F – Stop solution added after 10 min; rows C, D – Stop solution added after 15 min.
(b) Addition of Stop Solution leads to higher sensitivity and better ratio between negative and positive hits at lower concentrations of H4 and PARP1 at shorter incubation times.
It can be observed that applying Stop Solution leads to higher sensitivity or better ratio between negative and positive hits at lower concentrations of H4 and PARP1.
H4 concentration at 0.0156mkg/well and PARP1 concentration at 0.312u/well were therefore chosen for further experiments.
3.2.5. Optimization of blocking conditions
To shorten screening time, blocking of the plate with PBST-5% non-fat milk before PARPI reaction was tried in comparison with the original conditions. Reaction was set up as follows:
Plate was coated with 0.0156mkg H4/well o/n at RT.
Plate was washed with PBST, 200 mkL/well 2× 5 min.
Plate was blocked with 200 mkL/well of PBS-T/ 5% milk for 1 hr at RT.
Plate was washed with PBST, 200 mkL/well 2× 5 min.
Plate was washed with 1x PARP1 buffer, 200 mkL/well 2× 5 min.
Reaction was set up in 50 mkL: 25 mkL of 20 mkM NAD+, and inhibitors were added to wells; 25 mkL of 2x PARP1 mix (5 mkL 10× buffer, 20 mkL water, 0.312 u PARP1) were prepared separately and then distributed to NAD/ inhibitors-containing wells.
Plate was incubated at RT for 1 hr.
Plate was washed with PBST, 200 mkL/well 2× 5 min.
Primary 10H antibodies (1:250 in PBST/milk) were added to the plate, 50 mkL/well.
Plate was incubated at RT for 1 hr.
Plate was washed with PBST, 200 mkL/well 3× 5 min.
Secondary HRP-conjugated antibodies (1:250 in PBST/milk) were added to the plate, 50 mkL/well.
Plate was incubated at RT for 1 hr.
Plate was washed with PBST, 200 mkL/well, 2× 5 min and with PBS 1× 5 min.
Plate was developed with SureBlue reagent, 50 mkL/well.
Absorbance reading was taken at 650 nm.
Stop solution was added, 50 mkL/well, and absorbance reading was taken at 450 nm.
See Figure 5.
Figure 5.
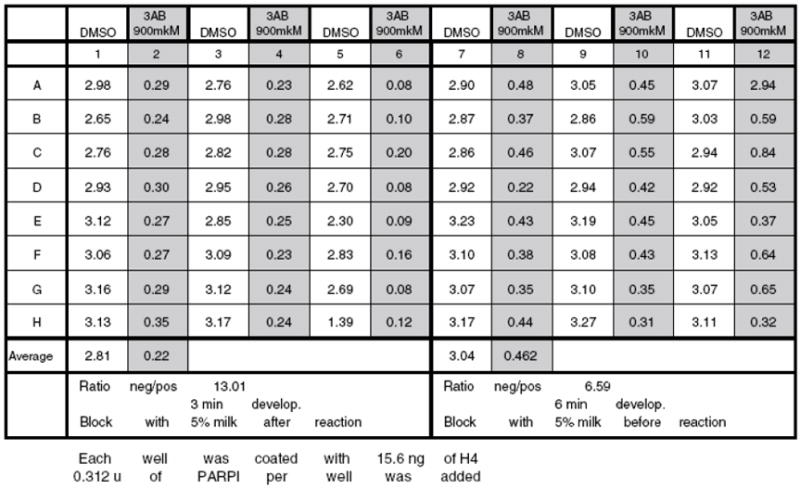
Optimization of Blocking Conditions
Absorbance reading data for optimization of blocking conditions. Blocking with 5% milk after reaction: columns 1-6; blocking with 5% milk before reaction: columns 7 -12. Blocking of a plate with 5% milk before reaction works as well as blocking after reaction. There is a slight decrease in Negative/Positive signal ratio, but this can be attributed to a longer incubation time with Sure Blue HRP substrate reagent (3min vs. 6min).
Here it can be seen that blocking of a plate with PBST- 5% milk before reaction works as well as blocking after reaction. There is a slight decrease in Negative/Positive signal ratio, but this can be attributed to a longer incubation time with SureBlue HRP substrate reagent (3min vs. 6min) (See Note 8). In all further experiments, plates were blocked with 5% milk before PARP1 reaction.
3.2.6. Optimization of primary antibody
Two types of primary antibody were tested: 10H monoclonal (Tulip Biolabs) and anti-PAR polyclonal (Becton Dickinson).
Three dilutions of each antibody were tested: 1:250, 1:500 and 1:1000.
3AB PARP1 inhibitor (800 mkM) was used as a positive hit control.
DMSO was used as a negative hit control.
Reactions were set up as in 3.2.5, developed with SureBlue HRP substrate reagent, and stopped with Stop solution (1 N HCl).
Absorbance reading was taken at 650 nm.
See Figure 6.
Figure 6.
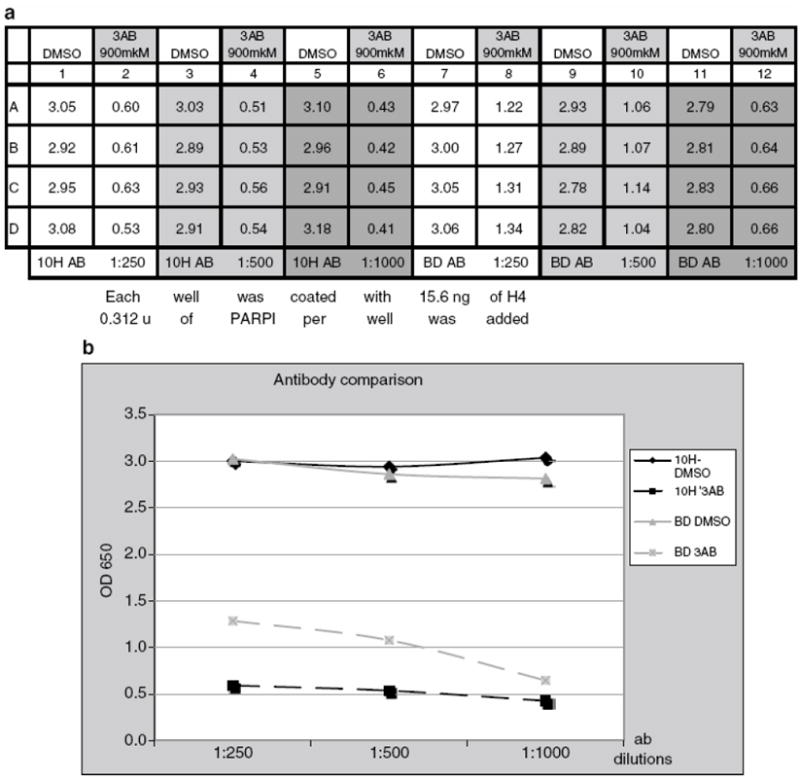
Optimization of Primary Antibody
(a) Plate setup and absorbance readings for optimization of primary antibody. 10H primary antibody dilutions: columns 1, 2, 7, 8: 1:250; columns 3, 4, 9, 10: 1:500; columns 5, 6, 11, 12: 1:1000. Amount of PARP used in reaction: columns 1 - 6: 0.312u; columns 7 - 12: 0.156 u.
(b) Primary antibody comparison. Anti-PAR monoclonal 10H ab (Tulip Biolabs) vs. anti-PAR polyclonal ab (Becton Dickinson). Absorbance curve for BD polyclonal ab steadily goes down with the dilution, while for 10H Ab.
From the data given in Figure 6b, it can be seen that the absorbance curve steadily goes down with the dilution for BD polyclonal antibodies, while for 10H antibodies, more dilutions can be tested.
3.2.7. Primary and secondary antibody optimization: amount of PARP1
Three dilutions of 10H primary antibody were tested: 1:1000, 1:2000 and 1:4000.
Two dilutions of secondary HRP-conjugated goat anti-mouse antibody were tested: 1:1500 and 1:3000.
Two PARP1 concentrations were tested: 0.15 u/well and 0.075 u/well.
3AB PARP1 inhibitor (800 mkM) was used as a positive hit control.
DMSO was used as a negative hit control.
Reactions were set up as in 3.2.5, developed with SureBlue HRP substrate reagent, and stopped with Stop solution (1 N HCl).
Absorbance reading was taken at 450 nm.
See Figure 7.
Figure 7.
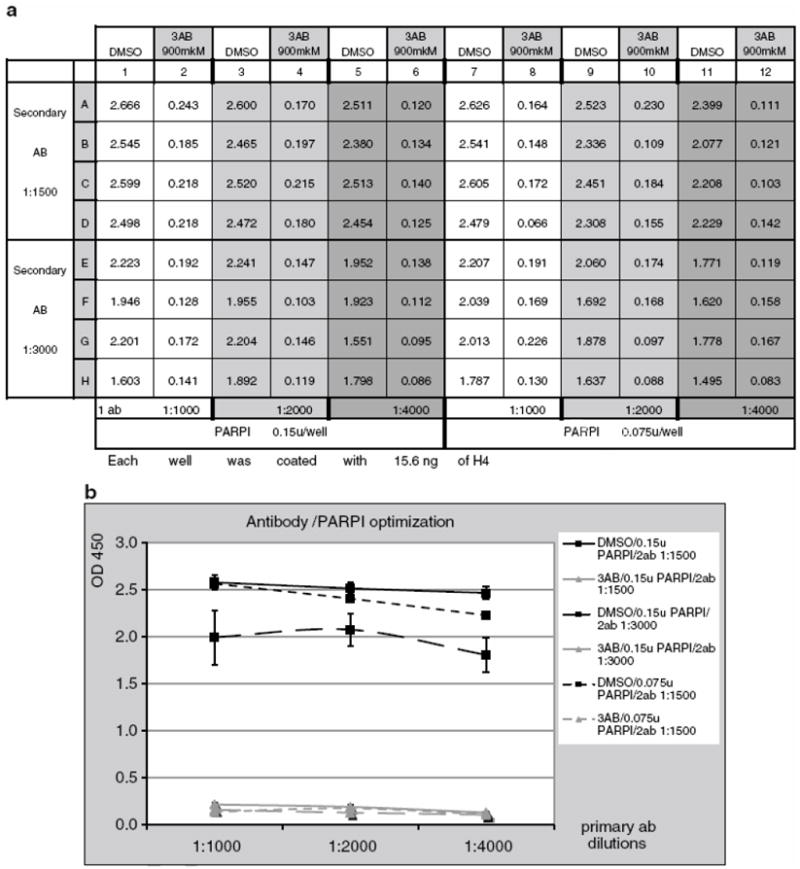
Primary and Secondary Antibody Optimization, Optimization of PARP1 Amount
(a) Plate setup and absorbance readings for primary and secondary antibody optimization and optimization of PARP1 amount. 10H primary antibody dilutions: columns 1, 2, 7, 8: 1:1000; columns 3, 4, 9, 10: 1:2000; columns 5, 6, 11, 12: 1:4000. Amount of PARP used in reaction: columns 1-6: 0.15 u and columns 7 -12: 0.075U. Secondary antibody dilutions: rows A-D: 1:1500; rows F-H: 1:3000.
(b) Primary and secondary antibody dilutions optimization. Amount of PARP1 in reaction. Secondary antibody dilution 1:3000 reduces sensitivity of reaction, while for primary antibody, a dilution of 1:4000 will also give a good DMSO/3AB signal ratio. Decreasing the amount of PARP1 to 0.075 U/well also does not significantly change DMSO/3AB signal ratio.
Note that secondary antibody dilution of 1:3000 reduces reaction sensitivity, while for primary antibody even a 1:4000 dilution gives a good DMSO/3AB signal ratio. Decreasing the amount of PARP1 to 0.075 U/well also does not significantly change DMSO/3AB signal ratio.
In further experiments, 1:1500 dilution of secondary antibody was used along with 0.075 u/well of PARP1 enzyme.
3.2.8. Reaction time optimization
Two reaction times were compared: 30 min and 60 min.
Reactions were set up as in 3.2.5, with 0.075 u/well of PARP1 enzyme and 1:4000 primary antibody dilution.
3AB PARP1 inhibitor (800 mkM) was used as a positive hit control.
DMSO was used as a negative hit control.
See Figure 8.
Figure 8.
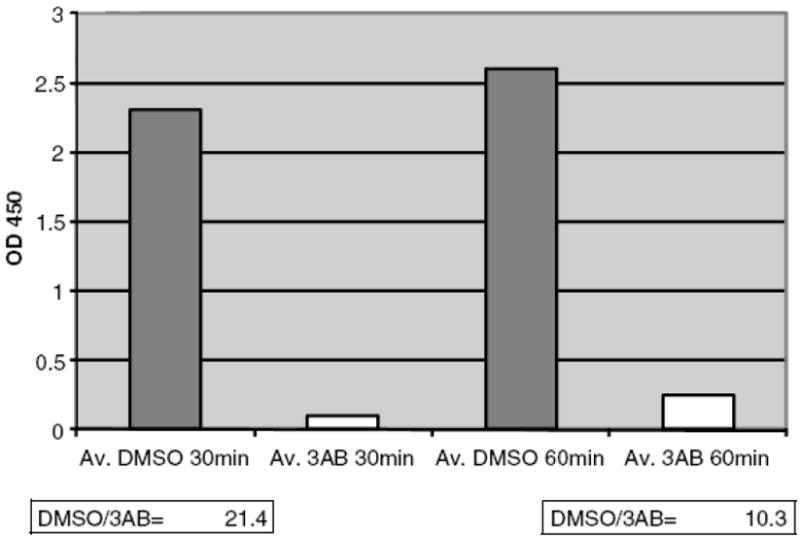
Reaction Time Optimization. DMSO/3AB signal ratio for 30 min reaction time (21.4) is almost 2 times higher than for a reaction time of 60 min (10.3).
As can be seen in Figure 8, DMSO/3AB signal ratio is almost 2-fold higher with a reaction time of 30 min, as opposed to a reaction time of 60 min. Therefore, a reaction time of 30 min was used in the screening experiments (See Note 9).
3.2.9. Reaction setup optimization
Originally, reaction was set up as follows: 25 mkL of 20 mkM NAD+ were distributed to H4-coated wells; then 93 nL of library were added to each well by CyBio Robotic Transfer. 2x PARP1 mix was prepared separately as follows: 5 mkL 10x PARP1 buffer and 20 mkL water, together with 0.0075 mkL PARP1, were mixed in a well with NAD/compound mixture.
To make robotic transfer more consistent, the original volume of NAD+ solution was increased to 40 mkL: 25 mkL 20 mkM NAD and 15 mkL water. Volume of PARP1 mix was reduced to 10 mkL: 5 mkL 10x PARP1 buffer, 5 mkL water and 0.0075 mkL PARP1 (See Note 10).
3.3. Z-Factor
Z-Factor is a simple statistical parameter for high-throughput screening assays. Z-score is a useful tool for evaluating the quality of such assays and should be used for assay validation before performing a screening (12, 13) (See Note 11).
3.3.1. Experimental part
Prepare a master plate, i.e., a plate which has alternating rows of negative and positive hit controls. Use DMSO as negative hit control and 45 mM 3AB as positive hit control.
All steps should be done using automatization.
For experimental plate, follow the general protocol, steps 1-6.
Use the master plate to add hit controls to experimental plate.
Follow the general protocol, steps 8-20.
3.3.2. Statistics
Save your data as a Microsoft Excel file.
Calculate Z-Factor: Z’=1-3(SDneg-SDpos)/(Mneg-Mpos) where SDneg and Mneg = standard deviation and mean of negative control, SDpos and Mpos = standard deviation and mean of positive control.
Z- Factor value should be 0.5 or greater on 3 separate days.
Figure 9.
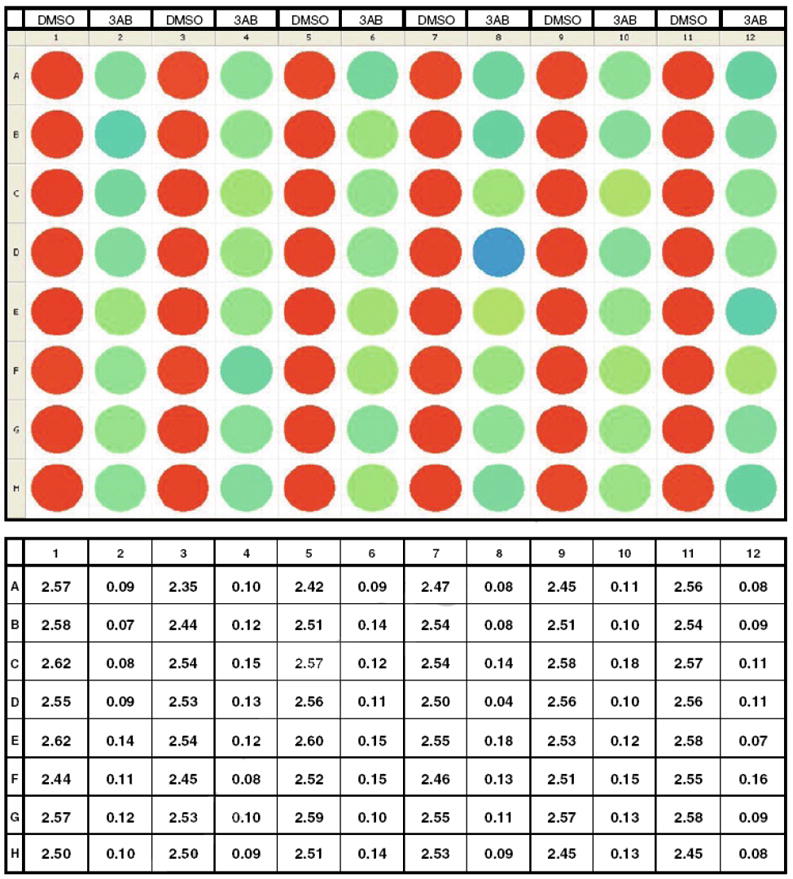
Z-score Experiment. Plate layout, color distribution and numeric values for DMSO as a negative hit and 3AB as a positive hit.
Figure 10.
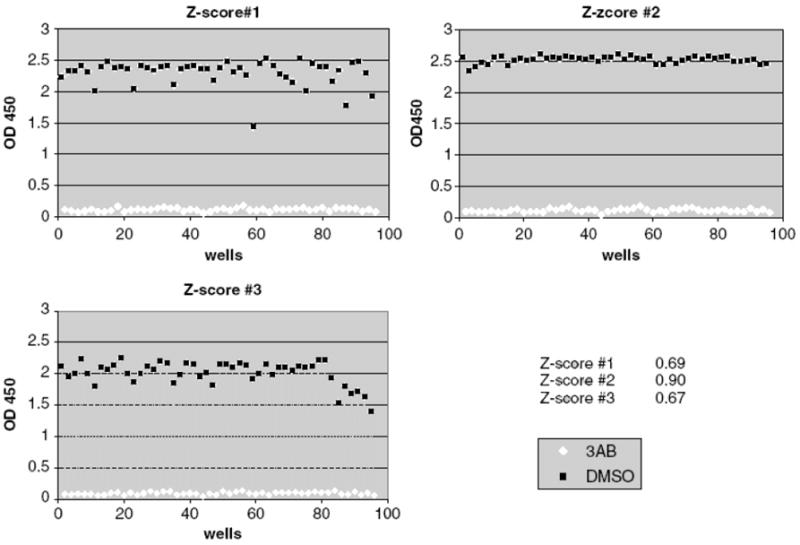
Z-score Graphs. Z-score graphs for experiments done on three different days.
3.4. Evaluation of small molecule drug collection (ICCB Known Bioactives) for PARP1 inhibitors (general protocol)
Dissolve1 mkg of H4 in 5.5 mL PBS.
To coat 96-well plates with PARP1 activator, add 50 mkL of H4 solution to each well using reagent dispenser (Matrix Wellmate), seal plates and incubate overnight at RT.
Next morning, wash plates 3 times × 5 min with PBST (1 × PBS with 0.05% Tween 20) using automatic plate washer.
Block wells against nonspecific pADPr binding with 200 mkL of blocking buffer (PBST + 5% Milk) for 1 hr at RT. Blocking solution is added by reagent dispenser (Matrix Wellmate).
Wash plates 2 times × 5 min with PBST (1 × PBS with 0.05% Tween 20) and 1 time × 5min with 1x PARP assay buffer (50 mM Tris-HCl, pH 8.0, 25 mM MgCl2, 0.1% TritonX100).
Immediately after removal of the last wash, add 40 mkL of NAD+ master mix (25 mkL of 20 mkM NAD+, 4 mkL 10x PARP1 buffer, 11 mkL H2O) to each well (Matrix Wellmate).
After that, transfer 93 nL/well of ICCB Known Bioactives by CyBio Robotic Transfer.
Each plate contains a negative hit control (DMSO, 93 nL/well).
Each plate contains a positive hit control (0.45M and 0.037M 3-AB in DMSO, 93 nL/well).
While robotic transfer is underway, prepare PARP1 master mix sufficient for 100 reactions per each 96-well plate as follows: 892.5 mkL ddH20 combined with 100 mkL of 10x PARP buffer and 0.75 mkL of PARP1 (10u/mkL). 10 mkL of master mix is distributed to each well by Matrix Wellmate dispenser.
Incubate reactions at room temperature for 30 min.
Wash plates 3 times × 5 min with PBST.
During last PBST wash, dilute primary antibody, 10H monoclonal (Tulip Biolabs), at 1:4000 in blocking buffer.
Add 50 mkL of 10H primary monoclonal antibody to each well (Matrix Wellmate) and incubate for 1 hr at room temperature.
Wash plates 3 times × 5 min with PBST.
Add 50 mkL of secondary anti-mouse HRP-conjugated antibody (1:1500 in blocking buffer) to each well (Matrix Wellmate) and incubate for 1 hr at room temperature.
Wash plates 3 times × 5min with PBST and 1 time with PBS.
After the last washing step, add 50 mkL of SureBlue HRP Substrate to each well (Matrix Wellmate) and allow plates to develop color for 3-10 min at RT. Check color development by reading absorbance at 650 nm on Perkin Elmer Envision Plate Reader.
When OD650 is about 0.900, add 50 mkL of Stop solution (1 N HCl) to each well (Matrix Wellmate).
Read plates on Perkin Elmer Envision Plate Reader at 450 nm.
See Figure 11 and 12 (See Note 12).
Figure 11.
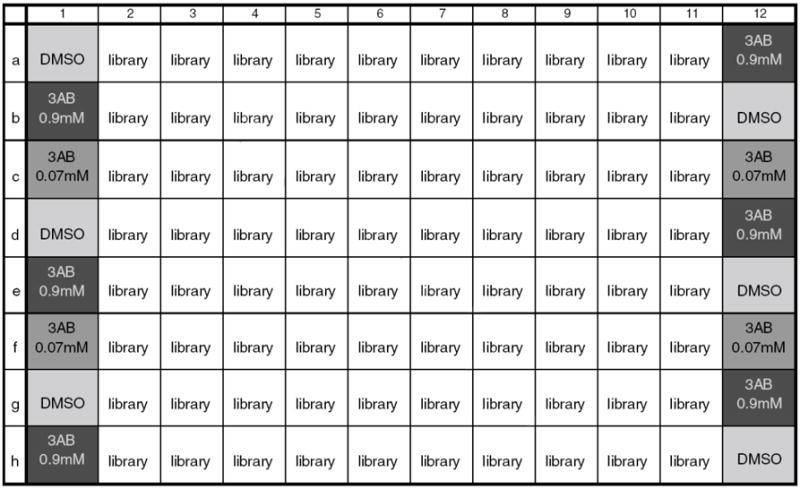
ICCB Known Bioactives Library Screening. Plate setup for ICCB Known Bioactives library screening.
Figure 12.
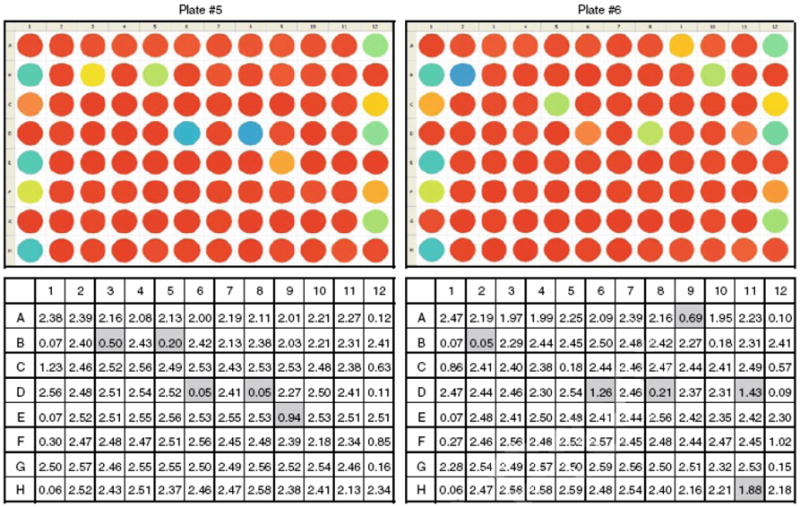
ICCB Known Bioactives screening (plates #5 and #6): color distribution and absorbance reading data. Columns 1 and 12 - positive and negative controls. Columns 2-11 – library substances. Well D8 gives a false-positive signal on each of 6 plates and thus should be disregarded.
3.5. Determination of which PARP1 activation pathway (DNA or protein-dependent) potential inhibitors affect
To assess whether several known inhibitors proceed in a DNA-independent pathway, we will compare the degree of inhibition of DNA and H4-dependent PARP1 activation.
Dilute potential inhibitors to 5 mg/mL in DMSO.
Set up reactions as follows: 25 mkL 200 mkM NAD+ are distributed to Eppendorf tubes, (reactions are set up in duplicate: for H4 and DNA activation), mixed with H4 (1 mkg) or DNA (0.1 mkg), and then inhibitors are added to each of those tubes (1 mkL/50 mkL reaction).
Use DMSO as a negative control.
Meanwhile, prepare 24 mkL 2x PARP1 reaction buffer per reaction and quickly mix it with NAD/activator/inhibitor mix. Amount of PARP1 is 7.5 U/reaction.
Incubate reactions for 30 min at RT.
After 30 minutes, add 20 mkL 4× Laemmli buffer to the tubes in the same order that PARP reaction buffer was added and mix well. Place tubes heating block at 95 C for 5 min.
Meanwhile, make 600 mL 1× MES running buffer for each running chamber to be used (each chamber holds two gels). Prepare an appropriate number of Invitrogen 4-12% Bis -Tris 1.0 mm 10-well gels and rinse them with ddH2O to remove storage buffer. Remove combs and place gels in electrophoresis apparatus along with 600 mL running buffer.
After 5 min incubation at 95°C, spin down the samples for 5 min at 14,000g in Eppendorf centrifuge.
Load 10 mkL of BenchMark protein ladder into the first lane and load 25 mkL of samples into subsequent lanes. Run gels at 150 V constant voltage until running marker reaches foot of gel (45-50 min). Meanwhile, prepare 2.5 L of 1x Invitrogen transfer buffer with 20% methanol and place it in a cold room.
When gel is finished running, prepare transfer sandwich in chilled 1× transfer buffer using case with sponges, 2.5 mm paper, Whatman 3MM paper, and nitrocellulose transfer membrane. Remove bubbles from sandwich and place the case in a transfer chamber with 2.5 liters of buffer. Run the transfer at 600 mA constant current for two hrs in a cold room.
While transfer is running, make 500 mL of 1x PBS with 0.1% Tween-20 (PBST) and prepare 100 mL of 5% nonfat dried milk solution in PBST. Block membrane with 5% nonfat milk solution at room temperature for 1 hr on a rocker.
Meanwhile, prepare primary antibody (10H anti-pADPr mouse monoclonal) solution: 1:500 in PBST-5% milk. Incubate membranes in antibody solution for 2 hrs at room temperature with rocking.
Wash membranes 3 times × 10 min with PBST at room temperature with rocking.
Meanwhile, prepare secondary antibody (goat anti-mouse HRP-conjugated) solution: 1:2500 in PBST-5% milk. Incubate membranes in antibody solution for 2 hrs at room temperature with rocking.
Wash membranes 2 times ×10 minutes in PBST and 1 ×10 min in PBS at room temperature with rocking.
Just prior to the end of the last wash, prepare ECL solution according to manufacturer’s instructions. Soak membranes in ECL for 1 min and blot them on filter paper so that no solution remains pooled on them, but they are still damp. Transfer membranes to film cassette and place them between two sheets of lamination paper. Remove any remaining solution along with air bubbles by using a paper towel over the lamination paper. Expose them to X-ray films to desired intensity in a dark room.
See Figure 13a.
Figure 13.
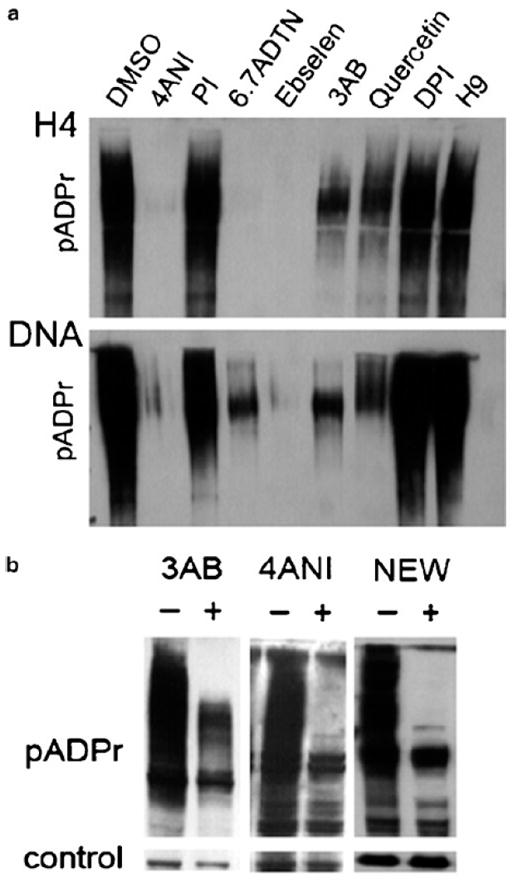
(a) Western blot as an alternative in vitro method to confirm screening results. Potential inhibitors should be titrated to find the best working concentration.
(b) Treatment of HR6 breast cancer cells with known PARP1 inhibitors 3AB, 4ANI and inhibitor discovered during the pilot screen (NEW). Reduction of poly(ADP)ribosylation can be seen on Western blot for inhibitor-treated cells in comparison with DMSO-treated cells.
3.6. Cell culture assay
Plate BT474 or HR6 breast cancer cells onto 6-well plates at 5×10⁵ per well and grow overnight in 37°C tissue culture incubator (14).
Next morning, remove old media from the wells and add new media containing inhibitors. (Inhibitors should be titrated to determine the best working concentration.)
Use DMSO as a negative control.
Use 3AB and 4ANI as positive controls.
Let cells grow for 24 hrs in 37°C tissue culture incubator.
After 24 hrs, collect cells, wash them with PBS and lyse them with 300 mkL of 1× Laemmli buffer, transfer to Eppendorf tubes.
Vortex lysed cells for 15-20 s, place them on 95°C heating block for 5 min, and centrifuge at 13,000g for 5 min.
Load 30 mkL of lysates on 4-12% Bis-Tris protein gel (Invitrogen).
For protein gel, transfer and Western blotting condition, follow 3.5, steps 9-16.
See Figure 13b.
4. Notes
In order to get a good protein expression, cells must be induced while they are in exponential growth phase (OD 590 less than 0.6).
The best way to do the sonication using a large tip is to use shortened 50 mL tubes, as the tip itself is wide and short. Tubes can be cut with a hot sharp knife.
Inclusion bodies pellet might be very sticky. Thus, it may be necessary to loosen it with a spatula or a pipette tip before adding unfolding buffer to it.
Usually, about 15-20 fractions are collected. Mix 10 mkL of each fraction with 10 mkL of 2x LaemLi buffer in an Eppendorf tube, boil for 5 min, and load fractions on 4-12% gel. As histone H4 is a small protein, use MES running buffer.
Prior screening of a substance library for possible hits, it is necessary to optimize conditions to get the best ratio between positive and negative signal. Total cost of the screening should also be taken into consideration.
Well bottom should be evenly covered with liquid such that the 50 mkL drop does not sit in one corner.
After addition of SureBlue Reagent, blue color develops very fast. Therefore, absorbance reading should be performed within 1-3 minutes
To get the best reading at 450 nm, color development must be monitored after addition of SureBlue Reagent. Take a 650 nm reading every minute. Add Stop solution when 650nm reading for DMSO wells is about 0.9-1.1. Time can vary from 1min to 10 min. Take 450 mn reading. DMSO wells will show a signal of about 2.4-2.8. A 450 nm reading above 3.0 means that signal has reached saturation and, as a consequence, has become unreliable.
In this experiment, it can be seen that the 3AB signal reading increases with time, but the DMSO reading barely changes. This can be explained by incomplete inhibition of PARP1 reaction. Longer time provides possibility for PARP1 to accomplish its task under inhibiting conditions.
The 25 mkL solution originally used barely covers the bottom of the well. Liquid meniscus is quite low in the middle of the well, and needles of Robotic Transfer do not always touch the liquid in the well (no transfer) or transfer is inconsistent amount of substances.
Two parameters should be considered while conditions for a screening assay are developed: dynamic range and variability. Dynamic range is Positive/Negative hit controls ratio. The higher this ratio is the better. Variability is a degree of signal dispersion for these controls. Ideally, it should be as low as possible.
As can be seen form these data, well D8 gives a false-positive signal and should be disregarded.
Acknowledgments
We thank Dr. M. Einarson of the FCCC Translational Facility for her advice and assistance with small molecules collection screening experiments, Dr. I. Serebriiskii for helpful discussions, and Dr. M. Robinson for BT474 and HR6 breast cancer cell lines. The research was supported by grants from the National Institutes of Health (R01 DK082623) to A.V.T.
References
- 1.Satoh MS, Lindahl T. Role of poly(ADP-ribose) formation in DNA repair. Nature. 1992;356(6367):356–358. doi: 10.1038/356356a0. [DOI] [PubMed] [Google Scholar]
- 2.Kim MY, Mauro S, Gevry N, Lis JT, Kraus WL. NAD-Dependent Modulation of Chromatin Structure and Transcription by Nucleosome Binding Properties of PARP-1. Cell. 2004;119:803–814. doi: 10.1016/j.cell.2004.11.002. [DOI] [PubMed] [Google Scholar]
- 3.Curtin NJ. PARP inhibitors for cancer therapy. Expert Rev Mol Med. 2005;7:1–20. doi: 10.1017/S146239940500904X. [DOI] [PubMed] [Google Scholar]
- 4.Virag L, Szabo C. The therapeutic potential of Poly(ADP-Ribose) Polymerase inhibitors. Pharmacological Reviews. 2002;54:375–429. doi: 10.1124/pr.54.3.375. [DOI] [PubMed] [Google Scholar]
- 5.Haince JF, Poirier GG, Kirkland JB. Nonisotopic methods for determination of poly(ADP-ribose) levels and detection of Poly(ADP-Ribose) Polymerase. Current Protocols in Cell Biology. 2003:18.7.1–18.7.26. doi: 10.1002/0471143030.cb1807s21. [DOI] [PubMed] [Google Scholar]
- 6.Ritter CA, et al. Human Breast Cancer Cells Selected for Resistance to Trastuzumab In vivo Overexpress Epidermal Growth Factor Receptor and ErbB Ligands and Remain Dependent on the ErbB Receptor Network. Clin Cancer Res. 2007;13:4909–4919. doi: 10.1158/1078-0432.CCR-07-0701. [DOI] [PubMed] [Google Scholar]
- 7.Luger K, Rechsteiner TJ, Richmond TJ. Expression and purification of recombinant histones and nucleosome reconstitution. Methods Mol Biol. 1999;119:1–16. doi: 10.1385/1-59259-681-9:1. [DOI] [PubMed] [Google Scholar]
- 8.Luger K, Rechsteiner TJ, Richmond TJ. Preparation of nucleosome core particle from recombinant histones. Methods Enzymol. 1999;304:3–19. doi: 10.1016/s0076-6879(99)04003-3. [DOI] [PubMed] [Google Scholar]
- 9.Monti D, et al. Cell death protection by 3-aminobenzamide and other poly(ADP-ribose)polymerase inhibitors: different effects on human natural killer and lymphokine activated killer cell activities. BBRC. 1994;199:525–530. doi: 10.1006/bbrc.1994.1260. [DOI] [PubMed] [Google Scholar]
- 10.Schlicker A, et al. 4-Amino-1,8-naphthalimide: a novel inhibitor of poly(ADP-ribose) polymerase and radiation sensitizer. Int J Radiat Biol. 1999;75:91–96. doi: 10.1080/095530099140843. [DOI] [PubMed] [Google Scholar]
- 11.Banasik M, et al. Specific inhibitors of poly(ADP-ribose) synthetase and mono(ADP-ribosyl)transferase. J Biol Chem. 1992;267:1569–1575. [PubMed] [Google Scholar]; Zhang JH, et al. A Simple Statistical Parameter for Use in Evaluation and Validation of High Throughput Screening Assays. Journal of Biomolecular Screening. 1999;4(2):67–73. doi: 10.1177/108705719900400206. [DOI] [PubMed] [Google Scholar]
- 12.Iversen PW, et al. A comparison of Assay Performance Measures in Screening Assays: Signal Window, Z’ Factor, and Assay Variability Ratio. Journal of Biomolecular Screening. 2006;11(3):247–252. doi: 10.1177/1087057105285610. [DOI] [PubMed] [Google Scholar]
- 13.Gottipati P, et al. Poly(ADP-Ribose) Polymerase is Hyperactivated in Homologous Recombination-Defective Cells. Cancer Res. 2010;70:5389–5398. doi: 10.1158/0008-5472.CAN-09-4716. [DOI] [PubMed] [Google Scholar]


