Abstract
We have recently identified a series of compounds which efficiently inhibit Anthrax lethal factor (LF) metallo-protease. Here we present further structure activity relationship and CoMFA (Comparative Molecular Field Analysis) studies on newly derived inhibitors. The obtained 3D QSAR model was subsequently compared with the X-ray structure of the complex between LF and a representative compound. Our studies form the basis for the rational design of additional compounds with improved activity and selectivity.
Anthrax is an infectious disease caused by the bacterium Bacillus anthracis.1 This rod shaped bacterium infects humans through the respiratory system, skin, or digestive tract. Dependent upon the entry route into the human body, Anthrax can be highly lethal. Although cutaneous Anthrax is rarely lethal, inhalation Anthrax is dangerous and usually fatal.2 Upon inhalation, the Anthrax spores adhere to the alveolar macrophages and germinate. Bacteria migrate to the lymph node, in which they rapidly multiply and excrete a tripartite exotoxin comprised of protective antigen (PA, 83 kDa), lethal factor (LF, Zn2+- metalloproteinase, 90 kDa) and calmodulin-activated edema factor adenylate cyclase (EF, 89 kDa).3,4 The combined actions of these proteins constitute the Anthrax toxins (AT) which induce cell death. Unless properly and promptly treated, inhalation anthrax will lead to the death of the host organism.5
Initially, PA binds to an AT receptor on the host cell surface, where it is cleaved by a furin-like protease to produce a 20 kDa N-terminal fragment (PA20) and a 63 kDa C-terminal fragment (PA63).6 PA63, which remains bound to the membrane, oligomerizes into a heptameric prepore capable of binding LF and EF.7 Upon binding of LF and EF, the complex undergoes receptor mediated endocytosis and the PA63 conformational change allows the two enzymatic moieties LF and EF to translocate into the cell cytosol. Once in the cytosol, LF is then able to cleave several members of the MAPKK family near the N-terminus.8–10 This cleavage prevents interaction with, and phosphorylation of, downstream MAPK, thereby inhibiting one or more signaling pathways through a mechanism not yet understood.11
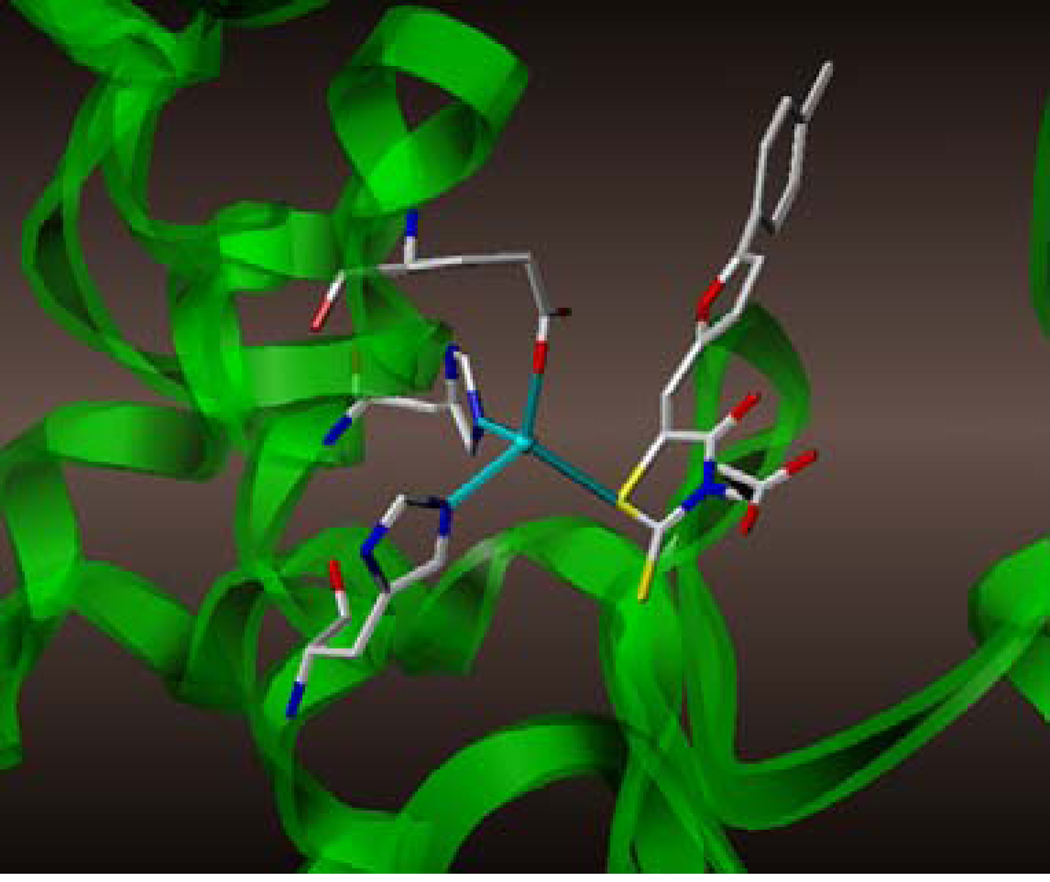
With the long term goal of developing novel potential treatments for Anthrax disease, we previously identified several small molecule inhibitors that inhibit Anthrax LF protease activity with IC50’s in sub-micromolar range.12 Cell based and peptide cleavage assays were subsequently used to confirm the potency of the iterate leads. The most potent compounds were subsequently tested in mice models of the diseases showing a protection against Bacillus anthracis spores, when used in combination with the antibiotic ciproflaxin.12 Initial structure activity relationship (SAR) data suggested that the presence of multiple substitutions on the phenyl ring significantly increases the inhibitory activity.12 Furthermore, details of the 3D structure of the complex between LF and a representative compound 1 (BI-MFM3), revealed that the rhodanine ring is capable of interacting with Zn2+ metal-ion via the thiazolidinedione sulfur atom (Figure 1).12
Figure 1.
Detail of the X-ray structure of compound 1 in complex with LF (PDB_ID 1ZXV). Side chains of Zn2+ coordinating amino-acids are displayed.
In this work, we report on further synthesis and SAR studies in which we explored the relative importance of various chemical substructures of 1 in inhibiting the protease activity of LF. In this respect, exploration of substituting the rhodanine ring with thiazolidinedione, thiobarbituric acid, creatinine and creatinine acetic acid was investigated. In addition, we synthesized a set of analogues in which we varied the nature of the phenyl and furan rings, as well (Tables 1 and 2). The synthesis of each compound was achieved in part as described in our previous work11 by preparing the appropriate aldehyde derivatives and by using a final condensation step using the Knoevenagel reaction.13 The latter was carried out either under reflux in acetic acid or by using microwave assisted conditions.14–16 The compounds were obtained with average yields ranging from 80 to 96 %. The details of the experimental conditions are reported as supplementary information. Once synthesized and characterized, we then performed an enzymatic assay to evaluate the inhibitory activity of the resulting compounds against LF. A fluorescence peptide cleavage assay (100 µL) was performed in a 96 well plate. Each reaction consisted of MAPKKide (4 µM) and LF (50 nM) (Lists Biological Laboratories) in 20 mM Hepes, pH 7.4, and the small-molecule inhibitor. Kinetics of the peptide cleavage was examined for 30 min by using a fluorescent plate reader at excitation and emission wavelengths of 485 and 590 nm, respectively, and IC50 values were obtained by dose response measurements. For a number of compounds, Lineweaver-Burk analysis was also carried out to verify that the compounds are competitive against the substrate.12
Table 1.
Inhibitory Activity and Training Set Data for QSAR. ND (not determined) indicates compounds not included in the analysis.
| pIC50 | ||||
|---|---|---|---|---|
| # | Structure | IC50 | Obs | Calc |
| 1 | 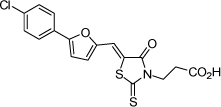 |
1.7 µM | 5.77 | 5.74 |
| 2 | 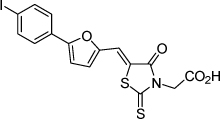 |
1.7 µM | 5.25 | 5.44 |
| 3 | 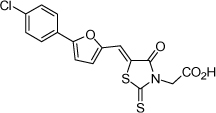 |
0.9 µM | 6.05 | 6.14 |
| 4 | 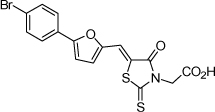 |
0.85 µM | 6.07 | 6.14 |
| 5 | 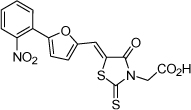 |
3.1 µM | 5.51 | 5.48 |
| 6 | 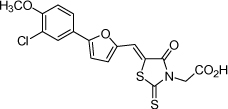 |
0.30 µM | 6.53 | 6.61 |
| 7 | 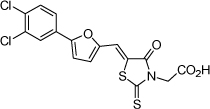 |
0.26 µM | 6.58 | 6.36 |
| 8 | 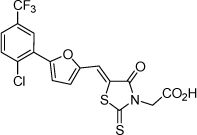 |
0.19 µM | 6.71 | 6.77 |
| 9 | 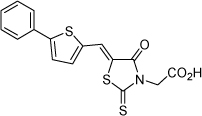 |
0.74 µM | 6.13 | 6.02 |
| 10 |  |
79.4 µM | 4.10 | 4.15 |
| 11 | 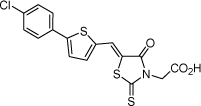 |
3.2 µM | 5.49 | 5.48 |
| 12 |  |
1.6 µM | 5.80 | 5.65 |
| 13 |  |
72.4 µM | 4.14 | 4.12 |
| 14 | 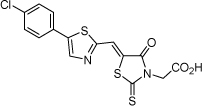 |
10.0 µM | 5.00 | 4.94 |
| 15 | 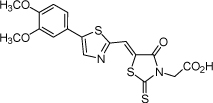 |
5.0 µM | 5.30 | 5.44 |
| 16 | 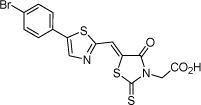 |
4.4 µM | 5.36 | 5.27 |
| 17 | 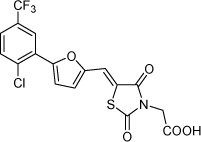 |
5.9 µM | 5.23 | 5.25 |
| 18 |  |
200 µM | 3.70 | ND |
| 19 | 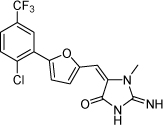 |
100 µM | 4 | ND |
| 20 |  |
>100 µM | >4 | ND |
Table 2.
Inhibitory activity and Test Set Data for the 3D QSAR studies
| pIC50 | ||||
|---|---|---|---|---|
| # | Structure | IC50 | Obs | Pred |
| 21 | 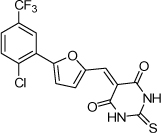 |
1.3 µM | 5.89 | 5.30 |
| 22 | 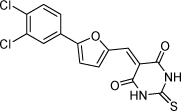 |
2.1 µM | 5.68 | 5.61 |
| 23 | 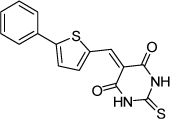 |
1.2 µM | 5.92 | 5.61 |
| 24 | 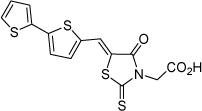 |
2.3 µM | 5.64 | 5.32 |
| 25 | 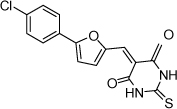 |
4.4 µM | 5.36 | 5.34 |
| 26 | 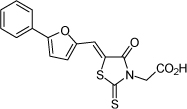 |
16.6 µM | 4.78 | 4.94 |
| 27 | 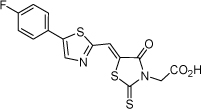 |
22.4 µM | 4.65 | 4.33 |
| 28 | 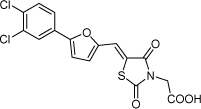 |
5.6 µM | 5.25 | 4.97 |
| 29 | 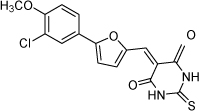 |
3.0 µM | 5.52 | 5.33 |
| 30 | 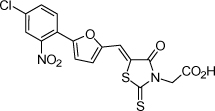 |
0.5 µM | 6.30 | 6.27 |
From the data reported in Tables 1 and 2 it appears clear that substitutions of the rhodanine ring gives the most dramatic effects with a severe loss of activity when the ring is substituted with creatinine or creatinine acetic acid moiety. However, substitution with a thiobarbituric acid ring is allowed. The furan ring can also be substituted with thiophene or a thiazole ring without a dramatic effect on the inhibitory affinity of the resulting compounds, while a variety of substitutions on the phenyl ring are very well tolerated.
To obtain further insights on the mechanism of action of our compounds we have recently obtained the X-ray high-resolution structure for LF in complex with a representative compound, 112 (Figure 1). The data reported in Tables 1 and 2 and the X-ray structure of the complex between compound 1 and LF provided a platform that should enable us to identify the chemical determinants for the activity of the compounds. Details of the three-dimensional structure of the complex between LF and 1 revealed that the rhodanine ring is able to interact with Zn2+ metal-ion via the thiazolidine sulfur atom. It is reasonable to predict that even small changes in this position may largely affect activity. This is observed with closely related compounds in which the rhodanine ring is substituted with a thiazolidinedione ring (for example 17 (BI-11D8) and 28 (BI-11D9); Tables 1 and 2). Likewise, the activity of thiobarbiturates derivatives could be attributed to the presence of the sulfur atom that could presumably interact similarly with the metal ion. Finally, in such scenario, substitution of the rhodanine ring with a creatinine moiety is predicted to abolish the Zn2+-chelating ability of the compounds, with concomitant loss of activity, as indeed observed (Table 1). The carboxylic group of 1 is pointing towards a hydrophilic region of the protein close to its surface (Figure 1), which explains the variability of the substitutions allowed at this position and the increased affinity of the compounds with a small charged group (Table 1 and 2). In addition, hydrophobic interactions between the phenyl ring and hydrophobic side chains of LF were also observed. However, electron density of the benzene ring is less evident in the X-ray structure of 112 indicating a possible conformational mobility around the carbon-carbon bond of the p-substituted benzene ring and the larger available space around this portion of the ligand. These observations correlate with the higher tolerance of substitutions at this position (Tables 1 and 2). Therefore, analysis of the X-ray structure of 1 in complex with LF provides a qualitative interpretation of the structure-activity relationship data reported in Tables 1 and 2. These studies should enable us to design additional compounds with possibly improved affinity, selectivity and drug-likeness.
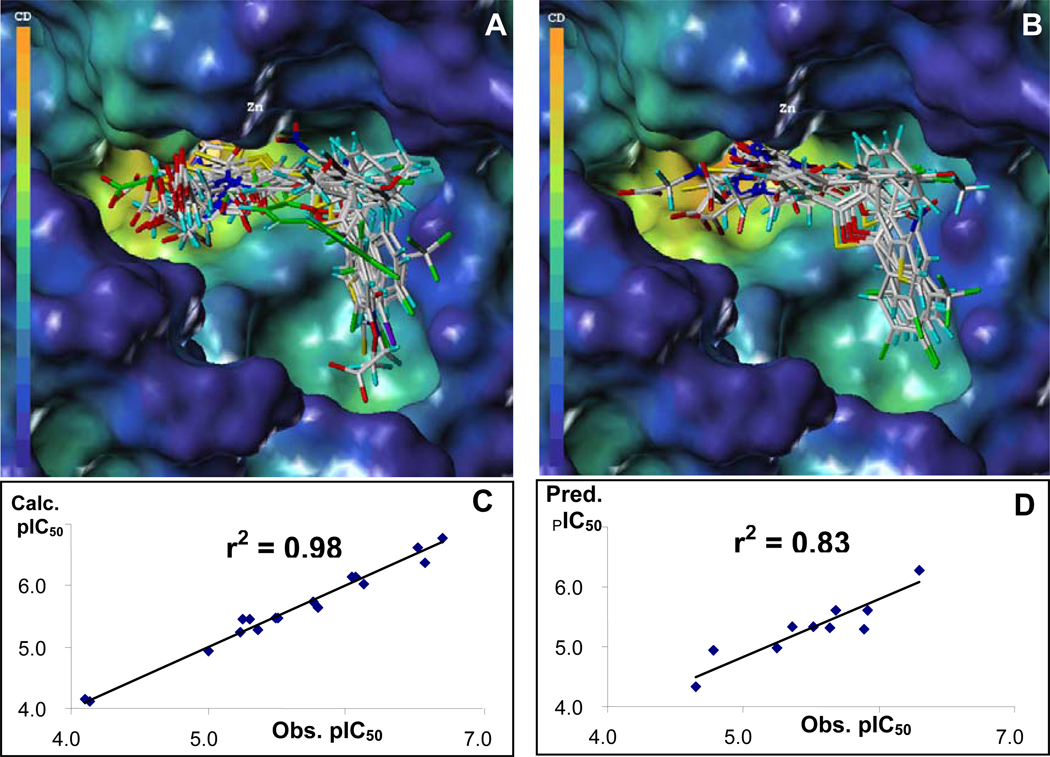
In this respect, having in hand the X-ray structure of a representative compound gives us the possibility to establish an alignment rule for the superposition of the diverse set of derivatives in order to carry out a CoMFA (Comparative Molecular Field Analysis) study.17 It has been shown18,19 that this combined experimental and statistical approach is more robust then using simple in silico docking strategies that are hindered by the lack of suitable force fields and scoring functions especially when the binding site contains metal ions.20 Docking simulations of our novel inhibitors into the LF binding pocket were performed using GOLD 2.221 and by using the GOLD fitness function.21 All torsion angles in each compound were allowed to rotate freely, but the distance between the LF metal ion and the sulfur atom in each inhibitor was constrained (2.5 Å to 3.0 Å). The starting coordinates of the binding sites were taken from the X-ray crystal structure from our previous work (PDB_ID 1ZXV). The preparation and calculation of molecular coordinates of all molecules and CoMFA studies were carried out using SYBYL7.0 (TRIPOS, St. Louis).22 The docked conformations of 17 compounds were used as a training set for the CoMFA study (Table 1, Figure 2A) while the docked structures for 10 additional compounds were used as a test set (Table 2, Figure 2B). However, inhibitors with IC50 values equal and greater then 100 µM and purity lower than 75% (see supplementary information) were not included in the CoMFA. Partial charges for the protein (LF) were assigned from the AMBER02 force field23 and atomic charges for the 27 inhibitors were calculated using PM3 (MOPAC6.0).24 The inhibition constants were expressed in pIC50 values (pIC50 = −log[IC50]), and correlated with the steric and electrostatic fields (CoMFA) as well as the total molecular surface area (TMSA) of each compound. The cross-validation with leave-one-out option and the SAMPLS program,25 rather than column filtering, was carried out to obtain the optimal number of components to be used in the final analysis. After the optimal number of components (four) was determined, a non-cross-validated analysis was performed without column filtering. The q2 (cross-validated r2 of 0.51), SPRESS (cross-validated standard error of prediction of 0.60), r2 (non-cross-validated r2 of 0.98, Figure 2C), and F values (145.94) were computed according to the definitions in SYBYL. The relative contributions to this CoMFA model were 40.9 % for the steric field, 38.5 % for electrostatic field, and 20.6 % for total molecular surface area (TMSA). In order to evaluate the predictive ability of this model, we subsequently calculated the pIC50 values for the 10 compounds in the test set (Figure 2D, Table 2). As it can be seen in Figure 2D, the model exhibits a remarkably good predictive ability (r2 = 0.83). The comparison between the CoMFA contours and the docking site for the compounds is reported in Figure 3 that displays our most active compound, 8 (BI-11B3). In order to evaluate whether the results are biased towards the selected training and test sets, we have also performed additional CoMFA studies in which all 27 compounds were included in the analysis. The resulting cross-validated r2 value by leaving 9 compounds out is 0.54, with similar relative contributions of the steric, electrostatic and TMSA fields (supplementary information).
Figure 2.
Superimpositions of docked conformers used for CoMFA studies. In (A), the structures of the compounds for the training set are displayed, with the compound highlighted in green being compound 1 (whose coordinates are from the PDB_ID 1ZXV). In (B), the aligned structures for the compounds in the test sets are displayed. (C) Calculated versus observed pIC50 values against LF for the compounds in the training set (q2 = 0.51, r2 = 0.98, # components = 4, # compounds = 17). (D) Predicted versus observed pIC50 values against LF for the 10 compounds in the test set.
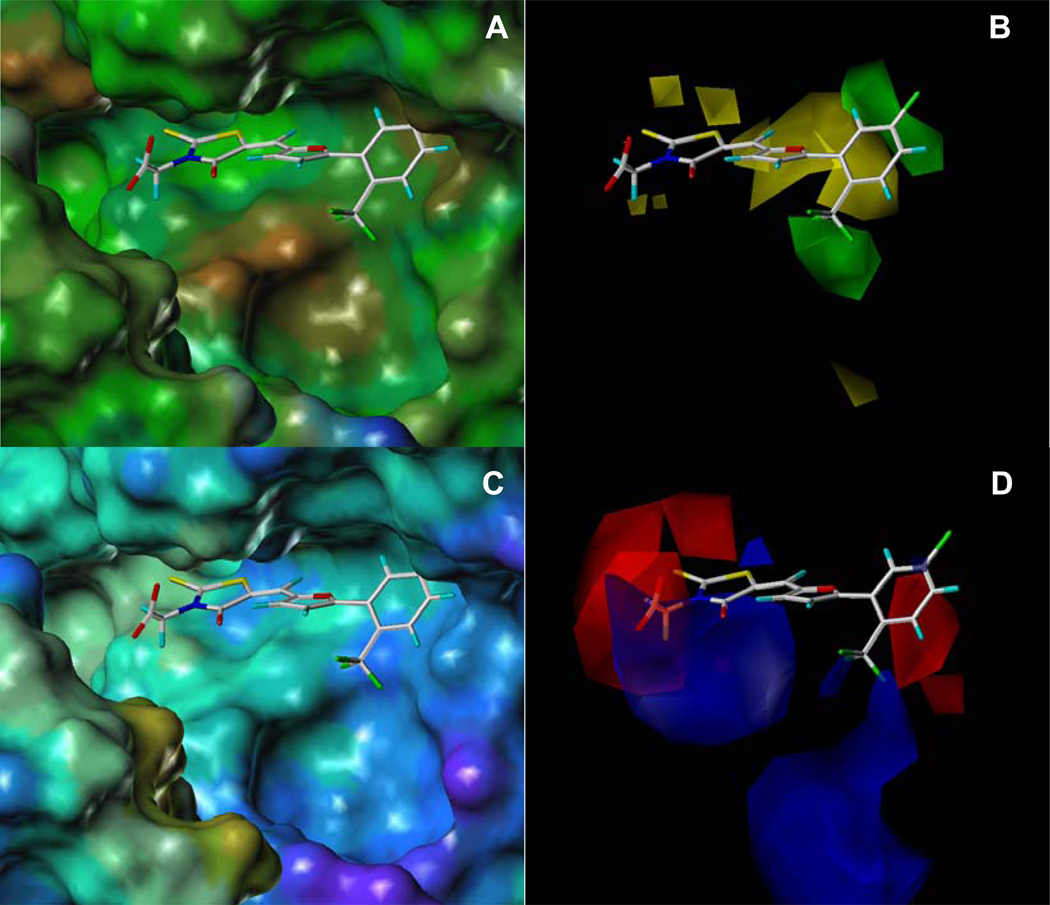
Figure 3.
Comparison of (A) hydrophobic and hydrophilic potential molecular surface (MOLCAD) 26 of the substrate binding site of LF in complex with compound 8 with (B) CoMFA contour plots of steric field contributions. Comparison of the (C) electrostatic potential molecular surfaces (MOLCAD) with (D) CoMFA contour plots of electrostatic field contributions. In (A), the hydrophobic and hydrophilic areas are displayed in brown and blue, respectively, while green surfaces represent an intermediate hydrophobicity. In (B), green contours indicate the regions where the addition of bulky groups may increase activity and yellow contours indicate the regions where the addition of bulky groups may decrease activity. In (C), positive and negative areas are displayed in red and blue, respectively, while cyan surfaces represent neutral areas. The color code follows the definitions of MOLCAD. 26 In (D), blue contours indicate regions where less electronegative groups may increase activity. Red contours indicate regions where more electronegative groups may increase activity.
A comparison of the binding site of LF with the CoMFA contour plots of steric field contribution shows a parallel between favorable steric contours and hydrophobic regions of the protein (Figures 3A ,B). Consequently, a CoMSIA27 analysis in which the steric field is replaced by a hydrophobic term led to similar results (supplementary information). It is also evident that the substrate binding pocket is substantially larger then the compounds particularly around the phenyl group of 8 (Figure 3), which may also explain the positive TMSA contribution to the CoMFA (and CoMSIA) equation. Likewise, there is a very good parallel between the electrostatic potential molecular surfaces of the protein with the electrostatic CoMFA contour plots (Figures 3C,D). Therefore, by using a combination of medicinal chemistry and computational analysis, aided by experimental X-ray data, we were able to rationalize the activity of the compounds in terms of specific interactions with the LF substrate binding site. The resulting 3D QSAR model provides an invaluable tool to estimate the inhibition constants of additional compounds including for example hydroxamic-acid based inhibitors recently reported28, and could therefore be used to prescreen in silico compounds to be synthesized and tested.
In conclusion, we have generated and validated a first series of LF inhibitors with low- to sub-micromolar activity. By using a structure-based approach, we derived a quantitative model that should enable the design of more potent compounds against LF. For example, derivatives of compound 8 that are substituted in the phenyl ring with even larger substituents containing less electronegative groups should result much more potent then the parent compounds. The high level of compatibility between the PLS coefficient contour maps from CoMFA with the molecular surface of the active site of LF provides further validation of the proposed model. Ultimately, it would also be interesting to test all the derived compounds against other related human metallo-proteases and carry out a similar CoMFA analysis to establish if elements that are predicted to confer selectivity could be identified. Such analysis could also be very useful for the design of potent and selective compounds against other therapeutically relevant metalloproteases.
Supplementary Material
Acknowledgements
This work was supported in part by NIH grant 1UO1 AI056385.
Footnotes
Supporting information available: Procedures for the synthesis of the reported compounds and analytical data; Figures S1 and S2 and Table S1 related to additional CoMFA and CoMSIA studies.
References
- 1.Smith H, Keppie J. Observations on experimental anthrax: demonstration of a specific lethal factor produced in vivo by Bacillus anthracis. Nature. 1954;173:869–870. doi: 10.1038/173869a0. [DOI] [PubMed] [Google Scholar]
- 2.Hanna P. Anthrax pathogenesis and host response. Curr. Topics Microbiol. Immunol. 1998;225:13–35. doi: 10.1007/978-3-642-80451-9_2. [DOI] [PubMed] [Google Scholar]
- 3.Hanna P, Acosta D, Collier RJ. On the role of macrophages in anthrax. Proc. Natl. Acad. Sci. USA. 1993;90:10198–10201. doi: 10.1073/pnas.90.21.10198. [DOI] [PMC free article] [PubMed] [Google Scholar]
- 4.Stubbs MT. Anthrax X-rayed: new opportunities for bio-defense. TRENDS Pharmacol Sci. 2002;23:539–541. doi: 10.1016/s0165-6147(02)02127-2. [DOI] [PubMed] [Google Scholar]
- 5.Bradley KA, Mogridge J, Mourez M, Collier RJ, Young JA. Identification of the cellular receptor for anthrax toxin. Nature. 2001;414:225–229. doi: 10.1038/n35101999. [DOI] [PubMed] [Google Scholar]
- 6.Petosa C, Collier RJ, Klimpel KR, Leppla SH, Liddington RC. Crystal structure of Anthrax toxin protective antigen. Nature. 1997;385:833–838. doi: 10.1038/385833a0. [DOI] [PubMed] [Google Scholar]
- 7.Scobie HM, Rainey GJ, Bradley KA, Young JA. Human capillary morphogenesis protein 2. Functions as an anthrax toxin receptor. Proc. Natl. Acad. Sci. USA. 2003;100:5170–5174. doi: 10.1073/pnas.0431098100. [DOI] [PMC free article] [PubMed] [Google Scholar]
- 8.Leppla SH. Anthrax toxin edema factor: a bacterial adenylate cyclase that increases cyclic AMP concentrations of eukaryotic cells. Proc. Natl. Acad. Sci. USA. 1982;79:3162–3166. doi: 10.1073/pnas.79.10.3162. [DOI] [PMC free article] [PubMed] [Google Scholar]
- 9.Vitale G, Pellizzari R, Recchi C, Napolitani G, Mock M, Montecucco C. Anthrax lethal factor cleaves the N-terminus of MAPKKs and induces tyrosine/threonine phosphorylation of MAPKs in cultured macrophages. Biochem. Biophys. Res. Commun. 1998;248:706–711. doi: 10.1006/bbrc.1998.9040. [DOI] [PubMed] [Google Scholar]
- 10.Duesbery NS, Webb CP, Leppla SH, Gordon VM, Klimpel KR, Copeland TD, Ahn NG, Oskarsson MK, Fukasawa K, Paull KD, Vande Woude GF. Proteolytic Inactivation of MAP-Kinase-Kinase by Anthrax Lethal Factor. Science. 1998;280:734–737. doi: 10.1126/science.280.5364.734. [DOI] [PubMed] [Google Scholar]
- 11.Park JM, Greten FR, Li ZW, Karin M. Macrophage apoptosis by anthrax lethal factor through p38 MAP kinase inhibition. Science. 2002;297:2048–2051. doi: 10.1126/science.1073163. [DOI] [PubMed] [Google Scholar]
- 12.Forino M, Johnson S, Wong TY, Rozanov DV, Savinov AY, Li W, Fattorusso R, Becattini B, Orry AJ, Jung D, Abagyan RA, Smith JW, Alibek K, Liddington RC, Strongin AY, Pellecchia M. Efficient synthetic inhibitors of anthrax lethal factors. Proc. Natl. Acad. Sci. U S A. 2005;102:9499–9504. doi: 10.1073/pnas.0502733102. [DOI] [PMC free article] [PubMed] [Google Scholar]
- 13.Wang G-W, Cheng B. Solvent-free and aqueous Knoevenagel condensation of aromatic ketones and malonitrile. Arkivoc. 2004;5:4–8. [Google Scholar]
- 14.Madkhur HMF, Mahmoud MR, Nassar MH, Habashy MM. Behaviour of Some Activated Nitriles Toward Barbituric Acid, Thiobarbituric Acid and 3-Methyl-1-Phenylpyrazol-5-one. Molecules. 2000;5:746–755. doi: 10.3390/12102277. [DOI] [PMC free article] [PubMed] [Google Scholar]
- 15.Madhavan GR, Chakrabarti R, Vikramadithyan RK, Mamidi RNVS, Balraju V, Rajesh BM, Misra P, Kumar SKB, Lohray BB, Lohray VB, Rajagopalan R. Synthesis and Biological Activity of Novel Pyrimidinone Containing Thiazolidinedione Derivatives. Bioorg. Med. Chem. 2000;10:2671–2680. doi: 10.1016/s0968-0896(02)00107-4. [DOI] [PubMed] [Google Scholar]
- 16.Lacova M, Gasporova R, Loos D, Liptay T, Pronayova N. Effect of microwave irradiation on the condensation of 6-substituted 3-formylchromones with some five-membered heterocyclic compounds. Molecules. 2000;5:167–178. [Google Scholar]
- 17.Cramer RD, III, Patterson DE, Bunce JD. Comparative molecular field analysis (CoMFA). 1. Effect of shape on binding of steroids to carrier proteins. J. Am. Chem. Soc. 1988;110:5959–5967. doi: 10.1021/ja00226a005. [DOI] [PubMed] [Google Scholar]
- 18.Buolamwini JK, Assefa H. CoMFA and CoMSIA 3D QSAR and Docking Studies on Conformationally-Restrained Cinnamoyl HIV-1 Integrase Inhibitors: Exploration of a Binding Mode at the Active Site. J. Med. Chem. 2002;45:841–852. doi: 10.1021/jm010399h. [DOI] [PubMed] [Google Scholar]
- 19.Zhou Z, Madura JD. CoMFA 3D-QSAR Analysis of HIV-1 RT non-nucleoside inhibitors, TIBO derivatives based on docking conformation and alignment. J. Chem. Inf. Comput. Sci. 2004;44:2167–2178. doi: 10.1021/ci049893v. [DOI] [PubMed] [Google Scholar]
- 20.Schymkowitz JW, Rousseau F, Martins IC, Ferkinghoff-Borg J, Stricher F, Serrano L. Prediction of water and metal binding sites and their affinities by using the Fold-X force field. Proc. Natl. Acad. Sci. U S A. 2005;102:10147–10152. doi: 10.1073/pnas.0501980102. [DOI] [PMC free article] [PubMed] [Google Scholar]
- 21.Jones G, Willett P, Glen RC, Leach AR, Taylor R. Development and validation of a genetic algorithm for flexible docking. J. Mol. Biol. 1997;267:727–748. doi: 10.1006/jmbi.1996.0897. [DOI] [PubMed] [Google Scholar]
- 22.SYBYL, version 6.9. 1699 South Hanley Road, St. Louis, MO, 63144: Tripos Inc.; [Google Scholar]
- 23.Cornell WD, Cieplak P, Bayly CI, Gould IR, Merz KM, Ferguson DM, Spellmeyer DC, Fox T, Caldwell JW, Kollman PA. A Second Generation Force Field for the Simulation of Proteins, Nucleic Acids, and Organic Molecules. J. Am. Chem. Soc. 1996;118:2309. [Google Scholar]
- 24.Stewart JJP. Optimization of parameters for semiempirical methods I. Method. J. Comp. Chem. 1989;10:209–220. [Google Scholar]
- 25.Bush BL, Nachbar RB. Sample-distance partial least-squares PLS optimized for many variables, with application to CoMFA. J. Comput.-Aided Mol. Des. 1993;7:587–619. doi: 10.1007/BF00124364. [DOI] [PubMed] [Google Scholar]
- 26.Connolly ML. Analytical molecular surface calculation. J. Appl. Cryst. 1983;16:548–558. [Google Scholar]
- 27.Klebe G, Abraham U, Mietzner T. Molecular Similarity Indices in a Comparative Analysis (CoMSIA) of Drug Molecules to Correlate and Predict their Biological Activity. J. Med. Chem. 1994;37:4130–4146. doi: 10.1021/jm00050a010. [DOI] [PubMed] [Google Scholar]
- 28.Shoop WL, Xiong Y, Wiltsie J, Woods A, Guo J, Pivnichny JV, Felcetto T, Michael BF, Bansal A, Cummings RT, Cunningham BR, Friedlander AM, Douglas CM, Patel SB, Wisniewski D, Scapin G, Salowe SP, Zaller DM, Chapman KT, Scolnick EM, Schmatz DM, Bartizal K, MacCoss M, Hermes JD. Anthrax lethal factor inhibition. Proc. Natl. Acad. Sci. U S A. 2005;102:7958–7963. doi: 10.1073/pnas.0502159102. [DOI] [PMC free article] [PubMed] [Google Scholar]
Associated Data
This section collects any data citations, data availability statements, or supplementary materials included in this article.


