

Abstract
We investigate the post-translational generation of Gla (γ-carboxy glutamic acid) from Glu (glutamic acid) by vitamin K carboxylase (VKC) in solvent. VKC is thought to convert vitamin K, in the vitamin K cycle, to an alkoxide-epoxide form, which then reacts with CO2 to generate an essential ingredient in blood coagulation, γ-carboxyglutamic acid (Gla). The generation of Gla from Glu is found to be exergenic (−15 kcal/mol) in aqueous solution with the SM6 method. We also produced the free energy profile for this model biochemical process with other solvent methods (polarizable continuum model, dielectric polarizable continuum model) and different dielectric constants. The biological implications are discussed.
Keywords: vitamin K cycle, Dowd mechanism, free energy profile, solvent, heterodimer
Introduction
Vitamin K plays a key role in the blood coagulation cascade [1, 2]. The vitamin K carboxylase (VKC) converts the hydroquinone form of the vitamin K to alkoxide-epoxide form as shown in Figure 1. In that biochemical process, the alkoxide reacts with CO2 to generate an essential ingredient in the blood coagulation cascade, Gla (γ-carboxyglutamic acid) from Glu (glutamic acid). Gla assists several vitamin K-dependent blood coagulation proteins, (factor II, factor VII, factor IX, factor X, protein C and protein S, etc.), to anchor to anionic lipid membranes in the presence of Ca2+ and thereby trigger and sustain the blood coagulation cascade [2, 3]. The biochemical process for the generation of Gla by VKC has been proposed by Dowd [4]. The Dowd mechanism can be characterized as “base amplification” [4–6] involving the effective deprotonation of a γ-hydrogen and the generation of a carbanion intermediate in the conversion process of Glu to Gla (Fig. 2).
FIGURE 1.

The vitamin K cycle process: two transmembrane (TM) enzymes, vitamin K carboxylase (VKC), vitamin K epoxide reductase (VKOR), and substrate vitamin K. In the quantum calculation, R1 and R2 are replaced by hydrogens.
FIGURE 2.

A proposed mechanism of the generation of Gla from Glu by the vitamin K carboxylase (VKC). The starting system involves the alkoxide-epoxide form of vitamin K [4] and a glutamic acid (modeled as propionic acid).
Several quantum chemical approaches have been performed on models of the biochemical processes for the vitamin K cycle [7–10]. Despite promising results, the quantum calculations have not fully addressed the solvent effect. In this work, we use a more advanced continuum solvent method, SM6 [11] to investigate the free energy changes during the vitamin K cycle. For the purpose, we calculate the aqueous solvation free energy, , of the proposed intermediates in pseudo-enzymatic pathway [4, 7] in the conversion process of Glu to Gla using SM6. We then obtain the relative free energy change, which gives a free energy profile in the liquid-phase along the reaction pathway for the conversion process of Glu to Gla.
In the SM6 method, the aqueous solvation free energy is partitioned into [11]
| (1) |
The asterisk in the denotes that the aqueous solvation free energy calculation is performed for an ideal gas at a gas-phase concentration of 1 mol/L dissolving as an ideal solution at a liquid-phase concentration of 1 mol/L [11]. ΔEelec is the energy change in the solute’s internal electronic energy moving from gas-phase to the liquid-phase at the same geometry and ΔErelax is energy change in the solute’s internal energy because of change in the geometry accompanying the solvation process [11]. ΔErelax has a finite value only when the optimization process is performed in liquid-phase. In this study, ΔErelax is set to zero since the intermediates are used with the geometry optimized in the gas-phase. is the concentration change contribution between the gas-phase and the liquid-phase. It is set to zero as we use the same concentration of 1 mol/L at both phase [11]. ΔGp is the polarization contribution to the free energy arising from the bulk electrostatic interaction between solute-solvent. ΔGCDS is an empirical term, which is not included in Gp term. The label “CDS” stands for cavitation-dispersion-solvent structure. In the SM6 method, the partial charge calculation approach is updated using the Charge Model 4 (CM4) [11]. The aqueous solvation free energy for the reaction as shown in Figure 2 is calculated. Thus, the relative free energy for the reaction pathway for the process of the generation of Gla is obtained.
Methods
All the structures (initial structures are from [7]) were fully geometry optimized using Gaussian03 [12] with the basis of b3lyp/6-31+g(d,p) (gas-phase). In the model of vitamin K and its derivatives, the methyl group (R1) and the long hydrophobic side chain (R2) after the first side chain double bond were replaced by hydrogens [7]. For the aqueous solvation free energy calculation of the proposed intermediates, the optimized structures were first obtained in the gas-phase using Gaussian03. Those optimized structures were used as the initial structures for the liquid-phase calculation according to the SM6 method using SMxGAUSS [13].
For consistency, the same basis, b3lyp/6-31+g(d,p), was used in both gas-phase optimization using Gaussian03 and liquid phase single-point calculation using SMxGAUSS. The aqueous solvation free energy was also calculated using Gaussian03 for two different solvation models, the polarizable continuum model (PCM)[14] and the dielectric polarizable continuum model (DPCM).[15, 16] In general, calculated solvation free energies show a sensitive dependency on the choice of the atomic radii [17]. The default radii in the Gaussian03 is set to Radii = UA0 (the United Atom Topological Model applied for atomic radii of the UFF force field)[17, 18]. However, for the improved performance of the solvation free energy calculation, the Radii = UAHF (the United Atom Topological Model for Hatree–Fock) has been recommended [19]. In this work, the default for atomic radii was changed to Radii = UAHF. The SCFVAC keyword was used in the input file so that the free energy calculation in the gas-phase is performed before that in the liquid-phase [17].
Results
INITIAL PRODUCT H AND INTERMEDIATE J
The fully energy-optimized structures at the b3lyp/6-31+g(d,p) level (gas-phase) using Gaussian03 are shown (Fig. S1 in Supporting Information). We obtained the relative free energy profiles for each of the optimized structures by the SM6, the DPCM, and the PCM methods. Table I gives the aqueous solvation free energies for the SM6, the DPCM, and the PCM methods. Figure 3 shows the relative free energy change for the overall model reaction for the vitamin K cycle in the liquid-phase (ε = 78.3). Our proposed mechanism starts from the initial material H. It is the simple separated collection of the vitamin K alkoxide-epoxide (GH), propionic acid (an idealized glutamic acid), and CO2. The loosely bound complex of alkoxide-epoxide of vitamin K and the protonated glutamic acid model forms the first intermediate J. The distance between the carbon (numbered as 13 in Fig. S1 in Supporting Information) and the oxygen of OH group (numbered as 16) in the alkoxide-epoxide form is 1.55 Å. The distance between the oxygen (numbered as 16) and the γ-proton of the glutamic acid model (numbered as 32) is 2.21 Å. Because of loss of entropy in forming the complex [7], the free energy change accompanying by the formation of J intermediate shows an increase of the free energy with respect to the starting material H as shown in Figure 3. In the DPCM and the PCM method, we obtained ΔGPCM = 8.04 kcal/mol and ΔGDPCM = 9.03 kcal/mol respectively. On the other hand, was only 2.10 kcal/mol in the SM6 method.
TABLE I.
The aqueous solvation free energy calculation in the liquid-phase is performed using SMxGAUSS and Gaussian03 for the three different dielectric solvent models, SM6, DPCM, and the PCM with the same basis of b3lyp/6-31+g(d,p).
| DPCM | PCM | SM6 | |
|---|---|---|---|
| ΔGDPCM (kcal/mol) | ΔGPCM (kcal/mol) | (kcal/mol) | |
| H2O | −7.20 | −6.92 | −9.24 |
| CO2 | 0.05 | 0.06 | 1.07 |
| GH | −25.34 | −53.04 | −66.92 |
| Gla(−1) | −44.61 | −67.23 | −71.84 |
| Glu(0) | −7.51 | −6.94 | −5.57 |
| J | −18.93 | −47.05 | −65.06 |
| K | −20.16 | −39.85 | −65.12 |
| TS1 | −18.40 | −36.09 | −65.39 |
| PreTS2 | −34.10 | −48.36 | −63.78 |
| TS2 | −35.53 | −50.60 | −61.65 |
| PostTS2 | −39.59 | −59.61 | −70.52 |
| vitamin K epoxide | −2.77 | −2.05 | −8.49 |
= 78.3 is used as the dielectric constant.
The initial state (H) (Fig. 2) is composed of GH (the vitamin K alkoxide-epoxide model), Glu(0) (modeled by propionic acid), and CO2.
The final state (L) is composed of the vitamin K epoxide, H2O, and Gla(−1).
FIGURE 3.
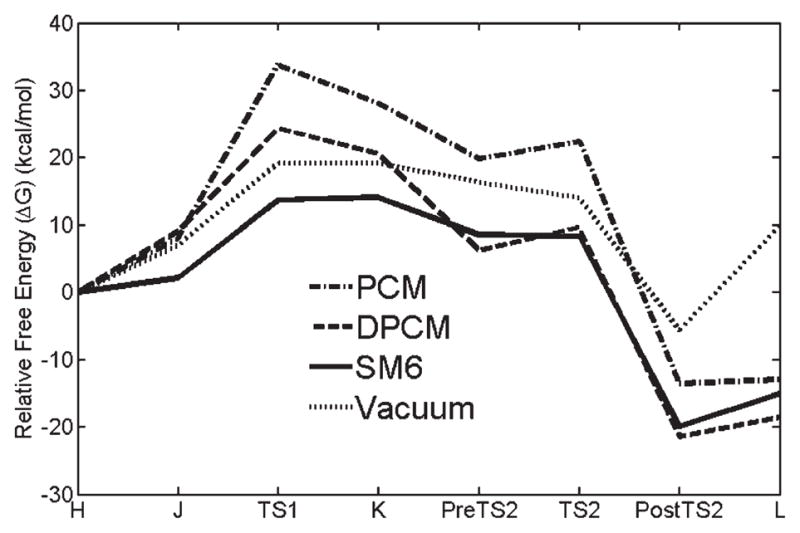
Relative free energy in the liquid-phase vs. reaction coordinate. The SM6 (ε = 78.3) curve is produced by performing single-point energy calculations on optimized structures using SMxGAUSS. Vacuum, DPCM (Dielectric Polarizable Continuum Model), PCM (Polarizable Continuum Model) curves are generated by performing free energy calculation on the optimized structures using Gaussian03.
INTERMEDIATE TS1
The OH attachment to the alkoxide-epoxide form of the vitamin K becomes weak and ultimately unites with a γ-proton of the glutamic acid model to form a water molecule. In this process, the detached γ-proton leaves behind an anion on the γ-carbon (numbered as 33 in Fig. S1 in Supporting Information) of the glutamic acid model. This carbanion is the key element in the “base amplification” process. The TS1 intermediate elevates the free energy with respect to the intermediate J in all the continuum solvents: ΔGPCM = 25.70 kcal/mol, ΔGDPCM = 15.27 kcal/mol and .
INTERMEDIATE K
The newly formed water molecule is loosely bound to the carbanion carbon of the glutamic acid model. At this stage, the vitamin K alkoxide-epoxide is almost detached from the glutamic acid model. The distance between the hydrogen of the water molecule (numbered as 32 in Fig. S1 in Supporting Information) and the carbanion (numbered as 33 in Fig. S1 in Supporting Information) is 1.88 Å. The bond between water OH and the γ-carbon becomes slightly stronger than in the TS1 intermediate (1.90 Å). The free energy of the intermediate K with respect to the TS1 in both of the PCM and the DPCM methods is decreased: ΔGPCM = −5.71 kcal/mol and ΔGDPCM = −3.72 kcal/mol. On the other hand, shows a small free energy gain of 0.37 kcal/mol. The free energy barriers for the PCM and the DPCM methods were estimated to be larger than that for the SM6 for TS1 and K—the carbanion generating stages. For the two intermediates TS1 and K, the ratios of free energy calculated with DPCM to SM6 were 1.8 (~24.3/13.7 kcal/mol) and 1.5 (~20.6/14.0 kcal/mol) respectively. Indeed, it has been reported that the DPCM/03 method (implemented in the Gaussian03) estimated solvation energies with 3.5 larger mean errors for 143 test ions than for the SM6 method [11, In estimating the mean errors in aqueous solvation free energies with both SM6 and DPCM/03 models, different basis was used: MPW25/66-31+G(d,p) for SM6 and HF/6-31G(d) for DPCM/03.]. In the SM6 method, the formation of the intermediate TS1 and K may be considered to be the rate-limiting process.
INTERMEDIATE PRETS2
CO2 becomes weakly bound to the hydrated carbanion of the propionic acid. The vitamin K epoxide is now completely detached from the model Gla. This step leads to reduced free energy. All of the model free energy values of the intermediate PreTS2 with respect to the K are decreased: ΔGPCM = −8.27 kcal/mol, ΔGDPCM = −14.40 kcal/mol, and .
INTERMEDIATE TS2
The carbon in CO2 forms a bond with the carbanion carbon of the glutamic acid model. This step initiates the addition of CO2 to the glutamic acid model to generate Gla. The change in free energy of the intermediate TS2 with respect to the PreTS2 for the PCM and the DPCM methods are ΔGPCM = 2.60 kcal/mol and ΔGDPCM = 3.41 kcal/mol. On the other hand, the free energy change of the intermediate TS2 for the SM6 method shows a free energy release of .
INTERMEDIATE POSTTS2 AND FINAL PRODUCT
Through the final two steps (Fig. 2), the final product L [collection of vitamin K epoxide, H2O, and the negatively charged Gla (−1)] is produced. The relative free energy change during the vitamin K cycle in the liquid-phase shows that the final product L is more stable than the initial product H (vitamin K alkoxide-epoxide (GH)+Glu(0)+CO2) by −15.1 kcal/mol by the SM6 method as shown in Figure 3. The solvent effect can be considered to be the difference between the ΔGTOTAL for the overall pathway (solvent-vacuum), which is −24.9 kcal/mol and the difference between the barriers of the rate-limiting step, which is −5.5 kcal/mol. That is, the solvent increases the relative stability of the final state and lowers the barrier for the reaction.
We also investigated the free energy sensitivity on dielectric constant. Figure 4 shows free energy profiles in the SM6 methods with dielectric constants of ε = 4.0 and ε = 78.3. Only the two terms of Eq. 1, ΔEelec and ΔGp, are utilized for the non aqueous system. In case of ε = 4.0, we found the free energy barrier is 1–2 kcal/mol lower than that of ε = 78.0. Also, we found the difference between the initial product and final product is reduced in case of ε = 4.0. This was true also for the DPCM and PCM methods (See Fig. S2 and Fig. S3, respectively, in Supporting Information), although the minimum reaction barrier for these methods was predicted in vacuum.
FIGURE 4.

Relative free energy profiles in the liquid-phase vs. reaction coordinate for different dielectric environments (SM6) including vacuum.
To quantify the stability of the final product (L) with respect to the initial product (H) according to the dielectric constants and the different dielectric solvent methods (SM6, DPCM, PCM), we defined ΔΔG78.3,4 as
| (2) |
The values of ΔΔG78.3,4 in the SM6, DPCM, and PCM are listed in Table II.
TABLE II.
ΔΔG78.3,4 (from water to lipid) in the three different dielectric solvent methods.
| DPCM | PCM | SM6 | |
|---|---|---|---|
| ΔΔG78.3,4 (kcal/mol) | −5.90 | −3.98 | −3.19 |
Stability of the final product is greater with respect to the initial product according to all of the dielectric solvent methods (DPCM, PCM, SM6).
BIOCHEMICAL IMPLICATION
As shown in Figures 1 and 2, two transmembrane (TM) proteins, VKC, and VKOR, are involved in the vitamin K cycle oxidation and reduction process, which take places in the endoplasmic reticulum (ER) of the cell. The alkoxide-epoxide form of the vitamin K is recycled into the quinone form after the generation Gla. The recycle process of vitamin K can be expected to be dependent on the structures of the two proteins as well as their relative arrangement in the ER membrane. Unfortunately, the structures of these two TM proteins, VKC, and VKOR, have yet to be characterized even though the sequences have been determined [20–22]. However, a heterodimer model for these two TM proteins can be envisioned based on significant biochemical experiments [23–29]. In particular, Lys-218 of VKC is thought to play a critical role in the deprotonation of the hydroquinone form of vitamin K and initiation of the carboxylation reaction at the lumen (outer) membrane of VKC [25].
We used the Philius transmembrane prediction method, which is based on dynamic Bayesian network [30] and TOPCONS, which is based on a hidden Markov algorithm approach [31] to predict the location of the TM helices in the sequences of the two proteins. Based on the prediction results and accumulated biochemical evidences [23–29], we propose a heterodimer model composed of five TM helices of VKC and three TM helices of VKOR. We arranged the oxygen (oxy-3 denoted in Fig. 1) of vitamin K to be located near Lys-218 of VKC for the initiation of base amplification. Then, we set the epoxide oxygen, oxy-2 denoted in Figure 1, to be located near the putative active site, Cys-132 and Cys-135 [26], of VKOR for return of the alkoxide-epoxide form to the quinone form during the vitamin K cycle.
We obtained negative values for ΔΔG78.3,4 (i.e., approximate from water to lipid) for all three different dielectric solvent methods (Table II). The implication is that the chemical process for the generation of Gla in the vitamin K cycle favors aqueous environment rather than lipid environment. Based on this model, it appears that the biochemical reactions for generation of Gla would be take place largely in aqueous environment with the lipophilic tail of vitamin K anchored into the lipid-membrane in vivo (denoted as R2 in Fig. 1). Thus, we would infer that the overall biochemical reaction (from Glu to Gla) would occur on the lumen side of the membrane. This speculation, based on our quantum calculations, is compatible with the experimental finding that Lys-218, involved in the deprotonation of the hydroquinone form of vitamin K and initiation of the carboxylation reaction of VKC, is located on the lumen side of the ER membrane [25]. Full details of the heterodimer model will be presented elsewhere.
Summary
Our model calculation shows that the biochemical process of the generation of Gla from Glu is exergenic for the SM6 method, indicating an overall spontaneous reaction. Also, the free energy profile computed by the SM6 method gives an energy barrier (~14 kcal/mol) that is smaller than that estimated by the PCM and the DPCM continuum solvent methods. The overall solvent effect of water with the SM6 method is that ΔGTOTAL is more spontaneous and the rate limiting barrier is decreased. We also estimated the relative free energy profiles in the liquid-phase with different dielectric constants (ε = 4.0 and ε = 78.3) and with different dielectric solvent methods (SM6, DPCM, PCM). From these quantum calculations, we found that the chemical reaction for the generation of Gla in the vitamin K cycle is predicted to favor an aqueous environment.
Supplementary Material
Acknowledgments
Contract grant sponsor: National Institute of Health.
Contract grant number: HL-06350.
Contract grant sponsor: National Science Foundation.
Contract grant number: FRG DMR 0804549.
Footnotes
Additional Supporting Information may be found in the online version of this article.
References
- 1.Wright DJ, Morris DP, Stafford DW. In: Molecular Basis of Thrombosis and Hemostasis. High KA, Roberts HR, editors. Marcel Dekker; New York: 1995. p. 309. [Google Scholar]
- 2.Furie B, Furie BC. Blood. 1990;75:1753. [PubMed] [Google Scholar]
- 3.Roberts HR, Tabares AH. In: Molecular Basis of Thrombosis and Hemostasis. High KA, Roberts HR, editors. Marcel Dekker; New York: 1995. p. 35. [Google Scholar]
- 4.Dowd P, Hershline R, Ham SW, Naganathan S. Science. 1995;269:1684. doi: 10.1126/science.7569894. [DOI] [PubMed] [Google Scholar]
- 5.Ham SW, Dowd P. J Am Chem Soc. 1990;113:7734. [Google Scholar]
- 6.Dowd P, Ham SW, Geib SJ. J Am Chem Soc. 1991;112:1660. [Google Scholar]
- 7.Davis CH, Deerfield D, II, Stafford DW, Pedersen LG. J Phys Chem A. 2007;111:7257. doi: 10.1021/jp068564y. [DOI] [PubMed] [Google Scholar]
- 8.Deerfield D, Davis CH, Wymore T, Stafford DW, Pedersen LG. Int J Quant Chem. 2006;106:2944. [Google Scholar]
- 9.Deerfield D, Davis CH, Wymore T, Stafford DW, Pedersen LG. J Mol Graph Model. 2006;106:2944. doi: 10.1016/j.jmgm.2006.10.005. [DOI] [PubMed] [Google Scholar]
- 10.Silva PJ, Ramos MJ. J Phys Chem B. 2007;111:12883. doi: 10.1021/jp0738208. [DOI] [PubMed] [Google Scholar]
- 11.Kelly CP, Cramer CJ, Truhlar DG. J Chem Theory Comput. 2005;1:1133. doi: 10.1021/ct050164b. [DOI] [PubMed] [Google Scholar]
- 12.Frisch MJ, Trucks GW, Schlegel HB, Scuseria GE, Robb MA, Cheeseman JR, Montgomery JA, Jr, Vreven T, Kudin KN, Burant JC, Millam JM, Iyengar SS, Tomasi J, Barone V, Mennucci B, Cossi M, Scalmani G, Rega N, Petersson GA, Nakatsuji H, Hada M, Ehara M, Toyota K, Fukuda R, Hasegawa J, Ishida M, Nakajima T, Honda Y, Kitao O, Nakai H, Klene M, Li X, Knox JE, Hratchian HP, Cross JB, Bakken V, Adamo C, Jaramillo J, Gomperts R, Stratmann RE, Yazyev O, Austin AJ, Cammi R, Pomelli C, Ochterski JW, Ayala PY, Morokuma K, Voth GA, Salvador P, Dannenberg JJ, Zakrzewski VG, Dapprich S, Daniels AD, Strain MC, Farkas O, Malick DK, Rabuck AD, Raghavachari K, Foresman JB, Ortiz JV, Cui Q, Baboul AG, Clifford S, Cioslowski J, Stefanov BB, Liu G, Liashenko A, Piskorz P, Komaromi I, Martin RL, Fox DJ, Keith T, Al-Laham MA, Peng CY, Nanayakkara A, Challacombe M, Gill PMW, Johnson B, Chen W, Wong MW, Gonzalez C, Pople JA. Gaussian03, revision C. 02. Gaussian, Inc; Pittsburgh, PA: 2004. [Google Scholar]
- 13.Chamberlin AC, Kelly CP, Thompson JD, Lynch BJ, Xidos JD, Li J, Hawkins GD, Zhu T, Volobuev Y, Dupuis M, Rinaldi D, Liotard DA, Cramer CJ, Truhlar DG. SMXGAUSS-version 3.3. University of Minnesota; Minneapolis, MN 55455: 2004. [Google Scholar]
- 14.Foresman JB, Frisch Æ. Exploring Chemistry with Electronic Structure Methods. Gaussian, Inc; Pittsburgh, PA: 1996. [Google Scholar]
- 15.Miertuš S, Scrocco E, Tomasi J. J Chem Phys. 1981;55:117. [Google Scholar]
- 16.Cossi M, Barone V, Cammi R, Tomasi J Chem Phys Lett. 1996;255:327. [Google Scholar]
- 17.Sadley-Sosnowska N. Theo Chem Acc. 2007;118:281. [Google Scholar]
- 18.Rappé AK, Casewit CJ, Colwell KS, Goddard WA, III, Skiff WM. J Am Chem Soc. 1992;114:10024. [Google Scholar]
- 19.Barone V, Cossi M, Tomasi J. J Chem Phys. 1997;107:3210. [Google Scholar]
- 20.Wu SM, Morris DP, Stafford DW. Proc Natl Acad Sci USA. 1991;88:2236. doi: 10.1073/pnas.88.6.2236. [DOI] [PMC free article] [PubMed] [Google Scholar]
- 21.Li T, Chang CY, Jin DY, Lin PJ, Khvorova A, Stafford DW. Nature. 2004;427:541. doi: 10.1038/nature02254. [DOI] [PubMed] [Google Scholar]
- 22.Rost S, Fregin A, Ivaskevicius V, Conzelmann E, Hortnagel K, Pelz HJ, Lappegard K, Seifried E, Scharrer I, Tuddenham EG, Muller CR, Strom TM, Oldenburg J Nature. 2004;427:537. doi: 10.1038/nature02214. [DOI] [PubMed] [Google Scholar]
- 23.Kuliopulos A, Nelson NP, Yamada M, Walsh CT, Furie B, Furie BC, Roth DA. J Biol Chem. 1994;269:21364. [PubMed] [Google Scholar]
- 24.Tie JK, Zheng MY, Hsiao KLN, Perera L, Stafford DW, Straight DL. Biochemistry. 2008;47:6301. doi: 10.1021/bi800235r. [DOI] [PMC free article] [PubMed] [Google Scholar]
- 25.Rishavy MA, Hallgren KW, Yakubemko AV, Shtofman RL, Runge KW, Berkener KL. Biochemistry. 2006;45:13239. doi: 10.1021/bi0609523. [DOI] [PubMed] [Google Scholar]
- 26.Wajih N, Sane DC, Hutson SM, Wallin R. J Biol Chem. 2005;280:10540. doi: 10.1074/jbc.M413982200. [DOI] [PubMed] [Google Scholar]
- 27.Tie JK, Nicchitta CV, Heijne GV, Stafford DW. J Biol Chem. 2005;280:16410. doi: 10.1074/jbc.M500765200. [DOI] [PubMed] [Google Scholar]
- 28.Tie JK, Wu SM, Jin D, Nicchitta CV, Stafford DW. Blood. 2000;96:973. [PubMed] [Google Scholar]
- 29.Darghouth D, Hallgren KW, Shtofman RL, Mrad A, Gharbi Y, Maherzi A, Kastally R, LeRicousse S, Berkner KL, Rosa JP. Blood. 2006;1925:108. doi: 10.1182/blood-2005-12-010660. [DOI] [PMC free article] [PubMed] [Google Scholar]
- 30.Reynold SM, Käll L, Riffle ME, Bilmes JA, Noble WS. Plos Comput Biol. 2008;4:10540. doi: 10.1371/journal.pcbi.1000213. [DOI] [PMC free article] [PubMed] [Google Scholar]
- 31.Bernsel A, Viklund H, Hennerdal A, Elofsson A. Nucleic Acids Res. 2009;37:W465. doi: 10.1093/nar/gkp363. [DOI] [PMC free article] [PubMed] [Google Scholar]
Associated Data
This section collects any data citations, data availability statements, or supplementary materials included in this article.