

Abstract
White matter hyperintensities (WMH) are areas of increased signal on T2-weighted magnetic resonance imaging (MRI), including fluid attenuated inverse recovery sequences. Total and regional WMH burden (i.e., volume or severity) has been associated with myriad cognitive, neurological, and psychiatric conditions among older adults. In the current report, we illustrate two approaches to quantify periventricular, deep, and total WMH and examine their reliability and criterion validity among 28 elderly patients enrolled in a depression treatment trial. The first approach, an operator-driven quantitative approach, involves visual inspection of individual MRI scans and manual labeling using a three-step series of procedures. The second approach, a fully automated quantitative approach, uses a processing stream that involves image segmentation, voxel intensity thresholding, and seed growing to label WMH and calculate their volume automatically. There was good agreement in WMH quantification between the two approaches (Cronbach’s alpha values from 0.835 to 0.968). Further, severity of WMH was significantly associated with worse depression and increased age, and these associations did not differ significantly between the two quantification approaches. We provide evidence for good reliability and criterion validity for two approaches for WMH volume determination. The operator-driven approach may be better suited for smaller studies with highly trained raters, whereas the fully automated quantitative approach may be more appropriate for larger, high-throughput studies.
Keywords: white matter hyperintensities, magnetic resonance imaging, aging, cerebrovascular disease, quantification
1. Introduction
White matter hyperintensities are areas of increased signal intensity visualized on T2-weighted magnetic resonance imaging (MRI) sequences, including fluid attenuated inverse recovery (FLAIR) scans. Although many types of disruptions to white matter integrity can cause hyperintense signal on T2-weighted scans (Bronge and Wahlund, 2007), in the context of aging, WMH are thought to reflect small vessel cerebrovascular disease of non-specific etiology (Brickman et al., 2010; Brickman et al., 2008b; Gunning-Dixon et al., 2008; Pantoni and Garcia, 1997; Thomas et al., 2002). Classical vascular risk factors, such as hypertension, diabetes, and heart disease, have been associated with increased WMH burden (i.e., volume or severity) among community-dwelling and clinic-based older adults (DeCarli et al., 1999; Liao et al., 1997; Liao et al., 1996). Further, WMH have been linked with myriad cognitive, neurological, and psychiatric conditions among older adults, including depression (Gunning-Dixon et al.,; Herrmann et al., 2008), age-associated cognitive decline (Gunning-Dixon and Raz, 2000), Alzheimer’s disease and its antecedent conditions (Brickman et al., 2008a; Brickman et al., 2009a; Luchsinger et al., 2009), migraine (Paemeleire, 2009), and gait or mobility disturbance (Bhadelia et al., 2009; Franch et al., 2009; Iseki et al.,; Louis et al., 2008). These observations not only highlight the distinct role that small vessel cerebrovascular disease may play in these conditions but also emphasize how neuroimaging can be used to identify important sources of behavioral variance in clinical and non-clinical populations.
In the context of clinical research, evaluation of WMH severity generally has been accomplished in three ways. Visual rating scales can be used to inspect electronic or film-based data by a trained rater. Most visual rating scales for WMH, such as the widely used Scheltens (Scheltens et al., 1993) and Fazekas (Fazekas et al., 1987) scales, rely on descriptive anchors to assign semi-quantitative regional severity ratings. Visual rating scales are often considered a “gold standard” for the assessment of WMH severity because the human eye is well equipped to discriminate meaningful patterns (e.g., WMH regions) from noise and because highly expert raters can use their clinical judgment to evaluate presence and distribution of WMH. Further, visual rating scales are ideal for analysis of data that are only available on radiological film, are not acquired systematically, or are of resolution or slice thickness that is inadequate for quantitative analysis. They are also generally quite intuitive for radiologists who may not have access to more quantitative techniques and require relatively little additional training given their backgrounds. On the other hand, visual rating scales do not provide true quantitative data; are susceptible to relatively low reliabilities particularly among poorly trained raters; require some degree of clinical knowledge and judgment, which may vary even among the most expert of raters; and are not realistic for large scale studies.
Operator-driven quantitative approaches (e.g., (Gurol et al., 2006)) can be used to quantify WMH volume when data are available electronically. These approaches typically require a user to apply an intensity threshold to label voxels that fall within a range of values corresponding to hyperintense regions. Brain or skull regions that fall within this range are either manually removed or masked out in multiple operator-driven steps. For T2-weighted sequences without fluid attenuation, cerebrospinal fluid may appear in the same voxel intensity distribution as WMH and thus the operator needs to apply knowledge of anatomy and pathology in order to distinguish between abnormal tissue intensity and fluid. Further steps can be taken to define gross regions-of-interest, such as periventricular versus deep cortical distributions (see discussion below). Benefits for this approach include the derivation of quantitative (continuous) data that can be used for parametric statistical analysis, relative ease and speed of data analysis with little training required, and potentially increased reliability over visual rating methods. Despite these advantages, operator-driven quantitative approaches still require subjective judgment for defining the appropriate range of voxel intensity values and the region-of-interest boundaries, and are not immune to low inter- or intra-rater reliabilities.
Fully automated quantitative analytic processing streams (e.g., (DeCarli et al., 2005; Wu et al., 2006)) have been developed to quantify total or regional WMH volume automatically with very little user intervention. These techniques typically employ highly standardized procedures to identify and label voxel intensity values that fall within the distribution of WMH, determined a priori or “tuned” to a particular data set. These approaches often include intensity thresholding combined with seed growing algorithms to label abnormal values iteratively. Combining T2-weighted data with other imaging modalities can facilitate skull stripping and distinguishing cerebrospinal fluid from WMH for non-fluid attenuated T2-weighted sequences. Obvious advantages for fully automated approaches include the ability to analyze large data sets quickly, perfect test-retest reliability, and generation of quantitative data. Still, fully automated approaches require high computational ability as well as in-house created software and are not invulnerable to radiological artifacts, which may interfere with segmentation of WMH or with steps required to perform regional analyses.
We recently devised a fully automated quantitative approach for high-throughput analysis of FLAIR imaging data sets, such as those collected in community-based studies (Brickman et al., 2008b). We sought to identify a relatively small clinical data set in which we could apply this fully automated approach and compare it to the more labor-intensive operator-driven quantitative approach. Thus, the purpose of this report is to describe and compare these two approaches for WMH quantification among older adults with depression from a recently-completed clinical trial. The first approach, is a user-operated quantitative technique in which WMH are identified visually and quantified with a series of analytic steps. The second approach is a fully automated quantitative one using in-house developed software. In both cases, we focused on total WMH volume as well as total volumes derived in periventricular versus deep cortical regions, given the reported pathological distinction between the two types of lesions (Fazekas et al., 1993; Thomas et al., 2002). We describe the procedures in detail and report reliability coefficients. We also examine whether the two approaches yield WMH volumes that are similarly related to two factors known to be associated with white matter pathology: age and severity of depression. Subject data were drawn from baseline neuroimaging data from a completed 12-week treatment trial among older patients with depression.
2. Methods
2.1. Subjects
Magnetic resonance imaging, demographic, and depression severity data from were obtained from 41 depressed older adults. The study was a double-blind, randomized, 12-week clinical trial comparing nortriptyline to sertraline in depressed patients 45 and older.
Patients were recruited by radio and newspaper advertisements and/or through referral from other physicians. At the initial visit, a comprehensive psychiatric evaluation that included a Structured Clinical Interview for DSM-IV (American Psychiatric Association, 1994), 24-item Hamilton Rating Scale for Depression (HRSD) (Hamilton, 1960; Williams, 1988), a Mini-Mental State Examination (MMSE) (Folstein et al., 1975), and a medical history was performed if the patient met inclusion criteria and signed informed consent. Physical examination included echocardiogram and blood work.
Inclusion criteria were 1) age > 45; 2) unipolar depression, single or recurrent, nonpsychotic, by DSM-IV criteria; 3) HRSD ≥ 16 at the initial visit and at the end of 1 week of placebo; and 4) willing and able to give informed consent. Exclusion criteria were 1) current or history of obsessive-compulsive disorder, psychotic disorder, or substance dependence within the past year (other than nicotine) by DSM-IV criteria; 2) judged to be a current suicide risk or serious suicide attempt within the past year; 4) patients with a history of myocardial infarction, coronary artery bypass, angioplasty, and/or with positive history of angina or positive stress test; 5) QRS interval greater than 0.12 sec or QTc interval ≥ 46 ms; 6) treatment with coumadin, heparin or type 1 antiarrhythmic medications; 7) diagnosis of narrow angle glaucoma; 8) MMSE score ≤24; 9) stroke, epilepsy or Parkinson’s disease; 10) acute, severe or unstable medical condition; 11) positive urine toxicology screen for drugs of abuse including amphetamine, barbiturates, cocaine, marijuana, methadone, methaqualone, opioids, and phencyclidine; 12) treatment in the current episode of depression with either nortriptyline with a plasma level between 50 and 150 ng/ml, desipramine or imipramine with a plasma level of 250 ng/ml or greater for at least 4 weeks, or paroxetine 40mg, fluoxetine 40mg or sertraline 200mg for at least 4 weeks.
Magnetic resonance imaging was acquired using a 1.5 Tesla G.E. Signa Advantage system. The following series of acquisitions was obtained: (1) T1-weighted sagittal “scout” images: 4 mm thick with 1 mm intersection gap, including a midline image, to be used for positioning and alignment of the remainder of the study (scan time ~ 3 min). (2) T2-weighted axial and coronal fast spin echo (FSE) sequences through the entire brain: ~ 42 contiguous 3 mm sections, repetition time (TR) 4500 ms, effective echo time (TE) 102 ms, echo train length (ETL) 16, 256×256 matrix, 22 cm field of view (FOV), 1 number of excitations (NEX), three interleaved 14 section acquisitions (scan time 4:30 min each for axial and coronal images). (3) Volumetric 3D T1-weighted gradient echo images (3D FMSPGR) of the entire head: 124 axial contiguous 1.5 mm thick sections, TR 27 ms, TE 4 ms, flip angle 30 degrees, 256×256 matrix, 24 cm FOV, 1 NEX, inferior saturation pulse (scan time 12:51 min). (4) Fluid-attenuated inversion recovery (FLAIR) images: 36 contiguous 3 mm thick sections, TR 11000 ms, TE 145 ms, TI 2600 ms, ETL 16, 256×192 matrix, 22 cm FOV, 1 NEX, three interleaved 3 section acquisitions in the axial plane through periventricular and centrum semiovale white matter (scan time 8:48 min). (5) Magnetization transfer (MT): 20 contiguous 5 mm thick sections, TR 3000 ms, TE 90 ms, 256×192 matrix, 22 cm FOV, 1 NEX, without and then with the MT saturation pulse (scan time 7:48 min each for axial and coronal images).
This research was approved by a local institutional review board and all participants gave written informed consent for participation.
2.2. Operator-driven quantitative approach
The operator-driven approach involved a three-step modification of a technique put forth by Gurol and colleagues (Gurol et al., 2006) and implemented by our research group previously (Brickman et al., 2009b). Each FLAIR image is imported into MRIcro, a publically-available image processing and viewing software package (Rorden and Brett, 2000). In the first step, each image is visually inspected and a filter is applied based on an intensity threshold that labeled voxels appearing as hyperintense. The upper and lower boundaries of the filter are adjusted accordingly, based on visual inspection of labeled voxels on one or more axial slices. During the second step, two series of gross regions-of-interest (ROIs), corresponding to WMH in periventricular areas and WMH in deep cortical areas, are manually traced on a slice-by-slice basis excluding non-WMH areas that are labeled in step 1 (e.g., dermal fat). During the third step, new images reflecting the intersection of voxels labeled in step 2 with the voxels labeled in step 1 are generated. That is, the labeled voxels that are common in step 1 and step 2 are isolated in step 3 to generate total WMH volumes for periventricular and deep cortical regions, respectively. In step 3, MRIcro provides volumes for the ROIs in cm3, based on the number of labeled voxels and voxel dimensions. The distinction between periventricular and deep WMH is made visually following several rules set a priori and implemented on each axial slice. White matter hyperintensities that are contiguous to the lateral ventricles and extended to the deep white matter are classified as periventricular. If there is at least one pixel that separates hyperintense pixels between periventricular and deep areas so that there are two distinct contiguous groups, they are classified separately. Separating deep white matter lesions from periventricular lesions is complicated by the fact that lesions that are contiguous with the wall of the ventricles can sometimes extend in to the deep white matter. In these cases, the lesion is labeled as periventricular. Deep and periventricular volumes were calculated for left and right cerebral hemispheres separately. Total periventricular and deep WMH volumes are calculated by adding left and right hemisphere values together. Total volumes are derived by summing periventricular and deep values.
2.3. Fully automated quantitative approach
Our fully automated approach for quantification of WMH utilizes both T1-weighted anatomical scans and FLAIR images. Software was written in MatLab (The Mathworks, Nadick, MA) and interfaces with both SPM5 (Wellcome Trust Centre for Neuroimaging) and FSL4.1 (Analysis Group, FMRIB, University of Oxford, Oxford, UK). Total and periventricular versus deep WMH volume is derived following a multistage processing stream, partially described in a previous report (Brickman et al., 2009a). First, each FLAIR image is realigned with a 6 degree of freedom (df) transformation to the ICBM 152 anatomical template provided by the Montreal Neurological Institute to SPM5 anatomical template provided by the Montreal Neurological Institute using SPM5. After realignment, the subject’s T1-weighted image is co-registered to the FLAIR image with a 6df transformation using FMRIB’s Linear Image Registration Tool (FLIRT(Jenkinson et al., 2002; Jenkinson and Smith, 2001)).
The T1-weighted image is then segmented into grey matter, white matter, and cerebrospinal fluid (CSF) images using software provided by SPM5 (Wellcome Trust Centre for Neuroimaging). A brain extraction is performed with the Brain Extraction Tool (BET) (Smith, 2002) provided by FSL applied to the co-registered FLAIR and T1-weighted images and in a second step we used the combination of segmented tissue classes to mask the cerebrum fully. The brain extracted FLAIR image is divided into left and right hemispheres separate hemispheres; this step was accomplished by importing the images into 3-dimensional space and demarcating hemispheres by the middle value of the X-axis (i.e., sagittal plane). A Gaussian curve is fit to each hemisphere’s voxel intensity values. The mean and standard deviation (SD) intensity value is derived for each hemisphere. White matter hyperintensity seeds are defined as greater than or equal to 2.5 SD above the mean. The left and right seeds are combined and each seed is then passed into a mean intensity based region-growing algorithm. The algorithm uses the seed voxel intensity as its starting mean and, applying a 10 point connectivity scheme (x–y plane, and 1 up in z and 1 down in z-plane) it searches for and labels voxels that fall within 5% of the seed mean. Neighboring voxels that fall within 5% are added to the image and a new mean is created. This process continues iteratively until all seeds have been included in the final WMH image. The summation of the number of voxels labeled as WMH multiplied by voxel dimensions yields the total volume.
To label and determine the volume of periventricular versus deep WMH we define the borders of the lateral and third ventricles and determine the distance of each WMH-labeled voxel in relation. We use a knowledge-driven algorithm and methodology put forth by Xia and colleagues (Xia et al., 2004) to define and abstract the lateral ventricles on the FLAIR images. Briefly, using predefined anatomical landmarks (Xia et al., 2004), ROIs for the 2 lateral ventricles and third ventricle are created. The mean plus 2.5SD of the voxel intensity of the ventricle is computed for all three ROIs. Each ROI’s intensity histogram is then fit to multiple Gaussian distributions. The lowest mean Gaussian corresponds to CSF. The CSF Gaussian curve is used to set a threshold for each ROI. We first region grow using a 26-point threshold based algorithm in the third ventricle starting from the hypothetical line connecting the anterior commissure and the posterior commissure in the superior to inferior direction. Once the region growing is completed in the third ventricle, it begins de novo in the lateral ventricles beginning from the posterior commissure in the coronal orientation. The growing algorithm continues from anterior to posterior directions in coronal slices. Once the region growing stops at the posterior boundary, it reverses directions and continues from the posterior to anterior direction. All three grown regions are added together to derive the entire ventricular system.
To determine whether WMH-labeled voxels falls within the periventricular or deep cortical area, we calculate the distance, in x, y, and z directions, of the closest voxel of each nearest generated WMH cluster to the ventricles using a Euclidian distance formula. We use a connected component labeling system to label all contiguous clusters. For the current analyses, we defined periventricular WMH voxels as those that fall within 8mm of the lateral ventricles in any x, y, z direction and deep WMH as labeled voxels that fall outside this 8mm 3-dimensional radius. Summing across WMH voxels within 8 mm and outside 8mm of the ventricles, we are able to derive total periventricular and deep WMH volumes.
2.4. Analysis
The operator-driven approach was applied to all subjects’ data. A single operator (L.J.) conducted the analyses with training and consultation from a board certified neuroradiologist (E.G.). A second experienced operator (A.M.B.) quantified WMH for 6 subjects to conduct interrater reliability analyses. The fully automated approach was also applied to each subject’s MRI data and volumes between the two methods were compared for differences (paired t-tests) and for concordance (intraclass correlational analysis). Intraclass correlation coefficients were calculated in SPSS version 18.0.2 using a two factor mixed effects model and type consistency (McGraw and Wong, 1996; Shrout and Fleiss, 1979). We also examined the association of regional WMH volumes derived with both approaches with HRSD and age. The purpose here was to examine whether the strength of the association with an external measure (i.e., HRSD scores or age) differed significantly between the two quantification approaches.
3. Results
Demographic and symptom severity data for the 41 participants with complete neuroimaging data that comprise the study sample are presented in Table 1. Structural MRI scans were visually inspected for artifacts or gross abnormalities. Of the 41 subjects, 13 were removed from analyses because of movement artifacts that would render spatial normalization invalid. Presentation of all descriptive and comparative statistics is limited to the remaining 28 participants. The 13 excluded subjects did not differ from the remaining subjects in age, age of depression onset, HRSD score, or education (t-values between 0.922 and 1.17, df=38, p-values between 0.251 and 0.963). They were also similar in terms of sex (χ2(1)=0.615, p=0.433) and ethnicity (χ2(3)=4.81, p=0.186). Absolute values for left, right, and total periventricular and deep white matter hyperintensity values derived with the operator-driven and fully automated approaches are displayed in Figure 1. Because left and right values did not differ significantly (t-values between 0.243 and 1.527, df=28, p-values between 0.135 and 0.809), we combined the two hemispheres to derive total periventricular, total deep, and total WMH volumes (Table 2). Interrater reliability was excellent for periventricular (Cronbach’s alpha=0.989) and deep (Cronbach’s alpha=0.981) WMH volume derviation.
Table 1.
Demographic data for study participants.
| Variable | Mean (SD) or N (%) | Range | |
|---|---|---|---|
| Age | 66.70 (8.44) | 50–90 | |
| Age of depression onset | 45.40 (23.50) | 11–89 | |
| Years of education | 16.10 (3.03) | 7–18 | |
| HRSD-24 | 24.48 (6.21) | 16–42 | |
| Female gender | 18 (64%) | ||
| Race/Ethnicity | Caucasian | 23 (82%) | |
| Hispanic | 3 (11%) | ||
| Asian | 1 (4%) | ||
Figure 1.
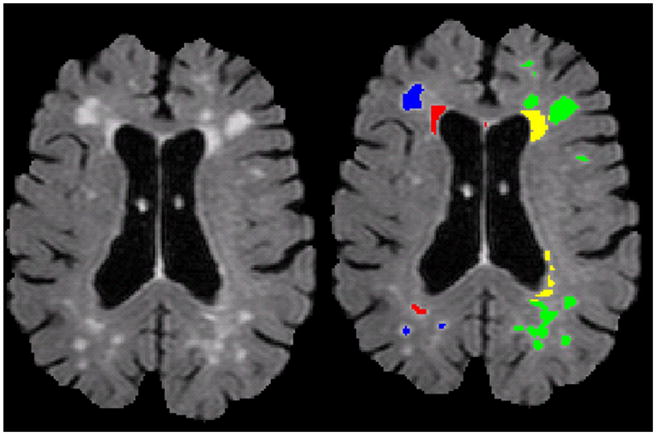
Example of a raw, skull-stripped T2-weighted FLAIR image (left panel) with deep and periventricular WMH labeled (right panel). Note on labeled image the right hemisphere (left side) is labeled with the fully-automated approach (red=periventricular, blue=deep) and the left hemisphere (right side) is labeled with the operator-driven approach (yellow=periventricular, green=deep). In some cases, as in the posterior right hemisphere labeled with the automated approach, voxels are labeled as periventricular although they appear to be at a distance from the lateral ventricle. While maximizing reliability and minimizing operator error, on any given slice, labeled voxels might appear to be non-contiguous with the lateral ventricle but close to the walls on the lateral ventricle on the superior or inferior slice or otherwise fall within the distance criterion.
Table 2.
Regional WMH volumes (mean cm3 (SD)) derived with the two analytic approaches
| Operator-driven | Automatic | Statistic | |
|---|---|---|---|
| Left periventricular | 2.682 (3.488) | 2.408 (2.473) | |
| Right periventricular | 2.539 (3.2453) | 2.229 (2.836) | |
| Total periventricular | 5.218 (6.693) | 4.637 (5.154) | t=1.453, p=0.158 |
| Left deep | 0.914 (1.551) | 1.865 (3.259) | |
| Right deep | 0.964 (1.645) | 1.743 (2.976) | |
| Total deep | 1.879 (3.180) | 3.486 (5.952) | t=2.366, p=0.025 |
| Total WMH | 7.096 (8.843) | 8.124 (9.466) | t=1.489, p=0.148 |
Relative to the operator-driven method, deep WMH volumes were greater for the fully automated approach. Derived periventricular and total volumes were similar between the two approaches (see Table 2). Figure 1 displays a fully labeled T2-weighted image with both operator-driven and fully automated approaches and Figure 2 displays a 3-dimensional rendering of the same image.
Figure 2.

Scatterplot displaying total WMH volumes (in log cm3) derived with each approach.
We computed intraclass correlation coefficients for deep, periventricular, and total WMH volumes across the two methodologies (combined across cerebral hemisphere). In general, there was good agreement across measures (periventricular WMH volumes, Cronbach’s alpha= 0.968; deep WMH volumes, Cronbach’s alpha=0.835; total WMH volumes, Cronbach’s alpha=0.959). Figure 2 displays a scatterplot comparing total WMH volumes derived with each approach.
We examined the relationship between WMH volumes derived with the two methods and HRSD scores, limiting the analyses to only those subjects for which the fully automated approach was successfully implemented. Greater volume of deep WMH were related significantly to higher HRSD scores using either the operator-driven approach (r (27)=0.595, p=0.001) or the fully-automated approach (r (27)=0.628, p<0.001). Importantly, the magnitude of the two correlation coefficients did not differ significantly (Fisher’s Z=0.19, p=0.849). Total WMH volume was also positively associated with HRSD scores when it was derived with the operator-driven approach (r(27)=0.436, p=0.023) or with the fully-automated approach (r(27)=0.548, p=0.003) and the magnitude of these two correlations did not differ (Fisher’s Z=0.52, p=0.603). While these differences in correlation coefficient between the two methods are not statistically meaningful, slightly higher correlations between the fully automated approach and HRSD scores probably reflects the absence of variance attributable to user error, likely is present in the operator-driven approach. Periventricular WMH were not associated with depression scores.
When we examined the association of regional WMH with age, only periventricular WMH volumes were associated with age, when derived with the operator-driven approach (r(27)=0.483, p=0.011) or the fully-automated approach (r(27)=0.513, p=0.006); the two correlation coefficients did not differ significantly from each other (Fisher’s Z=0.14, p=0.888). Total WMH volume computed with either the operator-approach or the fully-automated approach was not significantly associated with age ((r(27)=0.362, p=0.063) and (r(27)=0.246, p=0.217), respectively). Deep WMH volume was not associated with age using either method.
4. Discussion
White matter hyperintensities have emerged as neuroimaging markers robustly associated with psychiatric, neurological, and neuropsychological functions among older adults. In the current report, we presented two methodologies to derive regional WMH volumes on conventional T2-weighted fluid attenuated inverse recovery MRI scans: an operator-driven approach and a fully-automated approach utilizing in-house developed software. In addition to showing very good reliability between the two methods, we showed that the association of WMH volumes with depression scores and age were generally comparable between the two approaches. Thus, we provide evidence for both reliability between methodologies and similar criterion validity across the two approaches.
The operator-driven approach described here has several advantages. It utilizes freely available software, which can be implemented on most desktop computers. Relatively little image manipulation is required and the quantification approach is procedurally straightforward. However, a degree of expertise in regional identification and consistency of measurement is necessary to implement the procedures fully. This approach may be best suited for smaller studies, in which highly-trained operators can carry out analyses without prohibitive time constraints. In terms of overall WMH volume severity, the operator-driven approach characterized less deep tissue as hyperintense than the fully-automated approach, despite the excellent reliability between the two methods. Subtle differences in determination of the distance threshold between deep and periventricular tissue may have contributed to this discrepancy. For the visual approach, threshold determination follows a priori guidelines and is determined on a case-by-case basis with visual inspection of 2-dimensional (i.e., slice-by-slice) data, whereas the distance threshold for the automated approach is determined algorithmically in 3-dimensions.
Our automated approach offers the possibility of fully streamlined methodology with little user intervention. “Clinical” decisions, such as a establishing a distance threshold for discriminating between periventricular and deeply distributed WMH, are made a priori and applied consistently across subjects. The quantification procedures are computational straightforward, but do require other scan sequences besides FLAIR (i.e., T1-weighted anatomical images) and specialized software (e.g., MatLab) to implement. Most laboratories equipped to carry out neuroimaging research should have the tools in place to implement these procedures. It should be noted that a proportion of participants’ data were unable to be processed with the fully automated approach because of movement artifacts that would render spatial normalization invalid. With tightly monitored quality control of imaging acquisition, we believe this potential problem can be minimized.
Other groups have developed automated approaches to classify and quantify WMH (e.g., (Anbeek et al., 2004; DeCarli et al., 2005; Jack et al., 2001; Maillard et al., 2008; Wu et al., 2006)) using a variety of classification approaches, including multispectral segmentation, fuzzy-connected algorithms, K nearest neighbor classification, and threshold cut-off. Our approach combines conservative voxel intensity thresholding with a seed-growing algorithm comprising a 10-point connectivity scheme. With accurate skull stripping, enhanced by using multiple image modalities, as in the current report, we have found that this approach accurately classifies WMH. Further, by segmenting the lateral ventricles and calculating the distance of each labeled voxel from the ventricular walls we have demonstrated a reliable approach to quantifying periventricular white matter disease. Our approach can also be combined with region-of-interest atlases to quantify WMH in specific lobar or white matter tract regions (Brickman et al., 2009a).
Future work can employ these methodologies to examine further the contribution of small vessel cerebrovascular disease to various clinical and non-clinical conditions, and to explore systematically etiological factors predictive of small vessel cerebrovascular disease.
Acknowledgments
Aspects of this work were supported by the following National Institutes of Health grants: K23 AG029949 (AMB), R01 AG034189 (AMB), R01 MH55716 (SPR), K23 MH70056 (JRS), T32 MH20004 (SPR). Please contact AMB for further information on the methodologies employed in this paper.
Footnotes
Publisher's Disclaimer: This is a PDF file of an unedited manuscript that has been accepted for publication. As a service to our customers we are providing this early version of the manuscript. The manuscript will undergo copyediting, typesetting, and review of the resulting proof before it is published in its final citable form. Please note that during the production process errors may be discovered which could affect the content, and all legal disclaimers that apply to the journal pertain.
References
- American Psychiatric Association. Diagnostic and Statistical Manual of Mental Disorders, Fourth Edition. American Psychiatric Press; Washington, DC: 1994. [Google Scholar]
- Anbeek P, Vincken KL, van Osch MJ, Bisschops RH, van der Grond J. Probabilistic segmentation of white matter lesions in MR imaging. Neuroimage. 2004;21:1037–1044. doi: 10.1016/j.neuroimage.2003.10.012. [DOI] [PubMed] [Google Scholar]
- Bhadelia RA, Price LL, Tedesco KL, Scott T, Qiu WQ, Patz S, Folstein M, Rosenberg I, Caplan LR, Bergethon P. Diffusion tensor imaging, white matter lesions, the corpus callosum, and gait in the elderly. Stroke. 2009;40:3816–3820. doi: 10.1161/STROKEAHA.109.564765. [DOI] [PMC free article] [PubMed] [Google Scholar]
- Brickman AM, Honig LS, Scarmeas N, Tatarina O, Sanders L, Albert MS, Brandt J, Blacker D, Stern Y. Measuring cerebral atrophy and white matter hyperintensity burden to predict the rate of cognitive decline in Alzheimer disease. Arch Neurol. 2008a;65:1202–1208. doi: 10.1001/archneur.65.9.1202. [DOI] [PMC free article] [PubMed] [Google Scholar]
- Brickman AM, Muraskin J, Zimmerman ME. Structural neuroimaging in Altheimer’s disease: do white matter hyperintensities matter? Dialogues Clin Neurosci. 2009a;11:181–190. doi: 10.31887/DCNS.2009.11.2/ambrickman. [DOI] [PMC free article] [PubMed] [Google Scholar]
- Brickman AM, Reitz C, Luchsinger JA, Manly JJ, Schupf N, Muraskin J, DeCarli C, Brown TR, Mayeux R. Long-term blood pressure fluctuation and cerebrovascular disease in an elderly cohort. Arch Neurol. 2010;67:564–569. doi: 10.1001/archneurol.2010.70. [DOI] [PMC free article] [PubMed] [Google Scholar]
- Brickman AM, Schupf N, Manly JJ, Luchsinger JA, Andrews H, Tang MX, Reitz C, Small SA, Mayeux R, DeCarli C, Brown TR. Brain morphology in older African Americans, Caribbean Hispanics, and whites from northern Manhattan. Arch Neurol. 2008b;65:1053–1061. doi: 10.1001/archneur.65.8.1053. [DOI] [PMC free article] [PubMed] [Google Scholar]
- Brickman AM, Zahra A, Muraskin J, Steffener J, Holland CM, Habeck C, Borogovac A, Ramos MA, Brown TR, Asllani I, Stern Y. Reduction in cerebral blood flow in areas appearing as white matter hyperintensities on magnetic resonance imaging. Psychiatry Research: Neuroimaging. 2009b;15:117–120. doi: 10.1016/j.pscychresns.2008.11.006. [DOI] [PMC free article] [PubMed] [Google Scholar]
- Bronge L, Wahlund LO. White matter changes in dementia: does radiology matter? Br J Radiol. 2007;80(Spec No 2):S115–120. doi: 10.1259/bjr/35265137. [DOI] [PubMed] [Google Scholar]
- DeCarli C, Fletcher E, Ramey V, Harvey D, Jagust WJ. Anatomical mapping of white matter hyperintensities (WMH): exploring the relationships between periventricular WMH, deep WMH, and total WMH burden. Stroke. 2005;36:50–55. doi: 10.1161/01.STR.0000150668.58689.f2. [DOI] [PMC free article] [PubMed] [Google Scholar]
- DeCarli C, Miller BL, Swan GE, Reed T, Wolf PA, Garner J, Jack L, Carmelli D. Predictors of brain morphology for the men of the NHLBI twin study. Stroke. 1999;30:529–536. doi: 10.1161/01.str.30.3.529. [DOI] [PubMed] [Google Scholar]
- Fazekas F, Chawluk JB, Alavi A, Hurtig HI, Zimmerman RA. MR signal abnormalities at 1.5 T in Alzheimer’s dementia and normal aging. AJR Am J Roentgenol. 1987;149:351–356. doi: 10.2214/ajr.149.2.351. [DOI] [PubMed] [Google Scholar]
- Fazekas F, Kleinert R, Offenbacher H, Schmidt R, Kleinert G, Payer F, Radner H, Lechner H. Pathologic correlates of incidental MRI white matter signal hyperintensities. Neurology. 1993;43:1683–1689. doi: 10.1212/wnl.43.9.1683. [DOI] [PubMed] [Google Scholar]
- Folstein MF, Folstein SE, McHugh PR. “Mini-mental state”. A practical method for grading the cognitive state of patients for the clinician. J Psychiatr Res. 1975;12:189–198. doi: 10.1016/0022-3956(75)90026-6. [DOI] [PubMed] [Google Scholar]
- Franch O, Calandre L, Alvarez-Linera J, Louis ED, Bermejo-Pareja F, Benito-Leon J. Gait disorders of unknown cause in the elderly: Clinical and MRI findings. J Neurol Sci. 2009;280:84–86. doi: 10.1016/j.jns.2009.02.001. [DOI] [PubMed] [Google Scholar]
- Gunning-Dixon FM, Brickman AM, Cheng JC, Alexopoulos GS. Aging of cerebral white matter: a review of MRI findings. Int J Geriatr Psychiatry. 2008 doi: 10.1002/gps.2087. [DOI] [PMC free article] [PubMed] [Google Scholar]
- Gunning-Dixon FM, Raz N. The cognitive correlates of white matter abnormalities in normal aging: a quantitative review. Neuropsychology. 2000;14:224–232. doi: 10.1037//0894-4105.14.2.224. [DOI] [PubMed] [Google Scholar]
- Gunning-Dixon FM, Walton M, Cheng J, Acuna J, Klimstra S, Zimmerman ME, Brickman AM, Hoptman MJ, Young RC, Alexopoulos GS. MRI signal hyperintensities and treatment remission of geriatric depression. J Affect Disord. doi: 10.1016/j.jad.2010.04.004. [DOI] [PMC free article] [PubMed] [Google Scholar]
- Gurol ME, Irizarry MC, Smith EE, Raju S, Diaz-Arrastia R, Bottiglieri T, Rosand J, Growdon JH, Greenberg SM. Plasma beta-amyloid and white matter lesions in AD, MCI, and cerebral amyloid angiopathy. Neurology. 2006;66:23–29. doi: 10.1212/01.wnl.0000191403.95453.6a. [DOI] [PubMed] [Google Scholar]
- Hamilton M. A rating scale for depression. J Neurol Neurosurg Psychiatry. 1960;23:56–62. doi: 10.1136/jnnp.23.1.56. [DOI] [PMC free article] [PubMed] [Google Scholar]
- Herrmann LL, Le Masurier M, Ebmeier KP. White matter hyperintensities in late life depression: a systematic review. J Neurol Neurosurg Psychiatry. 2008;79:619–624. doi: 10.1136/jnnp.2007.124651. [DOI] [PubMed] [Google Scholar]
- Iseki K, Hanakawa T, Hashikawa K, Tomimoto H, Nankaku M, Yamauchi H, Hallett M, Fukuyama H. Gait disturbance associated with white matter changes: a gait analysis and blood flow study. Neuroimage. 49:1659–1666. doi: 10.1016/j.neuroimage.2009.09.023. [DOI] [PubMed] [Google Scholar]
- Jack CR, Jr, O’Brien PC, Rettman DW, Shiung MM, Xu Y, Muthupillai R, Manduca A, Avula R, Erickson BJ. FLAIR histogram segmentation for measurement of leukoaraiosis volume. J Magn Reson Imaging. 2001;14:668–676. doi: 10.1002/jmri.10011. [DOI] [PMC free article] [PubMed] [Google Scholar]
- Jenkinson M, Bannister P, Brady M, Smith S. Improved optimization for the robust and accurate linear registration and motion correction of brain images. Neuroimage. 2002;17:825–841. doi: 10.1016/s1053-8119(02)91132-8. [DOI] [PubMed] [Google Scholar]
- Jenkinson M, Smith S. A global optimisation method for robust affine registration of brain images. Med Image Anal. 2001;5:143–156. doi: 10.1016/s1361-8415(01)00036-6. [DOI] [PubMed] [Google Scholar]
- Liao D, Cooper L, Cai J, Toole J, Bryan N, Burke G, Shahar E, Nieto J, Mosley T, Heiss G. The prevalence and severity of white matter lesions, their relationship with age, ethnicity, gender, and cardiovascular disease risk factors: the ARIC Study. Neuroepidemiology. 1997;16:149–162. doi: 10.1159/000368814. [DOI] [PubMed] [Google Scholar]
- Liao D, Cooper L, Cai J, Toole JF, Bryan NR, Hutchinson RG, Tyroler HA. Presence and severity of cerebral white matter lesions and hypertension, its treatment, and its control. The ARIC Study. Atherosclerosis Risk in Communities Study. Stroke. 1996;27:2262–2270. doi: 10.1161/01.str.27.12.2262. [DOI] [PubMed] [Google Scholar]
- Louis ED, Brickman AM, DeCarli C, Small SA, Marder K, Schupf N, Brown TR. Quantitative brain measurements in community-dwelling elderly persons with mild parkinsonian signs. Arch Neurol. 2008;65:1649–1654. doi: 10.1001/archneurol.2008.504. [DOI] [PMC free article] [PubMed] [Google Scholar]
- Luchsinger JA, Brickman AM, Reitz C, Cho SJ, Schupf N, Manly JJ, Tang MX, Small SA, Mayeux R, DeCarli C, Brown TR. Subclinical cerebrovascular disease in mild cognitive impairment. Neurology. 2009;73:450–456. doi: 10.1212/WNL.0b013e3181b1636a. [DOI] [PMC free article] [PubMed] [Google Scholar]
- Maillard P, Delcroix N, Crivello F, Dufouil C, Gicquel S, Joliot M, Tzourio-Mazoyer N, Alperovitch A, Tzourio C, Mazoyer B. An automated procedure for the assessment of white matter hyperintensities by multispectral (T1, T2, PD) MRI and an evaluation of its between-centre reproducibility based on two large community databases. Neuroradiology. 2008;50:31–42. doi: 10.1007/s00234-007-0312-3. [DOI] [PubMed] [Google Scholar]
- McGraw KO, Wong SP. Forming inferences about some intraclass correlation coefficients. Psychological Methods. 1996;1:30–46. [Google Scholar]
- Paemeleire K. Brain lesions and cerebral functional impairment in migraine patients. J Neurol Sci. 2009;283:134–136. doi: 10.1016/j.jns.2009.02.333. [DOI] [PubMed] [Google Scholar]
- Pantoni L, Garcia JH. Pathogenesis of leukoaraiosis: a review. Stroke. 1997;28:652–659. doi: 10.1161/01.str.28.3.652. [DOI] [PubMed] [Google Scholar]
- Rorden C, Brett M. Stereotaxic display of brain lesions. Behav Neurol. 2000;12:191–200. doi: 10.1155/2000/421719. [DOI] [PubMed] [Google Scholar]
- Scheltens P, Barkhof F, Leys D, Pruvo JP, Nauta JJ, Vermersch P, Steinling M, Valk J. A semiquantative rating scale for the assessment of signal hyperintensities on magnetic resonance imaging. J Neurol Sci. 1993;114:7–12. doi: 10.1016/0022-510x(93)90041-v. [DOI] [PubMed] [Google Scholar]
- Shrout PE, Fleiss JL. Intraclass correlations: Uses in assessing reliability. Psychol Bull. 1979;86:420–428. doi: 10.1037//0033-2909.86.2.420. [DOI] [PubMed] [Google Scholar]
- Smith SM. Fast robust automated brain extraction. Hum Brain Mapp. 2002;17:143–155. doi: 10.1002/hbm.10062. [DOI] [PMC free article] [PubMed] [Google Scholar]
- Thomas AJ, O’Brien JT, Davis S, Ballard C, Barber R, Kalaria RN, Perry RH. Ischemic basis for deep white matter hyperintensities in major depression: a neuropathological study. Arch Gen Psychiatry. 2002;59:785–792. doi: 10.1001/archpsyc.59.9.785. [DOI] [PubMed] [Google Scholar]
- Williams JB. A structured interview guide for the Hamilton Depression Rating Scale. Arch Gen Psychiatry. 1988;45:742–747. doi: 10.1001/archpsyc.1988.01800320058007. [DOI] [PubMed] [Google Scholar]
- Wu M, Rosano C, Butters M, Whyte E, Nable M, Crooks R, Meltzer CC, Reynolds CF, 3rd, Aizenstein HJ. A fully automated method for quantifying and localizing white matter hyperintensities on MR images. Psychiatry Res. 2006;148:133–142. doi: 10.1016/j.pscychresns.2006.09.003. [DOI] [PMC free article] [PubMed] [Google Scholar]
- Xia Y, Hu Q, Aziz A, Nowinski WL. A knowledge-driven algorithm for a rapid and automatic extraction of the human cerebral ventricular system from MR neuroimages. Neuroimage. 2004;21:269–282. doi: 10.1016/j.neuroimage.2003.09.029. [DOI] [PubMed] [Google Scholar]