

Abstract
An elastic neutron scattering instrument, the advanced neutron diffractometer/reflectometer (AND/R), has recently been commissioned at the National Institute of Standards and Technology Center for Neutron Research. The AND/R is the centerpiece of the Cold Neutrons for Biology and Technology partnership, which is dedicated to the structural characterization of thin films and multilayers of biological interest. The instrument is capable of measuring both specular and nonspecular reflectivity, as well as crystalline or semicrystalline diffraction at wave-vector transfers up to approximately 2.20 Å−1. A detailed description of this flexible instrument and its performance characteristics in various operating modes are given.
I. Introduction
Neutron reflection and diffraction are well-established techniques for structural studies of a wide range of organic and inorganic materials, including thin films and multilayered media of interest in the biological sciences,1 especially membrane systems. The great advantage offered by neutron scattering methods derives from the dramatically different scattering lengths of hydrogen (−0.374·10−12 cm) and deuterium (0.667·10−12 cm). Specific deuteration of lipids, for example, permits determination of the transmembrane location of labeled groups within lipid bilayers2 and monolayers.3 Specular reflectivity provides information about the compositional depth profile along the nominal surface normal. The technique accesses relatively small values of the wave-vector transfer Q [=kf−ki, equivalent to (4π sin θ)/λ in the specular condition], corresponding to spatial length scales down to the nanometer range with sub-Ångström accuracy4. Nonspecular reflectivity, on the other hand, reveals in-plane scattering-length density (SLD) correlations.5 At higher Q, Bragg peak intensities are used to characterize SLDs of multilamellar samples with spatial resolutions in the Ångström to sub-Ångström range. In particular, if used in concert with x-ray diffraction on isomorphous sample preparations, neutron diffraction has proven invaluable for determining the one-dimensional (1D) structural characteristics of model bilayer membranes in great detail.6
Nevertheless, despite their power, neutron methods have been under-utilized for membrane biophysics research in the United States during the past decade due to a shortage of appropriate instrumentation. To alleviate this shortage, the advanced neutron diffractometer/reflectometer (AND/R) was constructed under the so-called Cold Neutrons for Biology and Technology partnership, involving principally the University of California at Irvine, the National Institute of Standards and Technology (NIST) Center for Neutron Research (NCNR), the University of Pennsylvania, The Johns Hopkins University, and the National Center for Research Resources. The AND/R is the first neutron instrument of its kind in the United States devoted entirely to biology- and biomedical-related research.
In addition to the large difference in cross section of the hydrogen isotopes (both coherent and incoherent), neutron scattering is an important structural tool for research in the life sciences because of the neutron's relatively simple (and therefore easily modeled), nondestructive interaction with matter and its ability to penetrate macroscopic distances through most materials. In addition, neutron scattering instrumentation can be optimized for studies of particular classes of materials on length scales of interest by proper design of source and optical components and by the choice of neutron wavelength (λ), which can be matched to the desired spatial length scale. The AND/R was optimized for λ=0.5 nm (5 Å). This wavelength—particularly useful for biological length scales of ≈100 Å—coincides approximately with the optimum wavelength for the NCNR liquid-hydrogen cold source.7
The most significant limitation of neutron scattering as a structural probe of condensed matter is the lack of beam intensity, which, in conjunction with the sample background scattering, sets the limit for spatial resolution. Incoherent scattering from hydrogen is the main source of background in biological samples. The primary goal of the AND/R instrument design was therefore to maximize the signal-to-noise ratio without sacrificing measurement resolution, as described below. At the same time, we sought to achieve high degrees of operational reliability, versatility, and convenience.
II. Instrument Description
The needs of reflectometry and diffraction from thin film multilayers impose stringent instrumentation requirements. The incident beam must be very narrow (≈microns), highly collimated [≈1–10 arcsec full-width at half-maximum (FWHM), monochromatic (Δλ/λ≈0.01)], and precisely aligned to the centers of rotation of two concentric goniometers, one for the sample and one for the detector. At the same time, the sample must be precisely aligned to the beam with respect to both angle (to within a small fraction of the beam divergence) and translation (to within a small fraction of the narrowest beam width). Finally, reflected-beam definition must be controlled by means of adjustable slits after the sample. The AND/R, modeled after the polarized-beam reflectometer at the NG1 neutron guide at the NCNR, was designed and constructed to satisfy these requirements. In addition, the instrument's capabilities were enhanced by additional features, such as a two-dimensional (2D) position-sensitive detector (PSD), gas-filled flight tubes, and increased instrument length for improved Q-resolution. Like the NG1 reflectometer, the AND/R has a focusing monochromator to increase the neutron flux on the sample and is equipped for neutron polarization and analysis (which allows the use of magnetic reference layers for phase determination and inversion1).
A. Overview
The AND/R was placed just upstream of the NG1 reflectometer, allowing the pair of instruments to share compatible facilities and equipment [Figs. 1(a) and 1(b)]. A schematic overview of the AND/R is shown in Fig. 1(c). Its horizontal scattering plane provides unrestricted access to high scattering angles, 40°>2Θ>−120° (positive is clockwise from above). A neutron guide (60 mm wide ×150 mm high) transports the neutrons from the cold source to the instrument. Vertical guide surfaces are coated with super mirrors that have a critical angle αc that is 1.2 times that of natural Ni, roughly matched to 58Ni (αc=0.595° for λ = 0.5 nm). The top and bottom walls of the guide are coated with super mirrors with αc twice that of Ni (αc = 0.99° for λ = 0.5 nm). The resulting beam divergence at the focusing monochromator is twice these values. A liquid nitrogen-cooled Be filter, 2.4 m upstream of the monochromator, removes most of the neutrons (λ<3.97 Å) that could raise background neutron counts and diffract as higher orders from the monochromator. A beam stop constructed from Boraflex and borated high-density polyethylene on a steel structure filled with wax and steel shot is placed 4.3 m from the monochromator. Motors actuate the instrument's various degrees of freedom, as described in subsequent paragraphs.
FIG. 1.
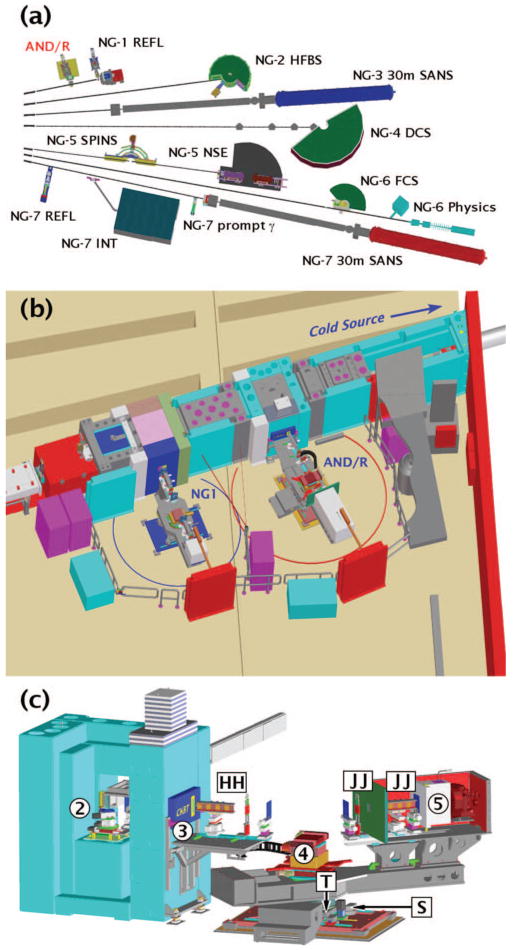
(Color) Schematic overview of the advanced neutron diffractometer/reflectometer (AND/R instrument) on the NIST Center for Neutron Research (NCNR) neutron guide NG1 and its position relative to its prototype, the NG1 reflectometer. (a). Overview of the instrument layout in the NCNR guide hall. The positions of the AND/R and NG1 reflectometers are indicated (upper left). (b). Close-up view of the AND/R and the NG1 reflectometer installed on the NG1 guide. (c). Schematic overview of the AND/R, showing the principal components (circled numbers): 2, monochromator assembly; 3, aperture plug with insert; 4, sample alignment stages; and 5, detector. The circled numbers refer to Figs. 2–5, which provide detailed views of the components. The boxed letters indicate additional components: HH, spin polarizer and flipper; JJ, spin flipper and analyzer; T, tangential translation stage; S, radial translation stage.
B. Neutron optics
Neutrons enter the AND/R instrument through a focusing monochromator located in a 0.23-m-long beam cut in the NG1 guide (Fig. 2). The focusing monochromator consists of seven units. Each unit is assembled from three pieces of (002) oriented pyrolytic graphite 50 mm long and 2 mm thick mounted with an angle of 0.3° between the layers to increase the effective mosaic in the horizontal plane. These are placed in a commercial stage that rotates each finger about a horizontal axis to point at a common focus that is continuously variable from 0.5 m to infinity. The inner five fingers are 19 mm high and rotate through their centers. To take full advantage of the 150 mm height of the guide illumination, the outer two fingers are extended to 38 mm in height, but rotate about an axis 9.5 mm from the innermost edge.
FIG. 2.
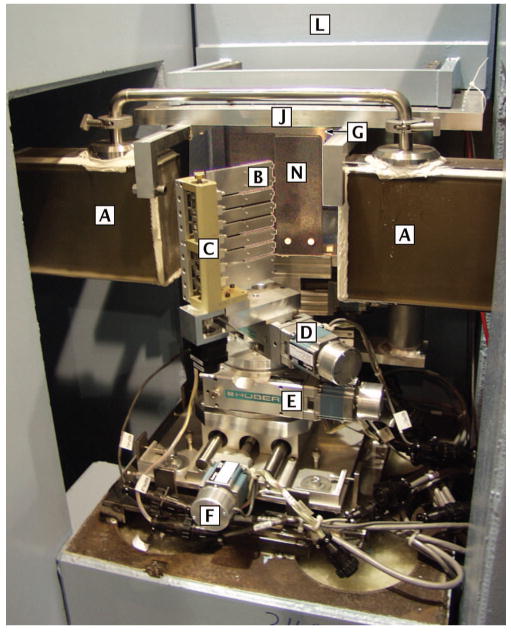
(Color) Monochromator assembly located within the guide cut of the NG1 guide. Key to boxed letters: [A] neutron guide; [B] pyrolytic graphite blades; [C] focusing assembly, [D] tilt stage, [E] rotation stage, [F] translation stage, [G] shutter, [J] optical bench, [L] shield wall, and [N] slit 1.
The focusing device is mounted on a tilt stage that provides ±20° of motion about a horizontal axis parallel to the rotation axis of the blades. Although it is usually adjusted for a horizontal beam, this tilt can be used to vary the height of the beam. The tilt stage, in turn, is mounted on a vertical-axis rotation stage to set the scattering angle of the monochromator. The monochromator, set to 48.195°, defines a neutron beam with a nominal λ = 0.50 nm at a takeoff angle ϕ = 96.39° from the guide. This angle determines the beam path and the position of the instrument in the laboratory. In order to adjust its position in a direction perpendicular to the guide, the rotation stage is mounted on a translation stage.
The local shutter is placed downstream of the monochromator. It is operated by a pneumatic actuator in a fail-safe mode that closes the beam given any one of the following conditions: loss of air pressure, loss of electricity, or an open circuit through the control key switch or the interlock on the gate of the enclosure. It is controlled through a shutter control and beam-status annunciation system common at the NCNR. This system provides an illuminated push-button control at the gate of the enclosure to open and close the shutter, and a status light mounted near the shutter that indicates if the shutter is open, closed, or in motion. A capture key switch is used to place the shutter control system in an operational mode. When the key is turned to the off position, the shutter will close and all push buttons become disabled. The local shutter opening in the shield wall is large enough (559 mm [22 in.]) horizontally to accommodate multiple monochromator systems if desired. For example, several neutron beams of various λ could be simultaneously directed toward the sample position. The wide shutter opening also allows different wavelengths to be selected. A 25-mm-wide beam can pass through the shutter opening with 70.7° < ϕ < 105.3°, corresponding to values of λ between 0.388 and 0.533 nm. Because only a single beam at ϕ= 96.39° is currently utilized, a shielding plug with a 50.8-mm (2 in.)-wide aperture is inserted into the shielding downstream of the shutter for easy removal. Consisting of a 178-mm-thick (7 in.) steel body with a borated aluminum backing plate for reduction of γ and neutron background, the aperture can be stepped down for specific experiments using steel inserts with smaller apertures. Currently, a 25.4 mm(1 in.) aperture is used. It is backed with borated aluminum and lined with a 6Li-containing polymer (“Lithoflex”) to capture neutrons without subsequent emission of γ radiation (see Fig. 3).
FIG. 3.
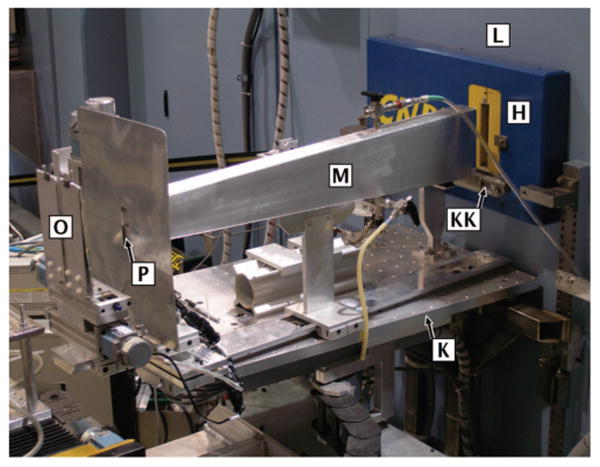
(Color) External upstream neutron optics. [L] shield wall, [H] aperture plug with 1 in. insert, [KK] monitor, [K] outer optical bench supporting the beam monitor as well as a rail which positions the [M] flight tube, [O] slit 2, and [P] vertical aperture.
Two optical benches aid the positioning of neutron optical components. The inner optical bench, Fig. 2, is mounted on the shield wall inside the monochromator cavity, positioned 127 mm above the beam centerline. It is 305 mm wide × 514 mm long (along the beam direction). The outer optical bench (533 mm wide × 838 mm long), Fig. 3, is attached to the outer face of the shield wall using a modified kinematic mount with a six-axis adjustment. Both benches are tapped with 1/4 in.-20 holes on a 50.8 mm × 50.8 mm (2 in. × 2 in.) grid. The outer optical bench and the detector arm hold X95 x-rails (Newport Corporation8), aligned to the beam path to within 0.2 mm. The distance between the bottom surface of a plate placed on top of either x-rail and the center of the beam line is 303 mm. Since the section of shielding to which both optical benches are mounted is located on the laboratory floor via a kinematic mount, the positions of the optical benches are reproducible to within 0.2 mm if the shield wall is removed and replaced. The outer optical bench holds a fixed 25.4 mm (1 in.) pencil detector with an adjustable aperture that serves as a beam monitor, which reports a signal that is proportional to the flux of neutrons exiting slit 1.
Knowledge of the distances between the major optical components is necessary to calculate the resolution function of the instrument and the beam footprint on the sample. The distances are not recorded automatically to a data file, because the positions of the slits relative to each other and to the sample are adjusted manually. But determination of the positions is complicated by the inaccessibility of the monochromator and slit 1 within the shielding. We therefore note their locations relative to an external reference line along the shutter shield-wall face, which can be positioned reproducibly by the kinematic mount. This line is the intersection of the shield wall face with the vertical plane of the ribbon beam, defined by the first two slits, at ϕ= 96.39° from the guide. At commissioning, slit 1 and the monochromator were 686 and 855 mm upstream from the reference point, respectively, and are unlikely to change. The rest of the relevant positions can be measured outside the shielding, relative to the reference line. Their current values are given in Table I.
TABLE I.
Positions along the beam path of major optical components of the AND/R. Components are labeled in accordance with Figs. 2–5.
| Component [Fig. No. 2] | Distance (mm) to reference a: shield wall b: center of rotation |
Range of motion (mm) |
|---|---|---|
| Monochromator [2, B] | −855 (a) | Fixed |
| Slit 1 [2, N] | −686 (a) | Fixed |
| Slit 2 [3, O] | 1170 (a) | 20–1206 |
| Θ [4, Q] and 2Θ [4, R] axes | 1400 (a) | +160/-210 |
| 25.4 mm pencil detector leading edge [5, FF] | 1358 (b) | 984–1500 |
| PSD front face [5, GG] | 1582 (b) | 885–1582 |
C. Neutron beam collimation
The beam can be collimated in two ways: Soller collimators mounted on the x rails for wide beams or a system of motorized slits for narrow beams, which is the primary method. The first slit is defined by two plates of boron carbide in epoxy, each 6.35 mm thick. The remaining three slits (see, for example, Fig. 3) are defined by two 2-mm-thick pieces of borated aluminum. These blades are mounted on a double-carriage mirror-image travel stage, which adjusts their separation. They are staggered in the beam direction to prevent the blades from touching when the slit is driven to full closure. The inner edges are aligned to be parallel and vertical with an accuracy of 0.05°. Slit openings have a precision of ±0.25 μm. Slit 1 is located within the monochromator shielding enclosure, mounted on the inner optical bench 210 mm from the monochromator's center of rotation. It can be opened to a maximum of 25 mm. The divergent beam from this slit illuminates slit 2. To reduce γ background induced by the divergent beam, slit 2 is backed by a Lithoflex sheet. That slit is mounted on the outer optical bench and can be positioned at a distance 875 mm<d2 < 2060 mm from the monochromator. Downstream of the sample, slit 3 can be placed at 190 mm<d3<700 mm from the center of sample rotation. Slit 4 can be located anywhere between slit 3 and the detector. If extreme sample tilts are required, slits 2 and 3 must be placed beyond 370 mm from the center of sample rotation to avoid interference with the sample translation stages.
D. Goniometers
A base assembly, secured to the floor, is used to position the concentric axes of the Θ and 2Θ goniometers. One translation is oriented along the nominal beam direction, positioned so that the rotation axes are 2.25 m from the monochromator or 1.40 m from the reference point, with an adjustment range of +160/−210 mm. The other translation is orthogonal to this direction, and is currently centered with a ±75 mm range.
The Θ goniometer rotates the sample about a vertical axis within a range of ±270°. Sample alignment is achieved using 4 independent degrees of freedom by means of mechanical stages mounted on the Θ goniometer: two orthogonal translation stages (range of ±75 mm each) and two orthogonal tilt stages (range of ±20° each). The sample tables accommodate sample environments up to 500 kg (1100 lbs). As shown in Fig. 4, the order of the stages from bottom to top is: radial translation, tangential tilt, radial tilt, tangential translation. These orientations can be switched by rotating the Θ axis by 90°. Two optical benches tapped with 1/4 in.-20 holes on a 25.4 mm×25.4 mm (1 in. × 1 in.) grid are placed on top of the sample stage. The lower one is 255 mm below the beam centerline; the upper one has a beam-to-sample table distance of 152.4 mm (6 in.). These are standard at many NCNR instruments, which allows for straightforward exchange of sample environments.
FIG. 4.
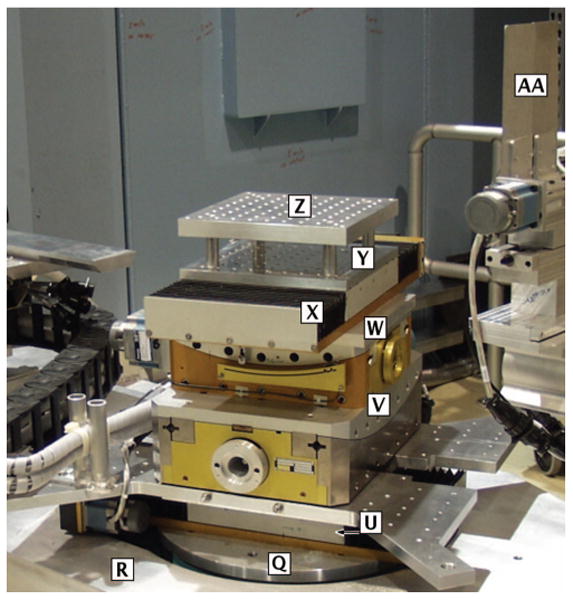
(Color) Sample alignment stages mounted on top of the Θ goniometer. [Q] Θ goniometer, [R] 2Θ goniometer, [U] radial translator, [V] tangent tilt stage, [W] radial tilt stage, [X] tangent translator, [Y] optical bench, [Z] optical bench, [AA] slit 3.
The large 2Θ goniometer, supporting slits 3 and 4 and the detector system, rotates a cantilevered, counterbalanced arm within a range of motion of +140°/−120°. An x-rail spans the range 390 mm< d< 1560 mm from the sample position. Slit 3 is typically positioned in routine measurements at the upstream end of the x-rail.
A beam stop is located on the x-rail between slit 3 and the detector shield to terminate the direct beam near the sample position for added safety. Depending on the beam stop position on the x-rail, the stop will terminate beams for 2Θ angles in the range of ±30° to ±47°. It is composed of Al, Lithoflex, and Boraflex (a borated polymer). Each layer is 610 mm high by 915 mm, except for the Lithoflex, which is only 152 mm high, centered on the beam. An aperture, 120 mm high by 108 mm wide, centered on the beam axis of the detector arm, allows the reflected or diffracted beam into the detector.
The detector shielding enclosure contains the remaining optical components and detectors (see Fig. 5). It consists of high-density polyethylene, lined internally on the sides and top with 6.4 mm Boraflex and 1.2-mm-thick borated aluminum sheets. Its outer dimensions are 1.22 m radially × 0.53 m tangentially with its leading face placed 0.74 m from the sample position. The x-rail extends through the bottom and front wall of the shielding.
FIG. 5.

(Color) Top view of detector arm, detector shielding [EE] enclosure (top off), beam stop [DD], and detectors [FF][GG]. The optical path into the detector system includes slit 3 [AA], flight path [CC], and slit 4 [BB]. (A). The detector housing contains space for the 2D position-sensitive detector [GG] and a pencil detector [FF]. The system, as shown here, is configured for detection using the pencil detector. (B). The detector enclosure configured for use of the 2D PSD at coarsest resolution.
To reduce air scattering and thus improve signal-to-noise at low reflectivities, two flight tubes may be placed in the beam. One flight tube sits before the sample between slit 2 and the plug after slit 1, as shown in Fig. 3. The other flight tube sits after the sample on the 2Θ arm (see Fig. 5). There are multiple components for the rear flight tube, depending on the chosen distance from sample to detector. The flight tubes are aluminium boxes, lined inside with borated aluminum, except for the end windows. The boxes are shaped as truncated pyramids to accommodate both in- and out-of-plane divergence of the neutron beam. The flight tubes can be filled with either Ar or He gas. With Ar, the decrease in air scatter causes the intensity on the target to increase by as much as 17%.
E. Detectors
Three detectors are available, each serving a particular purpose: A 2D position-sensitive detector (PSD), provided by Brookhaven National Laboratory, and two pencil detectors with 25.4 and 50.8 mm diameters (1 or 2 in., respectively), provided by GE Reuter-Stokes (Twinsburg, OH). They are placed in a high-density polyethylene shielding block within the shielding enclosure described above. The PSD resides in the enclosure at all times while the pencil detectors are inserted into the housing in front of the PSD as needed (see Fig. 5). The central 45.7 mm of the 2 in. detector is used to measure wide beams, achieving a total efficiency of 99.9% at the widest setting. This allows the fastest data collection for experiments that can use wide beams. For experiments that use a narrower beam, the 1 in. pencil detector is used (99.9% efficiency up to a 15.2 mm beam width). Due to its smaller size, this detector has lower background.
The PSD is a 3He multi-wire proportional chamber with cathode readout9 and has an active area 21.3 cm wide × 17.9 cm high. The fill-gas is a mixture of 3He (72.3%) and propane (27.7%) at a gauge pressure of 7.6 atm. Propane was chosen as a quench gas for its high stopping power, low sensitivity to γ radiation, and compatibility with the molecular sieve used as a gas purifier.10 Cathode components in the X and Y directions form a resistively coupled array with a pitch of 1.5875 mm. Fiducial “readout” taps, spaced 11.1125 mm apart, are used to measure the charge deposited in the quench gas by the n-3He reaction. By measuring the proportion of charge delivered to neighboring taps as a result of a neutron event, a high-speed field-programmable gate array performs a center-of-mass calculation and a high-speed digital signal processor bins the event centroid into a 608 × 512 element histogram with a precision of 0.34747 mm/pixel. Calibrations of the event positioning performed by placing a cadmium mask with test grid of 1.5875 mm holes spaced 25.4 mm apart show the global position encoding to be in excellent agreement with the nominal values, deviating from ideal by at most 1%. Furthermore, tests with another cadmium mask consisting of 0.5 mm holes with graduated spacings between 1.0 and 6.0 mm (in steps of 0.25 mm) demonstrate that the position encoding system is able to distinguish 0.5 mm features 2.0 mm apart. An ultrahigh-resolution test performed by sweeping a beam narrower than the pixel pitch demonstrates a local deviation of linearity in the X direction with FWHM of 1 pixel, which can be attributed to nonuniformity of pixel size.
The position-encoding of each neutron event is accomplished by a high-speed field-programmable gate array,11 enabling a theoretical maximum count rate of 100 kHz. Tests in the field demonstrate that response of the detector as a whole to neutron flux is linear up to count rates of 5 kHz. Measurements of the uniformity of detector response are performed by placing a 6 mm Plexiglas sheet in the beam at the sample position and rotating the detector arm to expose it to the isotropically scattered radiation. The resulting image is modulated in intensity by ±10% with peaks centered on the locations of the readout taps. This variation can be attributed to a 10% variation of effective pixel size, which originates, in part, from the systematic variation of electric field inside the detector due to the cathode and anode grids. The effects of this variation on relative intensity and position can be mitigated by driving the instrument in such a way as to keep the principal part of the scattered beam fixed on the detector. Pixel intensity (but not position) can be adjusted for smoothly varying features in scattering measurements by dividing the image pixel for pixel by the renormalized uniformity measurement.
F. Polarization option
Optional polarized-beam operation requires two sets of polarizers and neutron spin-flippers. The set before the sample is positioned on the rail attached to the outer optical bench [Fig. 1(c) (HH)]. The set after the sample is located within the detector shielding enclosure [Fig. 1(c) (JJ)]. The standard polarizer is a magnetic multilayer operated in transmission mode.12 The polarizer assemblies include Lithoflex beam stops to absorb the unused (reflected) spin orientation. These beam stops can be removed from the downstream polarizer, if the PSD is used to measure both polarizations simultaneously. Alternatively, when using the PSD for diffuse polarized beam measurements, the polarizer after the sample can be replaced with an 3He polarizer.13
G. Standard sample environments for multilayer diffraction and reflectometry
The vertical substrate plane required by this instrument restricts the samples to air-solid and solid-liquid (typically aqueous buffer for biological samples) interfaces. Within these constraints, several sample environments have been developed with the goals of minimizing the sample-dependent background while maximizing the flexibility and adaptability of samples accepted under state-of-the-art environmental controls.
Lipid multi-bilayer samples, prepared on solid substrates (glass or quartz slides, Si wafers, etc.) for 1D diffraction experiments, are measured in a dedicated sample chamber. This chamber provides humidity and temperature control and consists of a brass heating/cooling stage on which the sample is mounted via an Al clamp. The stage is covered by a cylindrical double-wall Al canister for thermal insulation. The two cans may be detached from the sample stage independently of each other. When mounted together, the space between them may be evacuated for enhanced thermal insulation. The air inside the inner Al can may be replaced by a noble gas (typically Ar or He) to provide thermal contact of the sample with the heating stage while reducing air scattering. A sample as large as 100 mm in diameter can fit inside the smaller Al can.
Water circulation from a water bath, fed through the brass sample stage, is used as the standard means of temperature control. Alternatively, electrical resistance heaters or Peltier elements in contact with the heating stage use the thermal bath as a heat sink. Two electrical feedthrough connectors fitted with vacuum seals allow for mounting of electrical elements such as temperature and humidity sensors on the sample inside the chamber. The humidity is routinely controlled by saturated salt solutions, enclosed within the sample compartment. In addition, a portable dew point generator is available and may be used in combination with the salt solution to attain a faster equilibration of the sample, especially when high humidities are required. The humidity is monitored using a combined temperature/humidity sensor (Vaisala, Helsinki). With this setup, diffraction measurements on multilayer samples at relative humidities below 95% can be performed routinely.
Neutron reflection measurements at solid-liquid interfaces are particularly relevant to biological systems as they allow sample characterization in the fully-hydrated state. Such systems also allow characterization before and after sample manipulation, e.g., the structural assessment of a membrane prior to the injection of a reactant and subsequent reassessment, typically a peptide or protein, that interacts with the membrane or its surface. Samples at the solid-liquid interface normally require the neutron beam to penetrate from the side of the solid substrate, passing through to reflect from the (membrane-functionalized) interface. This limits the choices of solids to low-attenuation materials—typically single crystal substrates such as silicon, quartz, or sapphire. The transmitted portion of the neutron beam then continues into the solvent reservoir, where incoherent scattering gives rise to an approximately isotropic background, which is the major source of background for most biological samples.
A sample cell has been designed for use with 76 mm (3 in.) circular wafers on the AND/R, which minimizes the amount of solvent held in contact with the sample surface—reducing it to a layer 100 μm thick, over a single-crystal silicon backing. The solvent in this reservoir can be flowed from the outside allowing easy replacement of the aqueous buffer without disassembly of the cell, or an experiment requiring continuous replenishment of the reservoir. Beyond the reduction of the incoherent background, a second advantage of the small sample reservoir is the very small volume to fill, ≈2 ml, which is particularly important for many biological systems where samples are difficult and expensive to produce. Measurements routinely approach 10−7 reflectivity in D2O using this sample cell, and 10−6 in H2O within data acquisition times of ≈6 h. The sample cell design is compact, allowing multiple samples to be placed on the instrument at one time, and can be temperature controlled over a wide range through the use of attachable heating/cooling plates connected to the recirculating water bath. Other modules of the sample cell under development will provide capabilities for measurements under potentiometric control or allow sample illumination, e.g., for in situ polymerization with UV light.
III. Instrument Characterization
During assembly, each component was aligned to ≈0.0015° or ≈20–50 μm, using a theodolite. The Θ and 2Θ axes were aligned to be parallel within ∼0.005° and concentric within ≈ 10 μm. After construction, the alignment of the instrument was fine-tuned using neutrons. The beam center was made to coincide with the center of the Θ and 2Θ rotation axes. The monochromator was focused to sample position by maximizing the intensity through a 40-mm-high aperture located at the center of rotation (Θ and 2Θ).
A. Beam profiles
The vertical and horizontal beam profiles were measured by translating additional slits, located at the sample position. Figure 6 shows the vertical beam profile taken with a 2-mm-high vertical slit spanning the horizontal width of the beam. The circles correspond to data taken without any devices to condition the beam vertically. The 56.4 mm FWHM is about twice the ideal value of 28.8 mm obtained by convoluting the 19 mm monochromator blade height with the 0.5° mosaic over the 2200 mm monochromator-to-sample distance. This indicates spreading of the beam due to the effects of the outer-two monochromator blades (which are twice as wide as the inner ones), and to errors in alignment of the individual pieces of graphite. The triangles correspond to data taken after attaching the He-filled flight tube and a 40-mm-high aperture, centered on the beam upstream of slit 2 (i.e., 345 mm from the Θ center of rotation.
FIG. 6.
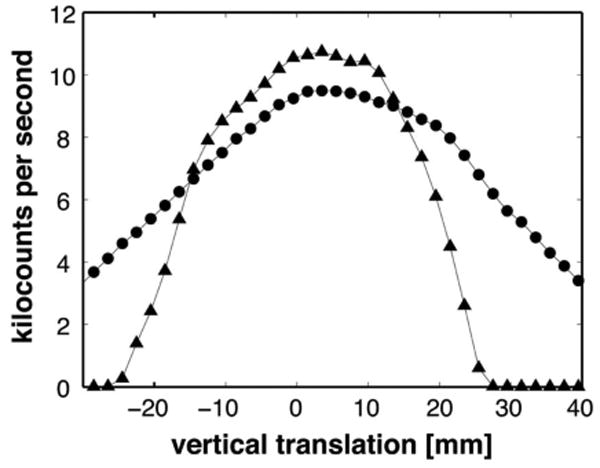
Vertical beam profile at the sample position. The profile was taken with a 2-mm-high slit spanning the horizontal width of the beam. The 56.4 mm FWHM is about twice the ideal value of 28.8 mm obtained by convoluting the 19 mm monochromator blade height with the 0.5° mosaic over the 2200 mm monochromator-to-sample distance. Circles represent data collected without devices for conditioning the beam vertically. Triangles represent data collected for the final condition, including the gas-filled flight tube and a 40-mm-high vertical aperture.
The horizontal beam profiles shown in Fig. 7 were obtained with vertical slits 1 and 2 set to 6 mm. A 0.2 mm vertical probe slit at the sample position was aligned with the instrument slits and scanned perpendicular to the beam. The shape of the beam profile agrees well with the trapezoid predicted by ray tracing, with a top as wide as the incident slits and the base 1.2 times this width. The curvature at the vertices of the trapezoid corresponds to convolution of the probe-slit opening with the trapezoidal beam profile. The slight increase in intensity to the right of the graph is due to the very thin probe slit openings compared to the 1 mm offset between the blades in the direction of the beam path. This effect decreases as the probe slit-width increases.
FIG. 7.

Horizontal beam profile at the sample position. The profile was obtained with vertical slits 1 and 2 set to 6 mm. A 0.2 mm vertical probe slit at the sample position was aligned with the instrument slits and scanned perpendicular to the beam.
B. Wavelength
Diffraction from the (111) planes of a Si wafer was used to determine the neutron wavelength λ0. For this measurement, the first two slits were set to 2 mm. The wafer's surface was initially aligned to the incident beam by bringing it parallel to the beam and centering it in the beam. The (111) reflection profile was then found at Θ ≈ 53° and measured with high resolution. The peak was fit to a Gaussian as shown in Fig. 8 centered at Θ = 52.963°, with an uncertainty of δΘ = 0.048° (8.82 × 10⁻⁴ rad). Using Bragg's law and the lattice constant of Si, λ0 was determined to be 5.006(±0.003) Å, as follows:
FIG. 8.
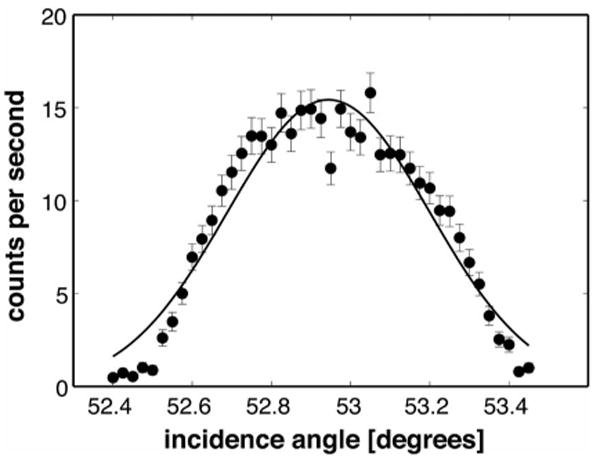
High-resolution scan of a Si (111) Bragg peak to determine the instrument's neutron wavelength. For this measurement, the first two slits were set to 2 mm and the surface of the wafer was centered in the beam. From a fit of the data points to a Gaussian (solid curve), the peak was found to be centered at Θ=52.963(±0.048)°, which yields λ0=5.006(±0.003) Å from Bragg's law and the Si lattice constant.
| (1) |
| (2) |
This analysis does not take into account other, smaller sources of error. The most relevant of those is a possible displacement of the center of the scattering in the Si crystal from the center of rotation of the instrument, due either to alignment uncertainties (∼10 μm) or to the penetration of the neutrons into the single crystal Si sample (limited by primary extinction to ∼30 μm). These effects would shift the determined value of λ by an amount approximately 1% of the estimated uncertainty.
C. Instrument resolution
The wavelength resolution was determined using the Si (111) sample. The scan in Fig. 8 was repeated for instrument slit settings of 1, 3, and 5 mm. For each of these settings, the beam divergence ΔΘ was determined geometrically and ΔQ/Q was measured from the FWHM of the observed intensity peak. Using equation
| (3) |
Δλ/λ was determined to be constant at ≈0.9%. The details of these results are compiled in Table II.
TABLE II.
Contributions to instrument resolution.
| Slit widths (mm) 1, 2 | Δθa (radians) | Δθ/θ | ΔQ/Qb | Δλ/λ |
|---|---|---|---|---|
| 5, 5 | 0.0026 | 0.0028 | 0.0184 | 0.0090 |
| 3, 3 | 0.0016 | 0.0017 | 0.0184 | 0.0091 |
| 1, 1 | 0.00053 | 0.00057 | 0.0184 | 0.0091 |
Determined from slit widths.
Determined from FWHMs of Si(111) diffraction peak.
D. Neutron flux
Reflectometry measurements are typically taken with the first two slit-widths increasing in proportion to Θ, so as to provide greater incident intensity at higher angle where reflectivity is lowest. This also provides an approximately constant ΔQ/Q and constant footprint on the sample. However, the intensity as a function of the slit openings must be known to correct the data. A scan of incident beam intensity (with sample removed and the detector fixed in the main beam) is shown in Fig. 9. Incident intensity is plotted versus slit opening, after correcting for attenuators. For the lowest slit opening (0.05 mm) the incident intensity is 100 cps. At the maximum slit opening shown (6 mm), the incident intensity of 10,000,000 cps corresponds to a neutron flux of ∼1.27 × 10⁶ counts cm−2 s−1 averaged over the entire beam, including the tails shown in Fig. 6 (triangles) and Fig. 7.
FIG. 9.
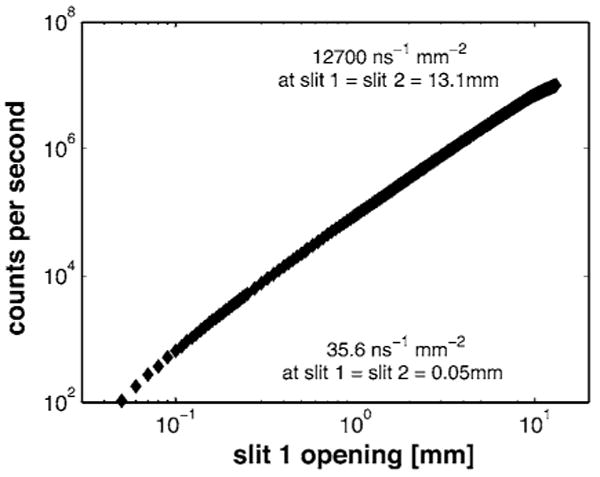
A scan of incident-beam intensity as a function of beam width. For these measurements, the sample was removed and the detector fixed in the main beam. For the lowest slit opening (0.05 mm) the incident intensity is 100 cps. At the maximum slit opening shown, the incident intensity of 10,000,000 cps corresponds to a neutron flux of ∼1.27×10⁶ counts cm−2 s−1.
IV. Performance Examples
A. 1D diffraction
Several examples are chosen to highlight the capabilities of AND/R in its primary modes of operation. In the first example (Fig. 10), diffraction from multi-lamellar (bilayer) membranes of L-α-dimyristoylphosphatidylcholine (DMPC) and cholesterol (20 mol %) oriented parallel to a supporting glass surface was measured in a Θ−2Θ scan at two relative humidities (RH) (D. Worcester and M. Mihailescu, unpublished). The data shown in Fig. 10 were collected over a time of ≈7 h for each scan. Notable diffraction peaks were detected up to high values of the scattering vector, e.g., Qz ≈1.9 Å−1, corresponding to 2Θ ≈ 100°. This is a direct consequence of the high resolution of the instrument, combined with a high degree of order in the diffracting sample. It should be emphasized that important structural information is conveyed in the relatively small intensities of higher order peaks (up to 17th order in the example shown in the inset in Fig. 10). An incomplete determination of the diffraction peaks at high Qz, due to poor instrumental resolution or geometrical limits or high incoherent noise level relative to the coherent signal, could result in an under-resolved scattering-length density profile.
FIG. 10.
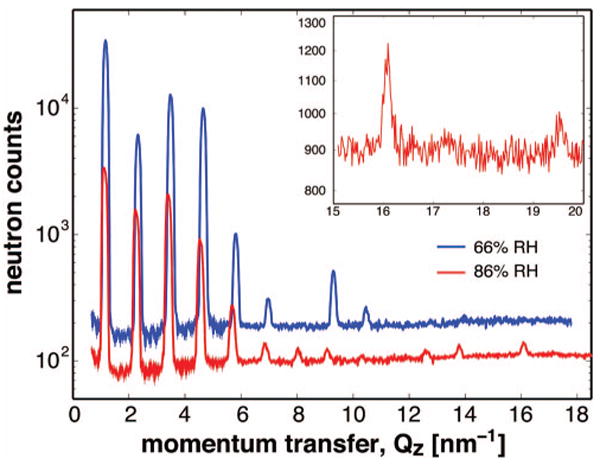
(Color) Neutron diffraction from oriented lipid multilayers (80% DMPC, 20% cholesterol) at 66% relative humidity (RH) (blue trace) and 86% RH (red trace). The inset shows the high-Qz regime of the 86% RH data. The Bragg peak at ∼1.96 Å−1 corresponds to the 17th diffraction order. The data collection time for each scan was ∼7 h.
Although multilayers of this composition normally have only moderate order at room temperature and RH above 58%, a highly ordered structure was observed as a consequence of prolonged storage of the sample at low temperature and low humidity. The structure was stable for several days at room temperature and RH of 86% or less (see 86% RH data in Fig. 10). At higher humidity, the multilayers returned to the usual low-ordered state, which then persisted for lower humidity at room temperature (see 66% RH data in Fig. 10). Thus, the highly ordered semicrystalline structure formed at low temperature can be maintained at room temperature, depending on hydration.
The data shown in Fig. 10 are also an excellent illustration of the high sensitivity of the method to very small structural changes in the system, such as the number of water molecules per lipid due to changes in the humidity in the sample chamber. The decrease in peak separation with increasing humidity indicates an increase in the repeat spacing, i.e., from 54.06±0.07 Å at 66% RH to 55.06±0.12 Å at 86% RH. Moreover, the relative intensities of the diffraction peaks undergo notable changes. These observations reveal the extreme sensitivity and stability of the AND/R operated in the diffraction mode.
B. Performance in reflectometry from a “perfect” sample
In order to determine the ultimate performance of the AND/R in reflectivity mode, measurements were made on a 5.5 nm thermal oxide (SiO2) layer. Figure 11 shows data collected in about 1.5 days using the 1 in. pencil detector. Useful measurements of reflectivity approaching 10−9 are clearly seen. Smaller error bars at high Q could have been obtained by using the 2 in. detector. The signal-to-noise ratio should be the same for the 2 in. detector, because the main source of background in reflectometry experiments is incoherent scattering from the substrate. Since the active area of the 2 in. detector is ≈3× that of the 1 in. detector, a roughly ninefold increase of flux for a 2 in. pencil detector is expected, resulting in a reduction of error bars by a factor of 3 for a given data acquisition time. In the example shown, this would result in a clear determination of the minima at Qz ≈0.45 Å−1 and the ability to obtain useful data to Qz ≈0.6 Å−1.
FIG. 11.

Reflectivity of a sample consisting of a 5.5 nm thermal oxide film on silicon measured on the AND/R reflectometer. The data, which yield useful measurements of reflectivity approaching 10−9, were collected in 1.5 days using the 1 in. pencil detector.
C. Reflectometry from biomimetic membranes
Tethered membranes are systems designed for the incorporation of membrane-associated proteins.14 In order to be useful as a biomembrane model, such membranes need to retain their fluid in-plane organization and at the same time remain separated from the supporting solid interface by a molecularly thin hydration layer.15 Neutron reflection is uniquely capable of characterizing in molecular detail the resulting membrane structures, particularly with respect to this hydration layer. Furthermore, the versatility of the AND/R sample environment enables stepwise characterization of the functionalized surface both at the monolayer level and after bilayer completion.
A typical example from ongoing work is shown in Fig. 12 (D. J. McGillivray and M. Lösche, unpublished). In this work, tethered membranes have been prepared using a thiolated lipopolymer, 20-tetradecyloxy-3,6,9,12,15,18,22-heptaoxahexatricontane-1-thiol (WC14). The sample preparation involves two steps: adsorption of the tether lipid from organic solvent followed by bilayer completion via rapid solvent exchange.16 Neutron reflectivity measurements have established that WC14 by itself forms monolayer films that exclude solvent in the hexaethylene oxide compartment near the solid substrate (data not shown). We therefore co-adsorbed WC14 with a smaller thiolated “back-filler,” β-mercaptoethanol, in order to dilute the lipopolymer at the interface, thus creating space for hydration. Bilayer completion is achieved by incubation of the monolayer film with an ethanol solution of diphytanoylphosphatidylcholine, which is rapidly displaced by a large excess of aqueous buffer. The resulting “sparsely-tethered membranes” have been characterized by electro-impedance spectroscopy, neutron scattering, and susceptibility to exogenous enzyme activity.17
FIG. 12.
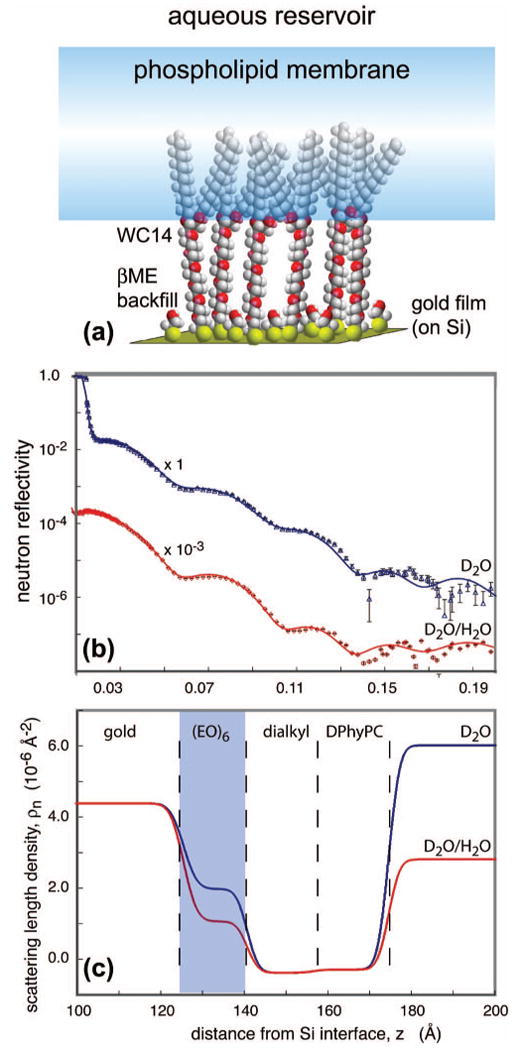
(Color) Neutron reflection from a silicon wafer surface functionalized with a 100 Å gold film on which a lipid bilayer membrane was chemically tethered. (a). The chemical structure shown schematically. Because the lipopolymer WC14 was co-adsorbed with the back-filler, β-mercaptoethanol, in order to reduce the density of WC14 grafted to the gold surface, we refer to this system as a sparsely-tethered membrane. (b). Neutron reflection data (symbols) for two distinct water contrasts. (c). Scattering-length density profiles derived from simultaneous fits to both data sets in B.
Figure 12(b) shows exemplary data sets of the system discussed above in two distinct solvent contrasts (pure D2O and an H2O/D2O mixture with SLD 3 × 10⁻⁶ Å−2), acquired using the 1 in. pencil detector. The derived SLD profiles, Fig. 12(c), were obtained using slab models that were co-refined with the program ga_refl.18 As the co-refinement depends on the assumption that the sample is identical except for the distinct solvent contrasts, the measurements used the same sample, with the exchange of the isotopically distinct aqueous buffers performed in situ. As is evident from the differences in the SLD profiles, the hexaethylene oxide spacer region is highly hydrated while the bilayer membrane covers the substrate homogeneously. Preparations such as the one shown thus constitute biomimetic membrane systems that are very well suited for a functionalization by reconstitution with membrane-associated proteins.
D. Crystallography option
The AND/R is also well suited for collecting 2D diffractograms of crystalline structures, with just a few, rapid adjustments of the collimation and replacement of the pencil detector with the PSD (see Fig. 5).
An example of macromolecular crystalline diffraction using the instrument is shown in Fig. 13. A poly(ethylene oxide)/poly(propylene oxide), PEO-PPO–PEO, triblock copolymer, the Pluronic polyol F127, forms crystalline structures in the gel phase at high concentrations.19 F127 is discussed as a separation medium for biological macromolecules in capillary electrophoresis with applications in automated genome sequencing. A crystalline sample was studied that was prepared from an aqueous solution (21 wt% in D2O). For the experiment on the AND/R, the vertical divergence of the incident beam was reduced to about twice the horizontal divergence, and a sample volume of ≈3 × 3 × 2 mm3 was exposed. The diffraction spots observed in Fig. 13 correspond to the (111) and (200) reflections of a face-centered cubic lattice with a lattice constant of 29.5 nm, as has been previously observed in small-angle x-ray scattering measurements.19 The exposure time was 10 min. Diffraction for the (220) and (311) reflections were also observed.
FIG. 13.

(Color) Two-dimensional diffraction image from a poly(ethylene oxide)/poly(propylene oxide), PEO-PPO-PEO (21% D2O), triblock copolymer, which forms crystalline structures in the gel phase at high concentrations (see Ref. 19).
The high resolution due to the low wavelength spread, Δλ/λ∼ 1% and the possibility to move the detector arm over a large range of angles add to the flexibility of the instrument and its potential use in protein crystallography.
Acknowledgments
We thank the Facilities Operations Group of the NIST Center for Neutron Research for their efforts in the design, fabrication, and assembly of the AND/R instrument and related facilities. We thank Dr. Michael Rowe and Dr. Jack Rush for their visionary support of the Cold Neutrons for Biology and Technology (CNBT) project that made the AND/R a reality. The CNBT is a Biotechnology Research Partnership supported in part by a grant from the National Institute of Research Resources (RR14812; SHW, PI) and by The Regents of the University of California. D. J. M. is supported through a NSF NIRT grant (Contract No. 0304062).
Contributor Information
Joseph A. Dura, NIST Center for Neutron Research, National Institute of Standards and Technology, 100 Bureau Drive, Mail Stop 8562, Gaithersburg, Maryland 20899-8562
Donald J. Pierce, NIST Center for Neutron Research, National Institute of Standards and Technology, 100 Bureau Drive, Mail Stop 8562, Gaithersburg, Maryland 20899-8562
Charles F. Majkrzak, NIST Center for Neutron Research, National Institute of Standards and Technology, 100 Bureau Drive, Mail Stop 8562, Gaithersburg, Maryland 20899-8562
Nicholas C. Maliszewskyj, NIST Center for Neutron Research, National Institute of Standards and Technology, 100 Bureau Drive, Mail Stop 8562, Gaithersburg, Maryland 20899-8562
Duncan J. McGillivray, Department of Physics, Carnegie Mellon University, Pittsburgh, Pennsylvania 15213
Mathias Lösche, Department of Physics, Carnegie Mellon University, Pittsburgh, Pennsylvania 15213.
Kevin V. O'Donovan, Department of Physiology and Biophysics, University of California at Irvine, Medical Sciences I - D346, Irvine, California 92697-4560.
Mihaela Mihailescu, Department of Physiology and Biophysics, University of California at Irvine, Medical Sciences I - D346, Irvine, California 92697-4560.
Ursula Perez-Salas, Department of Physiology and Biophysics, University of California at Irvine, Medical Sciences I - D346, Irvine, California 92697-4560.
David L. Worcester, Department of Physiology and Biophysics, University of California at Irvine, Medical Sciences I - D346, Irvine, California 92697-4560.
Stephen H. White, Department of Physiology and Biophysics, University of California at Irvine, Medical Sciences I - D346, Irvine, California 92697-4560.
References
- 1.Majkrzak CF, Berk NF, Krueger S, et al. In: Neutron Scattering in Biology. Fitter J, et al., editors. Springer; New York: 2005. [Google Scholar]; Lösche M. In: Curr Top Membr. Simon SA, McIntosh TJ, editors. Academic; San Diego: 2002. p. 115. [Google Scholar]
- 2.Zaccai G, Büldt G, Seelig A, et al. J Mol Biol. 1979;134:693. doi: 10.1016/0022-2836(79)90480-7. [DOI] [PubMed] [Google Scholar]; Büldt G, Gally HU, Seelig J, et al. ibid. 1979;134:673. doi: 10.1016/0022-2836(79)90479-0. [DOI] [PubMed] [Google Scholar]
- 3.Vaknin D, Kjær K, Als-Nielsen J, et al. Biophys J. 1991;59:1325. doi: 10.1016/S0006-3495(91)82347-5. [DOI] [PMC free article] [PubMed] [Google Scholar]
- 4.Seah MP, Spencer SJ, Bensebaa F, et al. Surf Interface Anal. 2004;36:1269. [Google Scholar]
- 5.Salditt T, Münister C, Vogel M, et al. Phys Rev E. 1999;60:7285. doi: 10.1103/physreve.60.7285. [DOI] [PubMed] [Google Scholar]
- 6.Wiener MC, White SH. Biophys J. 1992;61:434. doi: 10.1016/S0006-3495(92)81849-0. [DOI] [PMC free article] [PubMed] [Google Scholar]
- 7.Williams RE, Rowe JM. Physica B. 2002;311:117. [Google Scholar]
- 8.Certain commercial equipment, instruments, or materials (or suppliers, or software, …) are identified in this paper to foster understanding. Such identification does not imply recommendation or endorsement by the National Institute of Standards and Technology, nor does it imply that the materials or equipment identified are necessarily the best available for the purpose.
- 9.Radeka V, Schaknowski NA, Smith GC, et al. In: Neutrons in Biology. Schoenborn BP, Knott RB, editors. Plenum; New York: 1996. p. 57. [Google Scholar]; Radeka V, Schaknowski NA, Smith GC, et al. Nucl Instrum Methods Phys Res A. 1998;419:642. [Google Scholar]
- 10.Boie RA, Fischer J, Inagaki Y, et al. Nucl Instrum Methods. 1982;200:533. [Google Scholar]
- 11.Pietraski PJ, Zojceski Z, Siddons DP, et al. IEEE Trans Nucl Sci. 1999;46:810. [Google Scholar]
- 12.Majkrzak CF. Physica B. 1995;213214:904. [Google Scholar]
- 13.Chen WC, Gentile TR, O'Donovan KV, et al. Rev Sci Instrum. 2004;75:3256. [Google Scholar]
- 14.Tamm LK, McConnell HM. Biophys J. 1985;47:105. doi: 10.1016/S0006-3495(85)83882-0. [DOI] [PMC free article] [PubMed] [Google Scholar]
- 15.Sackmann E. Science. 1996;271:43. doi: 10.1126/science.271.5245.43. [DOI] [PubMed] [Google Scholar]
- 16.Cornell BA, Braach-Maksvytis VLB, King LG, et al. Nature (London) 1997;387:580. doi: 10.1038/42432. [DOI] [PubMed] [Google Scholar]
- 17.Valincius G, McGillivray DJ, Febo-Ayala W, et al. J Phys Chem B. 2006;110:10213. doi: 10.1021/jp0616516. [DOI] [PubMed] [Google Scholar]
- 18.Kienzle PA, Doucet M, McGillivray DJ, et al. 2000-2006 http://www.ncnr.nist.gov/reflpak/garefl.html.
- 19.Wu C, Liu T, Chu B, et al. Macromolecules. 1997;30:4574. [Google Scholar]