Abstract
Dual-energy chest radiography has the potential to provide better diagnosis of lung disease by removing the bone signal from the image. Dynamic dual-energy radiography is now possible with the introduction of digital flat panel detectors. The purpose of this study is to evaluate the feasibility of using dynamic dual-energy chest radiography for functional lung imaging and tumor motion assessment. The dual energy system used in this study can acquire up to 15 frame of dual-energy images per second. A swine animal model was mechanically ventilated and imaged using the dual-energy system. Sequences of soft-tissue images were obtained using dual-energy subtraction. Time subtracted soft-tissue images were shown to be able to provide information on regional ventilation. Motion tracking of a lung anatomic feature (a branch of pulmonary artery) was performed based on an image cross-correlation algorithm. The tracking precision was found to be better than 1 mm. An adaptive correlation model was established between the above tracked motion and an external surrogate signal (temperature within the tracheal tube). This model is used to predict lung feature motion using the continuous surrogate signal and low frame rate dual-energy images (0.1 to 3.0 frames /sec). The average RMS error of the prediction was (1.1 ± 0.3) mm. The dynamic dual-energy was shown to be potentially useful for lung functional imaging such as regional ventilation and kinetic studies. It can also be used for lung tumor motion assessment and prediction during radiation therapy.
Keywords: x-ray imaging, Dual Energy, Chest Radiography, lung functional imaging, tumor motion
1. Introduction
Chest radiography is the most commonly used x-ray imaging technique. It plays an essential role in the diagnosis of lung diseases, including lung cancer. Traditional chest radiograph is a single static image that provides anatomic information. Recently, with the development of digital flat panel detectors, it is possible to acquire dynamic chest radiographs(Tanaka, Sanada et al. 2004). Dynamic chest radiography is a technique that can take multiple frames of the patient's chest during respiration. It provides a series of the anatomic changes of the lung, which may be used to assess the regional lung function for the diagnosis of lung diseases such as emphysema and chronic obstructive pulmonary diseases (Tanaka, Sanada et al. 2006; Tanaka, Sanada et al. 2008). To better evaluate lung function, quantitative analysis of the dynamic images is desired. Quantitative evaluation includes regional lung density variation or lung tissue motion during breathing. However, due to the overlapping rib signal in the image, the accuracy of these analyses is questionable. For example, ribs moving in and out of the region of interest will interfere with lung density measurements. The tracking of lung tissue (lung vessels) is usually impeded by the motion of the ribs. Dynamic dual-energy chest radiography, i.e. multiple dual-energy images obtained during respiration, can address this problem. Dual-energy x-ray imaging can separate bone and soft-tissue in the images by taking the advantage of their differences in x-ray attenuation coefficients.
Dynamic dual-energy chest radiography can also be applied to tumor motion management for radiation therapy. Before lung cancer patients are treated with external beam radiotherapy, a pre-assessment of the tumor motion is completed to determine if respiratory motion management is necessary. It is recommended that motion management be required when the tumor motion range is larger than 5 mm(Keall, Mageras et al. 2006). In the traditional method, a sequence of fluoroscopy images is acquired during breathing cycles and a physician manually marks the location of the tumor in each frame (Cui, Dy et al. 2007; Lin, Cervino et al. 2009). This technique is both time consuming and oftentimes inaccurate. An alternative method would be to use computer software to automatically determine the location of the tumor from acquired images. The rib signal, which is always present on lung images, usually has a different movement and a higher contrast than the tumor. Therefore, the rib signal interferes the computer program and the program can fail to effectively track the tumor on the image. Dynamic dual-energy chest radiography may be used to remove the rib signal and provide both an automatic and accurate assessment of the tumor motion. Dual-energy imaging is a much faster and cheaper technique than MRI (Plathow, Ley et al. 2004)or CT(Hof, Rhein et al. 2009). Most importantly, as we will show, it exposes patients to a much lower level of radiation in comparison to the CT-based method.
Tanaka et al have proposed a sequential dual-energy subtraction technique(Tanaka, Sanada et al. 2004) to track tumor motion. However, in their technique the two sequences of low and high energy images were acquired at different time. Complex local image co-registration and deformation need to be performed before dual-energy subtraction to avoid artifact. In our proposed dynamic dual-energy technique, the two image sequences were acquired simultaneously, thus, the technique is free of motion artifacts.
In this study, we implemented the dynamic dual-energy chest radiography using a flat panel detector. Animal studies were performed to evaluate the feasibility of this technique in lung functional imaging and tumor motion assessment.
2. Materials and Methods
2.1 Basics of dual-energy subtraction radiography
Dual energy subtraction requires the acquisition of two digital radiographic images at different x-ray energies (i.e., one “low” and one “high”) (Molloi and Mistretta 1989). The pixel value in the low (L) and high (H) energy images can be simplified as Equation (1).
| (1) |
where subscripts l and h describe the beam energy (low and high, respectively) and superscripts t and b describe the material (tissue and bone, respectively). L0 and H0 represent incident exposures for the low and high energy beams, and μ is the attenuation coefficient. The dual-energy image is formed by weighted log subtraction of the low energy image from the high given by Equation (2).
| (2) |
where B and T represent the newly formed bone and tissue images, respectively. W is the weighting factor that can be chosen to suppress signals from the tissue or bone. In the case of a bone image, , which will generate an image with all the tissue signals subtracted. In the case of tissue image, , which will generate an image with all the bone signals subtracted.
It should be noted that, the above analytical formulation for the weighting factor is only valid for monogenic energy x-ray beams. In practice, the x-ray beams used in dual-energy imaging are polychromatic. In this case, the effective attenuation coefficient should be used. However, as the x-ray spectrum varies with attenuation, it is impossible to calculate the exact effective attenuation coefficient and the weighting factor analytically. In this study, the subtraction coefficient was determined manually by selecting the coefficient that ensured a minimal bone (tissue) signal on the tissue (bone) images.
2.2. The dual-energy system
Recent advances in digital radiography have led to the introduction of new digital flat-panel detectors. These detectors possess high spatial resolution (∼ 200 um), high quantum efficiency (peak DQE > 0.6) and are capable of acquiring images at high frame rates. (Floyd, Warp et al. 2001)
New possibilities for dual-energy imaging with flat-panel detectors exist for both radiography and fluoroscopy due to their ability to acquire low and high energy images sequentially. A CsI-based flat panel detector (PaxScan 4030A, Varian Medical Systems) capable of acquiring image sequences over a maximum area of 40 × 30 cm2 was used for this study. The flat panel system automatically performs dark-field and gain corrections on each acquired image.
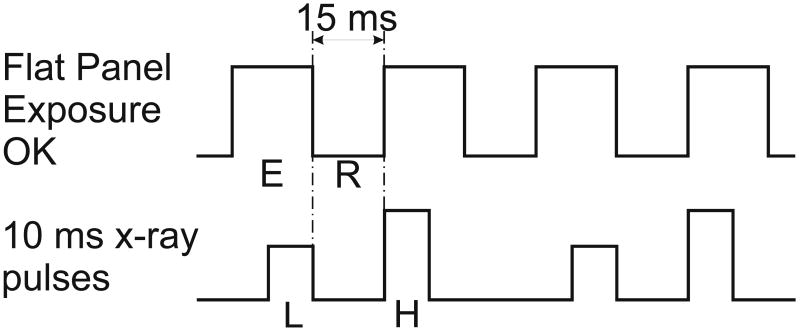
A flat panel based dual-energy imaging system was recently constructed for cardiac imaging (Xu, Ducote et al. 2005). It consists of a digital flat panel detector and a x-ray tube configured on an optical bench to allow for dual-energy image acquisition. An optical shutter provides dynamic high energy filtration which increases beam spectral separation and the image signal-to-noise ratio. The entire setup is mounted on an optical bench. The system has the ability to acquire images at a maximum of 30 frames per second. Since each dual-energy image requires the subtraction of a high and low image pair, the maximum effective dual-energy image frame rate of the system is 15 images per second. An interface between the flat-panel detector and the x-ray generator was developed so a signal from the flat panel can trigger the x-ray generator. The low energy x-ray pulse was triggered at the end of the low energy image frame and the high energy x-ray pulse was triggered at the beginning of the next image frame. Each x-ray pulse is 10 ms long. Figure 1 shows the timing diagram of the flat panel and the x-ray pulses. This timing scheme was used to minimize the time interval between the low and high energy images. It reduces miss registration artifacts in the dual-energy subtraction images. As shown in Figure 1, during each frame the flat panel is ready for x-ray exposure for about 18 ms (E), then, there is a 15 ms interval (R) for readout of the flat panel. The x-ray pulses are synched to avoid x-ray exposure during the readout time. Thus, the minimum time interval is 15 ms between the low (L) and high (H) energy x-ray pulses. Two sequential flat panel frames provide one dual-energy subtracted frame.
Figure 1.
The timing diagram of the flat panel and the x-ray pulses. During each frame the flat panel is ready for x-ray exposure for about 18 ms (E), then, there is a 15 ms interval (R) for readout of the flat panel. The low (L) and high (H) energy x-ray pulses are synched with the flat panel to avoid x-ray exposure during the readout of the flat panel.
2.3. Animal studies and image acquisition
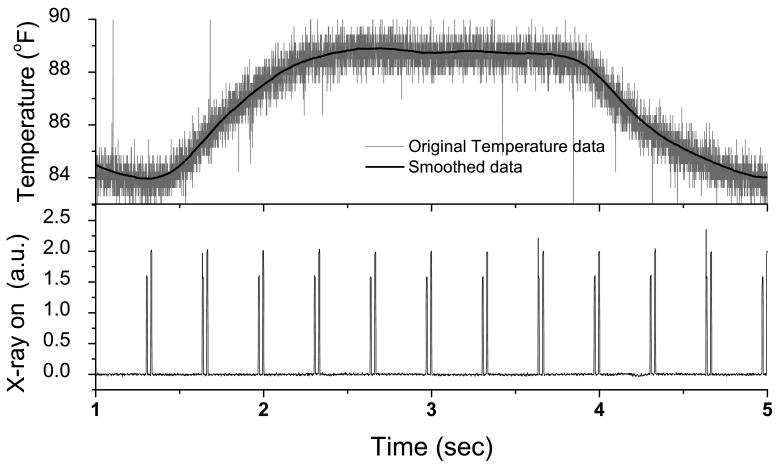
Anesthetized swine were mechanically ventilated and imaged using the dual-energy system. Additionally, a thermocouple placed in-line with the tracheal tube was used to obtain an external respiratory surrogate signal. Temperature was continuously recorded at 2000 samples per second throughout the experiment (Biopac Systems, Inc.; Santa Barbara, CA). The temperature measured at the thermocouple increases as warm air is exhaled and decreases as room temperature air is inhaled. The x-ray-ON signal from the generator was also recorded along with the temperature to provide a time stamp for the images. Figure 2 shows an example of the recorded temperature and x-ray pulse signal at 3 dual-energy image pairs per second. The “x-ray on” signal come in groups of 2 pulses that are close to each other. The first one indicates the time of low-energy image and the second one indicates the time of high-energy image. The time gap between these images is 15 ms. The temperature varies between 84 °F and 89 °F within a breathing cycle. The original temperature signal is very noisy due to the electronic noise from the temperature sensor. A running average filtering with a window size of 50 ms was used to suppress the noise. Figure 2 shows that the filter effectively removes noise while preserving the breathing pattern.
Figure 2.
An example of the recorded temperature in the tracheal tube and x-ray pulse signal at 3 dual-energy image pairs per second. The original temperature data was shown in gray and the smoothed data was shown in black line. The “x-ray on” signal come in groups of 2 pulses that are close to each other. The first one indicates the time of low-energy image and the second one indicates the time of high-energy image. The time gap between these images is 15 ms.
Data were obtained in two sections. In the first section, the dual-energy images were acquired at 15 pairs of dual-energy frames per second for 15 seconds. The data acquired in this section will be used to study the feasibility of lung motion and kinetic evaluation. It will also be used to evaluate the correlation between the temperature signal and the position of lung structures. In the second section, the dual-energy images were acquired at 3 pairs of dual-energy frames per second for 165 seconds. During the second section, the ventilator was manipulated to vary the respiratory frequency (15-20 rpm) and volume (400-650 cc), simulating a changing respiratory pattern. The data from the second section were used to evaluate the adaptive tumor position estimation algorithm (see section II.4).
The dual-energy images were acquired with detector entrance exposure of approximately 200 μR per frame, which provides a gray level of approximately 80% of the detector saturation. The images were acquired with the flat panel in “zoom-in” mode, providing an image size of 1024×768 pixels and a field of view of 20×15 cm. Because the animal's chest region only covers the central part of the image, the x-ray beam was collimated and the images were cropped. This yielded a final image size of 512×768 pixels. The x-ray parameters for the low energy images are: 60 kVp 1.25 mAs. For the high energy image, 120 kVp and 1.75 mAs were used with addition of 0.8 mm silver filter. Figure 3 shows a set of low energy image, high energy image and soft-tissue image. The soft tissue image was obtained using a subtraction weighting factor wt of 0.35. The soft-tissue image is free of miss-registration artifact.
Figure 3.
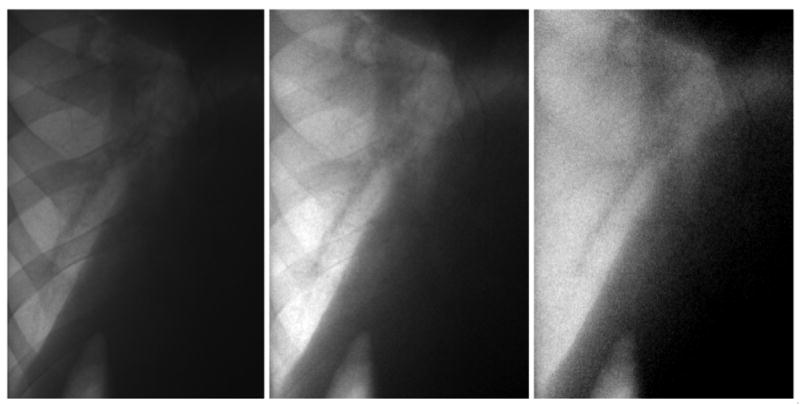
From left to right: low energy image, high energy image and the soft-tissue image after dual-energy subtraction with weighting factor wt of 0.35. The dark shadow on the top-right corner is the heart.
2.4. Image processing and analysis
2.4.1. Dynamic soft-tissue images using Dual-energy subtraction
The acquired sequence of low and high energy images was grouped into pairs and log subtraction was performed, as described in section 2.1, to obtain soft tissue images. The subtraction coefficient was determined manually by selecting the coefficient that ensured a minimal visible bone signal on the image. This process produced a sequence of dynamic soft-tissue images. The image sequences with 15 pairs of dual-energy frames per second will result in 15 soft-tissue frames per second. The image sequences with 3 pairs of dual-energy frames per second will result in 3 soft-tissue frames per second.
2.4.2. Temporally subtracted soft-tissue images for regional ventilation study
During respiration, the air volume and density of the lung change during respiration. This changes the x-ray attenuation and image intensity in the lung region during the respiratory cycle. Temporal subtraction images may reveal local changes in lung density. The 15 f/s soft-tissue sequence was used to generate a sequence of temporal subtraction images. However, in order to increase the difference between the frames, only one of every five frames in the sequence was used for the temporal subtraction. This produced a temporal subtracted sequence of 3 f/s. To further reduce the noise, temporal subtraction images were binned by 8×8 pixels. The final images have a pixel size equivalent to 1.6 × 1.6 mm2, similar to the pixel size in standard lung ventilation scintigraphy study (Petersson, Sanchez-Crespo et al. 2004; Xu, Moonen et al. 1998).
2.4.3. Motion tracking of lung anatomic features
With a dynamic sequence of soft-tissue images, it becomes possible to automatically track the position of anatomic features in the lung, such as tumors and pulmonary arteries. In this study, a branch of pulmonary arteries was selected as the tracking target. A previously reported algorithm (Robert, Komljenovic et al. 2005) designed for cardiac imaging applications was implemented to track a moving object in the images. A region of interest (ROI) was selected by the user in the first frame, and defined as a template image. Every subsequent frame was scanned for the location where the template ROI and target image had the strongest similarity, as measured by the normalized cross-correlation. During the search, the ROI was scanned in both the horizontal and vertical directions. This process of image registration allows users to determine the target shift in every subsequent frame relative to the first frame.
Restrictions can be set by the user to narrow the search window and prevent spurious signals from distant parts of the image from interfering with object tracking. In the event that the object's shape evolves over time, the template image can be updated from one frame to the next. The motion tracking was performed on both soft-tissue image sequences and high-energy image sequences.
2.4.4. Tracking precision
In order to evaluate the tracking precision, motion tracking based on soft-tissue image was performed for two breathing cycles. When breathing was stable, the position of the target at the same phase of the breathing cycle should be approximately identical (i.e. the plot of the coordinates from one branch cycle against the other should follow an identity line). However, tracking precision is limited by the image noise. This uncertainty in tracking will cause the plot to be scattered. The degree of scattering can be used as an indication of tracking precision.
2.4.5. Adaptive motion prediction
It may be possible to track tumor location with dynamic dual-energy images in real-time during radiation therapy. The obtained real-time tumor location can be used for respiratory gated radiation therapy. However, in order to minimize patient dose and x-ray tube loading, dual-energy images should be acquired at a low frame rate. During the time intervals between subsequent images, the tumor location may be predicted from the surrogate signal, providing a correlation with the tumor position. Previous studies have shown that external surrogate signals and tumor position are correlated. However, large inter- and intra-fraction variations of the correlation still exist. If the actual tumor position can be determined from time to time during the therapy using low frame rate dual-energy images, the correlation model between the true position and the external surrogate signal can be adapted according to the changing pattern of patient respiration. The surrogate signal derived tumor position will be used for respiratory gating.
In this study, the temperature within the tracheal tube was used as the surrogate signal. The correlation between the position of the target (Zi) and temperature-based breathing phase (Ti) was modeled with a second order polynomial: Zi = A + B*Ti + CTi2. The coefficients A, B and C will be determined from (1) a nonlinear least-squares minimization of the second order polynomial to the recorded target positions and (2) temperature measurements using the Levenberg-Marquardt algorithm. The index i ranges from 1 to the total number of position and temperature pairs (J) curve-fitted with the polynomial. The size of J is user-defined. The target location (ZJ+1) at time tJ+1 is predicted from the measured temperature (TJ+1) and pre-determined coefficients for a history of previously recorded target positions and temperature measurements (i=1 to J). The database of target positions (Zi) and measured temperatures (Ti) is continuously updated after each newly-acquired dual-energy image. Subsequently, coefficients for the best second order polynomial curve-fit to the data in the database are also updated. Target positions during the interval before the next image acquisition can be predicted using the continuously monitored temperature and pre-determined values of A, B and C.
Predicted target positions were compared to the actual target positions, as determined from dual-energy images. Although images were acquired at 3 dual-energy frames/sec, imaging rates that ranged from 0.1-3.0 frames per second were investigated by skipping 0 to 5 frames for every data point used to determine the coefficients. The root mean square (rms) error between the predicted target position and its true location was quantified for all data points.
3 Results
3.1 Dynamic soft-tissue images using Dual-energy subtraction
Figure 4 shows a sequence of low energy (upper row), soft-tissue (middle row) and high energy (bottom row) images. Images from left to right capture the different time points along the breathing cycle, which are indicated by the circles on the respiratory surrogate signal plot at the top. The frames in the sixth column were taken at the end of inspiration. The frames in the last column were taken at the end of expiration. Clearly, the rib signal has been successfully removed from the soft-tissue images. The heart is at the top right corner of the images, and the diaphragm and abdomen are at the right lower corner. Branches of lung vessels are clearly visible in the images.
Figure 4.
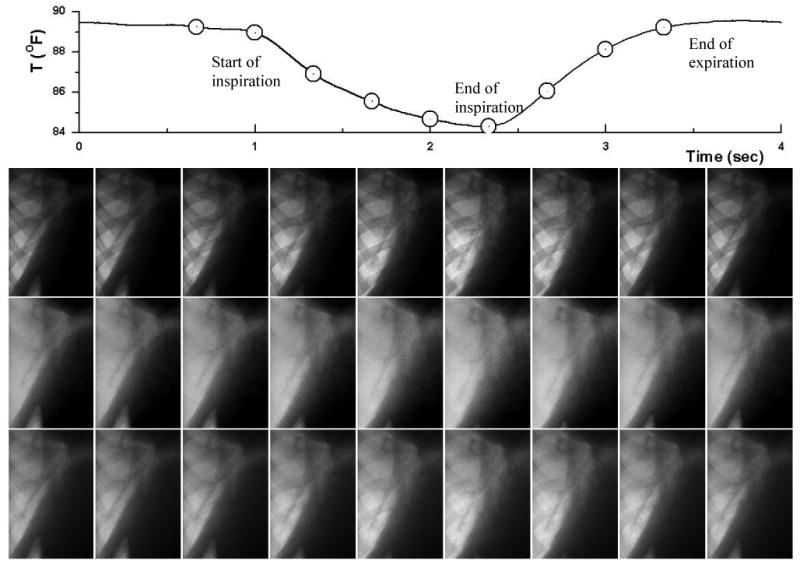
A sequence of low energy (upper row), soft-tissue (middle row) and high energy (bottom row) images. Images from left to right capture the different time point along the breathing cycle (indicated by the circles on the respiratory surrogate signal plot at the top).
3.2 Temporal subtraction
Figure 5 shows the time subtracted sequences for low energy (upper row), soft tissue (middle row) and high energy (bottom row) images. The gray color indicates no change in pixel values between the two sequential frames, yellow to red indicates an increase in pixel values and light blue to dark blue indicate an decrease in pixel values. The latter happens in the inspiration phase (columns 2-5) when lung density is reducing. The blue color indicates a decrease, which happens in the expiration phase (columns 6-8). The strongest signal in the temporal subtracted images is located at the edge of diaphragm. This is the result of its motion during the respiration. In the lung region, the signal should be quite uniform because this is a healthy animal and the lung density at different regions should vary similarly during the respiration. Compared to low energy and high energy images, temporal subtracted soft-tissue images show much less artifacts – making it more suitable for evaluating regional lung function.
Figure 5.
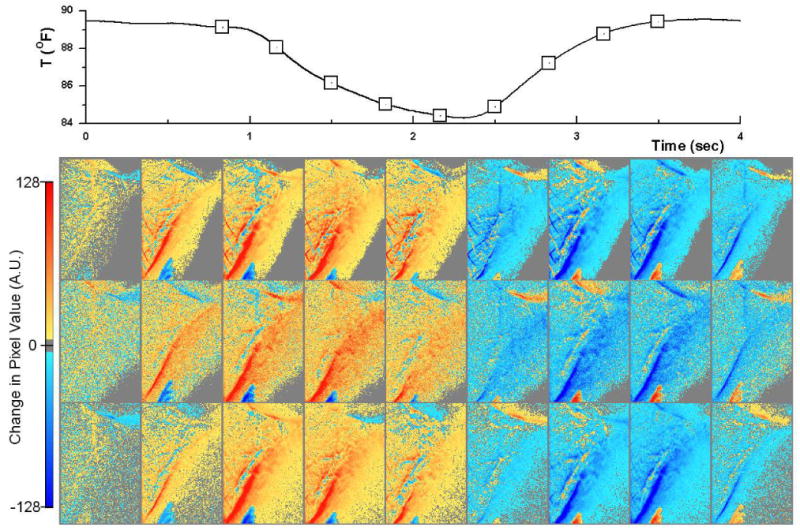
Time subtracted sequences for low energy (upper row), soft tissue (middle row) and high energy (bottom row) images. The gray color indicates no change in pixel values between the two sequential frames, yellow to red indicates an increase in pixel values. The blue color indicates a decrease. The time point of each frame is also indicated by the squares on the respiratory surrogate signal plot at the top.
III.3 Motion tracking of lung anatomic features
Figure 6 shows the automatic tracking of a lung anatomic feature (in this case, a vessel bifurcation) on high energy images (a) and soft-tissue images (b). The high energy images were chosen for comparison since they are expected to perform better than low energy images. The first frame indicates the region of interest outlining the feature to be tracked. The time points of the frames #2 to #10 are the same as those nine frames shown in Figure 4. The following frames show the location estimated by the image registration algorithm (indicated by the square) and trajectory of such feature throughout the respiration cycle. Figure 6a shows that the tracking failed with the high energy image due to the rib signal: the image registration could not follow the vessel feature and stayed at the edge of a rib. Figure 6b shows the trajectory of the feature was successfully identified on the soft-tissue images. There is a large displacement that occurs in the superior-inferior (SI) direction and only slight motion in the left-right (LR) direction.
Figure 6.
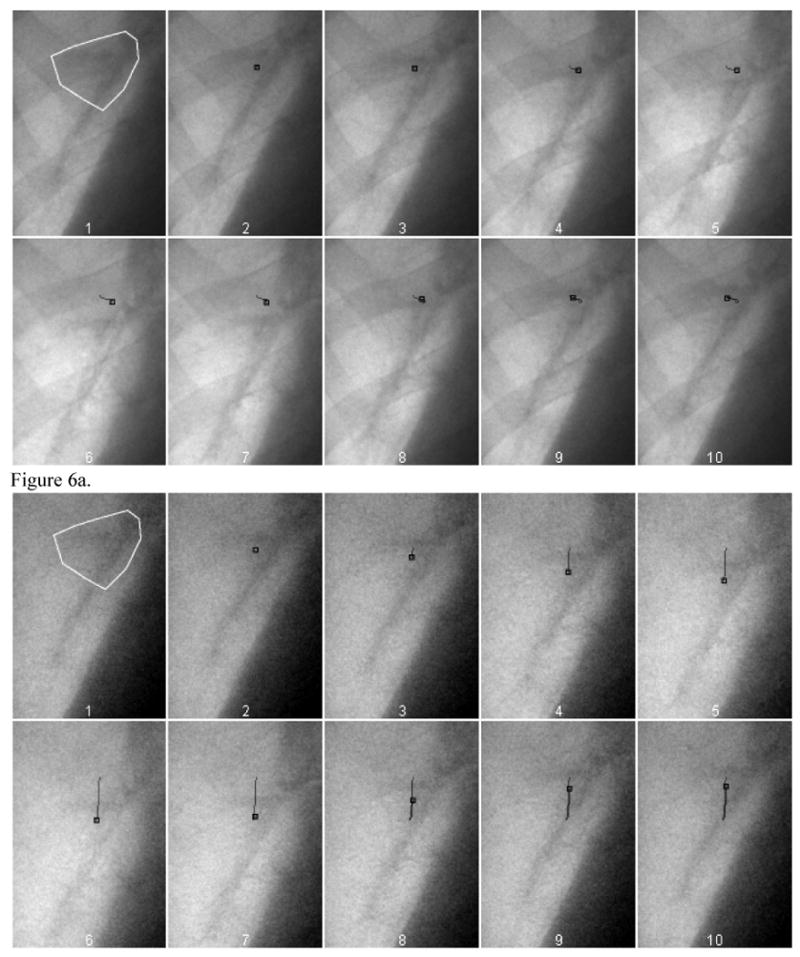
The automatic tracking of a lung anatomic feature (in this case, a vessel bifurcation) on high energy images (a) and soft-tissue images (b). The feature to be tracked is outlined by a white polygon in the first frame. The small black square indicates. The small black square indicates the location of the best estimate provided by the tracking program for the feature in each of the frames. The black line shows the path of the motion.
3.4 Tracking precision
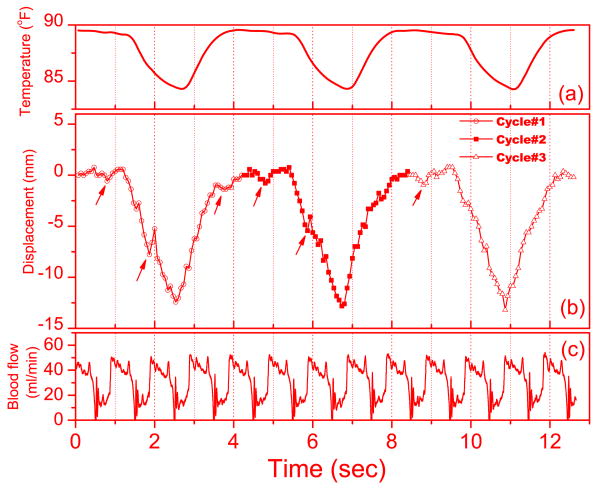
The results of motion tracking performed on one soft-tissue image sequence are presented in Figure 7. Figure 7a is the recorded temperature in the tracheal tube. Figure 7b shows the motion of the vessel feature in the superior-inferior (SI) direction for three breathing cycles. Figure 7c is the recorded blood flow of the left anterior descending coronary artery measured using a transit-time ultrasound flow probe (Transonic systems, Inc. Ithaca, NY). The blood flow shows that the cardiac cycle of the animal is about 1 second. Because the tracked vessel feature is close to the heart, the cardiac motion introduces additional motion of the feature. Thus, the small dips on the displacement curve in Figure 7b (indicated by the arrows) are in sync with the cardiac cycles. Also shown in Figure 7, the temperature signal has a slight lag (about 0.1 s) behind the lung motion.
Figure 7.
Results from the motion tracking based on one soft-tissue image sequence: (a) the temperature in the tracheal tube (b) Motion of the vessel feature superior-inferior (SI) direction during 3 breathing cycles. (c) Measured Blood flow in the left anterior descending coronary artery. The cardiac cycle is indicated by the periodical change of the blood flow. The arrows in (b) indicate the small dips that are in synch with the cardiac cycles.
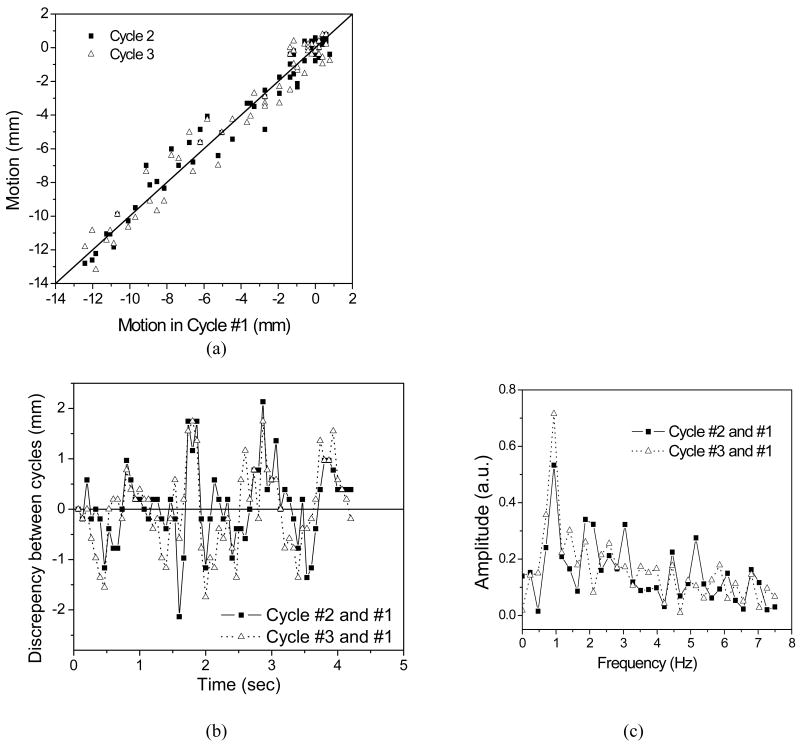
Figure 8a plots the SI displacement during breathing Cycle #2 and #3 with respect to that of Cycle #1. The data points are scattered around the identical line (solid line). This indicates a discrepancy in the displacement between breathing cycles. Figure 8b shows the discrepancy in SI direction during Cycle #2 and Cycle #3 relative to Cycle #1 with standard deviations of 0.77 mm and 0.84 mm, respectively. The values for the left-right (LR) direction are 0.40 mm and 0.48 mm, respectively. Because the above values are standard deviations between two localization runs in two different cycle, the tracking precision of a single localization can be estimated by dividing the above values by factor of . This gives an average precision of 0.57 mm in the SI direction and 0.31 mm in the LR direction.
Figure 8.
Tracking repeatability analysis: (a) SI displacement during breathing Cycle #2 and #3 against that of cycle #1 (The line indicates the identical line.) (b) The discrepancy in SI direction during Cycle #2 and Cycle #3 relative to Cycle #1. (c) The Fourier transform of the discrepancies between Cycle #2 and #1, and between Cycle #3 and #1.
As mentioned above, the cardiac motion causes spikes and dips on the displacement curve. This additional motion is not in sync with the breathing cycle and can contribute to the discrepancy discussed above among different breathing cycles. Figure 8c shows the Fourier transform of the discrepancies between Cycle #2 and #1, and between Cycle #3 and #1. Both look very different. However, they both have a peak at about 1 Hz, which is coincidental with the heart rate of the animal as indicated in Figure 7b.
Please note that the above repeatability study used cycle #1 as reference. This selection is arbitrary. Other cycles can also be used as the reference. However, limited by the space, only the results with the cycle #1 as reference are presented
3.5 Adaptive motion prediction
Predicted target positions were compared to the actual target positions. The actual target positions were estimated from the dual-energy images using the method described in section 2.4.3. It should be noted that the term “actual” is only relative to the prediction. The real true position of the target is unknown in this study.
Although images were acquired at 3 dual-energy frames/sec, imaging rates that ranged from 0.1-3.0 frames per second were investigated by skipping 0 to 5 frames for every data point used to determine the coefficients. The root mean square (rms) error between the predicted target position and its actual location was quantified for all the data points.
Figure 9 shows the predicted target position plotted with the actual position. It shows that the prediction can adapt to changes in breathing frequency and amplitude. The error is relatively larger at the end of inhalation phase. However, this state is not used for Linac gating with free breathing. The rms and maximum errors for imaging rates of 0.1-3.0 frames per second that use different database sizes are tabulated in Table 1. The average RMS error is (1.1 ± 0.3) mm. Accuracy improves with frame rate and database size. However, there are some exceptions. For example, the result from 0.25 Hz frame rate is inferior to that of 0.1 Hz. This is because the 0.25 Hz is close to the respiratory frequency. As a result, the database always samples at the same phase of the respiratory cycle. This does not represent the whole range of motion. It should be noted that the lower frame rate and/or larger database size will cause a larger lag when adapting to a changing respiratory pattern. Thus, these two parameters should be patient-dependent. In this particular animal study, 0.75 Hz frame rate with 20 frames of database provided a good compromise of accuracy and x-ray dose. Although 3.0 Hz frame rate gave the best results, it only reduced the maximum error by 0.2 mm, but with 4 times more exposure. If this technique is to be implemented clinically, a trial run of dual-energy tumour motion tracking/prediction should be performed during the treatment planning stage. Then, the two parameters should be optimized using the above method.
Figure 9.
The actual and the predicted target position as a function of time. The breathing frequency was change from 15 rpm to 20 rpm at 32 sec and was change to 17 rpm at 60 sec. Frame rate was 3 Hz and database size was 15.
Table 1.
RMS error (maximum error) in millimeters for different imaging rates and database sizes.
| Frame rate (Hz) | Database size | |||
|---|---|---|---|---|
| 5 | 10 | 15 | 20 | |
| 0.10 | 1.3 (7.3) | 1.2 (6.1) | 1.1 (4.0) | 1.0 (3.5) |
| 0.25 | 2.7 (20.8) | 1.6 (17.1) | 1.2 (4.1) | 1.1 (3.6) |
| 0.50 | 1.1 (6.7) | 1.0 (3.9) | 1.1 (4.0) | 1.1 (3.8) |
| 0.60 | 1.0 (5.6) | 1.0 (4.9) | 1.0 (4.4) | 1.0 (4.3) |
| 0.75 | 1.1 (4.2) | 0.9 (3.0) | 0.9 (2.8) | 0.9 (2.7) |
| 1.0 | 1.1 (3.3) | 1.0 (3.3) | 1.0 (3.0) | 1.0 (3.0) |
| 1.5 | 1.1 (4.5) | 0.9 (3.0) | 0.9 (2.5) | 0.9 (2.7) |
| 3.0 | 1.5 (7.5) | 1.0 (3.4) | 0.9 (2.4) | 0.9 (2.5) |
4. Discussion
As shown in Figure 3, there is no visible motion artifact in dynamic dual-energy images. Due to the extremely short time gap of 15 ms, the lung motion during this short gap is negligible. Unlike other digital dual-energy chest x-ray techniques, the proposed technique does not require complex image registration between the low and high energy images.
The temporal subtracted soft-tissue images provide information on regional variations in lung tissue density. It is also possible to provide regional lung function information for the diagnosis of lung diseases where some regions of the lung is blocked and shows abnormal lung density variation. Examples include emphysema and chronic obstructive pulmonary diseases. In this study, temporal subtracted soft tissue images have shown uniform ventilation on a normal animal. Future studies with abnormal patients are required to further investigate its potential with this technique.
This study was done with animals. However, the dual-energy beam parameters and the exposures with different patient thickness were evaluated previously (Xu, Ducote et al. 2006). When the patient's thickness ranges from 16 cm to 32 cm. The skin exposure ranges from 4.4 mR to 38 mR per dual-energy frame. The effective dose ranges from 1.1 μSv to 6.6 μSv per dual-energy frame for a field of view of 20×15 cm2. For dynamic chest x-ray, the field of view can be as large as 40×30 cm2 (i.e. 4 times larger). So the effective dose will range from 4.4 μSv to 26.4 μSv per dual-energy frame depending on the thickness of the patient. As indicated by the results in section III.3 and III.4, 3 dual-energy frames per second is sufficient to assess the lung dynamic and vessel motion. Assuming a breathing cycle of 3 - 5 sec, up-to 15 dual-energy frames are required to cover one breathing cycle. The total effective dose to patient would be 66 μSv and 400 μSv for thin (16 cm thickness) and thick (32 cm thickness) patient, respectively. The effective dose is much lower than a thorax CT scan, which is in the range of a few mSv (Leswick, Webster et al. 2005). Additionally, the proposed technique provides a dynamic image, which otherwise would require a 4DCT. Studies have shown that 4DCT can introduce an effective dose in the range of 20 mSv (Carnes, Gaede et al. 2009; Mori, Ko et al. 2009). Thus, dynamic dual-energy technique can potentially be a low does alternative for 4DCT scan. It should be noted that, in contrast to CT, signal set of dynamic dual-energy imaging only provides motion information in 2D. However, 3D motion information can be obtained with two sets of orthogonal images, similar to the fiducial marker based real-time x-ray tracking technique proposed by Shirato et al (Shirato, Shimizu et al. 2000).
This animal study has shown that the soft-tissue targets can be tracked by dynamic dual-energy x-ray imaging with automatic computer algorithm. This only becomes possible when the interfering bone structures are removed by the dual-energy subtraction. Compared to the conventional lung x-ray fluoroscopy techniques that requires manual identification of tumor position by an expert (Cui, Dy et al. 2007; Lin, Cervino et al. 2009), the proposed technique is both faster and operator independent.
In this study, the precision of the technique was evaluated by evaluating the reproducibility between different breathing cycles. The accuracy of the technique, however, can only be evaluated by phantom studies with exactly known motions. This will be done in future studies.
Dynamic dual-energy imaging is very promising in tracking tumor motion. However, due to the radiation dose, it cannot be used as a solo real-time motion tracking technique for respiration gated or motion tracked radiation therapy. It should be combined with other non-ionization radiation surrogate signals to predict tumor position during treatment. The dual-energy imaging system should be used as a tool for updating the adaptive prediction model rather than a real-time tracking tool. In this study, the temperature in the tracheal tube was used as the external respiratory surrogate signal. This is because it was the only surrogate signal available to us at the time of the study. As shown in Figure 7, there is a slight lag of about 0.1 s between the temperature signal and the lung motion, this may due to the time that the air (into/out the lung) needed to flow through the tracheal tube and reach the thermal sensor, which is located a few centimeters from the animal's mouth. In this study, the adaptive prediction model seams to work fine with this small lag. We believe that other more standard surrogate techniques, such as skin marker and pressure belts, can also be used as long as they correlate with the actual motion of the target of interest.
5. Conclusion
A dynamic dual-energy chest x-ray technique has been presented and evaluated. In this healthy animal study, it has been demonstrated that with the removal of bone structures from the image, the lung vessels can be tracked with sub-millimeter precision. This indicates that the technique can be used to track lung tumors for motion assessment at a much lower dose compared to CT based techniques. Additionally, this technique is also faster and more accurate than manual techniques. This technique may also have the potential for lung function imaging such as regional ventilation and kinetic study. Future studies with more realistic patient subjects are required to further evaluate the potential of the technique.
Acknowledgments
This research was supported in part by Grant No. R01 HL083295 awarded by the NHLBI, DHHS.
References
- Carnes G, Gaede S, et al. A fully automated non-external marker 4D-CT sorting algorithm using a serial cine scanning protocol. Phys Med Biol. 2009;54(7):2049–66. doi: 10.1088/0031-9155/54/7/013. [DOI] [PubMed] [Google Scholar]
- Cui Y, Dy JG, et al. Multiple template-based fluoroscopic tracking of lung tumor mass without implanted fiducial markers. Phys Med Biol. 2007;52(20):6229–42. doi: 10.1088/0031-9155/52/20/010. [DOI] [PubMed] [Google Scholar]
- Floyd CE, Jr, Warp RJ, et al. Imaging characteristics of an amorphous silicon flat-panel detector for digital chest radiography. Radiology. 2001;218(3):683–8. doi: 10.1148/radiology.218.3.r01fe45683. [DOI] [PubMed] [Google Scholar]
- Hof H, Rhein B, et al. 4D-CT-based target volume definition in stereotactic radiotherapy of lung tumours: comparison with a conventional technique using individual margins. Radiother Oncol. 2009;93(3):419–23. doi: 10.1016/j.radonc.2009.08.040. [DOI] [PubMed] [Google Scholar]
- Keall PJ, Mageras GS, et al. The management of respiratory motion in radiation oncology report of AAPM Task Group 76. Med Phys. 2006;33(10):3874–900. doi: 10.1118/1.2349696. [DOI] [PubMed] [Google Scholar]
- Leswick DA, Webster ST, et al. Radiation cost of helical high-resolution chest CT. AJR Am J Roentgenol. 2005;184(3):742–5. doi: 10.2214/ajr.184.3.01840742. [DOI] [PubMed] [Google Scholar]
- Lin T, Cervino LI, et al. Fluoroscopic tumor tracking for image-guided lung cancer radiotherapy. Phys Med Biol. 2009;54(4):981–92. doi: 10.1088/0031-9155/54/4/011. [DOI] [PubMed] [Google Scholar]
- Molloi SY, Mistretta CA. Quantification techniques for dual-energy cardiac imaging. Med Phys. 1989;16(2):209–17. doi: 10.1118/1.596418. [DOI] [PubMed] [Google Scholar]
- Mori S, Ko S, et al. Effective doses in four-dimensional computed tomography for lung radiotherapy planning. Med Dosim. 2009;34(1):87–90. doi: 10.1016/j.meddos.2008.08.002. [DOI] [PubMed] [Google Scholar]
- Petersson J, Sanchez-Crespo A, et al. Physiological evaluation of a new quantitative SPECT method measuring regional ventilation and perfusion. J Appl Physiol. 2004;96(3):1127–36. doi: 10.1152/japplphysiol.00092.2003. [DOI] [PubMed] [Google Scholar]
- Plathow C, Ley S, et al. Analysis of intrathoracic tumor mobility during whole breathing cycle by dynamic MRI. International Journal of Radiation Oncology Biology Physics. 2004;59(4):952–959. doi: 10.1016/j.ijrobp.2003.12.035. [DOI] [PubMed] [Google Scholar]
- Robert N, Komljenovic PT, et al. A lesion stabilization method for coronary angiography. Phys Med Biol. 2005;50(6):1295–312. doi: 10.1088/0031-9155/50/6/017. [DOI] [PubMed] [Google Scholar]
- Shirato H, Shimizu S, et al. Physical aspects of a real-time tumor-tracking system for gated radiotherapy. Int J Radiat Oncol Biol Phys. 2000;48(4):1187–95. doi: 10.1016/s0360-3016(00)00748-3. [DOI] [PubMed] [Google Scholar]
- Tanaka R, Sanada S, et al. CARS 2004: Computer Assisted Radiology and Surgery, Proceedings. Vol. 1268. 2004. Sequential dual-energy subtraction imaging technique using a dynamic flat-panel detector during respiration; pp. 1251–1251. [Google Scholar]
- Tanaka R, Sanada S, et al. Evaluation of pulmonary function using breathing chest radiography with a dynamic flat panel detector: primary results in pulmonary diseases. Invest Radiol. 2006;41(10):735–45. doi: 10.1097/01.rli.0000236904.79265.68. [DOI] [PubMed] [Google Scholar]
- Tanaka R, Sanada S, et al. Detectability of regional lung ventilation with flat-panel detector-based dynamic radiography. J Digit Imaging. 2008;21(1):109–20. doi: 10.1007/s10278-007-9017-8. [DOI] [PMC free article] [PubMed] [Google Scholar]
- Tanaka R, Sanada S, et al. Breathing chest radiography using a dynamic flat-panel detector combined with computer analysis. Med Phys. 2004;31(8):2254–62. doi: 10.1118/1.1769351. [DOI] [PubMed] [Google Scholar]
- Xu JH, Moonen M, et al. Inhomogeneity in planar ventilation scintigraphy of emphysematous patients. Clin Physiol. 1998;18(5):435–40. doi: 10.1046/j.1365-2281.1998.00120.x. [DOI] [PubMed] [Google Scholar]
- Xu T, Ducote JL, et al. Quantification of coronary artery calcium using real time dual energy subtraction based on a flat panel detector. Medical Physics. 2005;32(6):2157–2157. doi: 10.1118/1.2198942. [DOI] [PubMed] [Google Scholar]
- Xu T, Ducote JL, et al. Feasibility of real time dual-energy imaging based on a flat panel detector for coronary artery calcium quantification. Med Phys. 2006;33(6):1612–22. doi: 10.1118/1.2198942. [DOI] [PubMed] [Google Scholar]


